Phil Garton1
The idea of Australia establishing a sovereign wealth as a response to the challenges posed by the resource boom has attracted considerable interest. Some argue that a fund investing in foreign assets, as is done in Chile and Norway, could ease pressures on trade-exposed industries resulting from the high Australian dollar. This article examines how effective this might be, drawing on comparative experience in recent resource booms in the three economies.
Introduction
A number of commentators have argued that Australia should consider establishing a sovereign wealth fund as a way to better manage the current resource boom by saving a greater share of the tax revenues arising from the boom. Proponents have in mind various objectives, with the main ones being to:
- ensure a larger share of unusually high incomes is saved for longer-term benefit rather than being used for current consumption;
- avoid pro-cyclical fiscal policy by stopping revenues being recycled back into the economy through tax reductions and increased government spending;
- protect the fiscal position against exposure to commodity price risks by accumulating financial assets that can be drawn on if commodity prices plunge; and
- dampen appreciation of the exchange rate resulting from the boom by investing in foreign assets, thereby relieving pressure on other trade-exposed sectors.
This article is concerned with the last of these objectives, extending analysis published in a recent speech (Garton and Gruen 2012). It does not attempt to take a position on the overall merits of establishing a sovereign wealth fund, but is concerned more narrowly with the question of whether accumulation of foreign assets through such a fund could have a significant effect on the exchange rate.
The article begins by outlining the elements that may be involved in a regime of this kind. It then outlines what economic theory suggests about likely impacts on the exchange rate. The final part of the paper presents a comparative analysis of recent resource boom experiences in Australia, Norway and Chile. This provides something of a natural experiment, as the three countries have had similar rises in their terms of trade, and Norway and Chile have had in place sovereign wealth fund regimes linked to resource revenues.
What is meant by a sovereign wealth fund in this context?
While the idea of a sovereign wealth fund has attracted a good deal of support, it is not always clear what its proponents have in mind. In considering exchange rate impacts it is important to be clear on what elements would be involved in such a mechanism.
A sovereign wealth fund can be defined broadly as a government-owned fund that invests in domestic and/or foreign financial assets. However, in the context of a resource boom, proponents of a sovereign wealth fund usually have in mind that fund accumulation would be linked in some way to government revenues derived from the boom. This could be done by hypothecating a specific stream of revenues derived from the resources sector, or through some other mechanism to ensure above-normal revenues are saved in the fund.
Another key element not always identified explicitly in discussions on this issue is that a sovereign wealth fund would need to be combined with fiscal rules to ensure that it results in a genuine increase in government saving, and is not offset by increased borrowing in the rest of the budget. Such rules can be viewed as the central element of both the Norwegian and Chilean regimes.
Norway’s Government Pension Fund Global is often cited as a model for managing resource booms. This arrangement has three key features:
- all government revenues from oil and gas are hypothecated to the fund;
- the fund is invested solely in foreign equities and fixed income assets; and
- the medium-term objective for the structural budget deficit, excluding oil and gas revenues, is set at 4 per cent of accumulated funds (the assumed long-term real rate of return on fund assets).2
The third element is designed to preserve the real value of the fund over time, with only the fund earnings available to finance current spending, while retaining flexibility for fiscal policy to respond to economic conditions in the short-term.
An alternative model is Chile’s Economic and Social Stabilisation Fund, which also invests solely in foreign assets. This fund is linked to a structural budget balance objective that is based (in addition to the normal output gap) on estimates of equilibrium prices for copper and molybdenum over a 10-year period. This arrangement is designed to ensure that revenues arising from above-normal minerals prices are saved in the fund, which can be drawn down when prices fall below normal.
The difference between the Chilean and Norwegian regimes reflects their differing objectives. Norway’s is a long-term savings fund, designed to ensure revenues from finite oil and gas reserves are saved for the benefit of future generations. Chile’s is a stabilisation fund, designed to smooth the fiscal and macroeconomic effects of fluctuations in minerals prices. It is not intended to deliver a structural increase in saving in response to a rise in prices that is judged to be structural.
Notwithstanding these differences, the Norwegian and Chilean regimes have in common two elements relevant to considering exchange rate impacts:
- a fiscal rule that ensures higher budget surpluses when relevant commodity prices are higher; and
- investing surpluses in foreign financial assets, rather than domestically.3
The terms of trade and the exchange rate
In considering how arrangements of this kind might affect the exchange rate, it is important to first understand why a rise in the terms of trade normally results in currency appreciation.
While the nominal exchange rate is most directly thought of as matching demand and supply in the foreign exchange market, it also plays a broader role in equilibrating goods and services and financial markets.
Goods and services market equilibrium
In an open economy, goods and services market equilibrium relates primarily to matching demand and supply for non-tradables. These are goods and (particularly) services for which international trade is limited by transport costs, regulatory barriers or practical requirements for proximity between buyer and seller. For tradables, prices are generally determined on world markets and differences between demand and supply can normally be accommodated through trade deficits or surpluses.
This means that the effect of any policy on the real exchange rate can be considered in terms of how it affects the demand for non-tradables relative to their supply.4 Other things equal, a policy (other than monetary policy) that reduces the level of domestic demand could be expected to depreciate the real exchange rate.
A rise in prices for commodity exports raises the equilibrium real exchange rate primarily because it leads to an increase in demand for non-tradables. This occurs for two reasons:
- the increase in aggregate incomes resulting from higher export prices leads to an increase in spending on non-tradables (the spending effect); and
- higher profitability in the resources sector induces increased investment to expand productive capacity, raising demand for associated non-tradable inputs (the factor movement effect).
Unless the economy has substantial spare capacity, this increase in demand requires a rise in the price of domestic non-tradables relative to tradables, causing a real appreciation.5 Under a monetary policy regime that targets low inflation while allowing the exchange rate to float, this will occur primarily through nominal appreciation reducing domestic prices of tradables.6
It follows that this real appreciation could be prevented only through an offsetting reduction in demand for non-tradables or an offsetting increase in their supply. If the nominal exchange rate is prevented from appreciating, real appreciation will occur instead through higher domestic price inflation, relative to other countries.
Financial market equilibrium
Equilibrium in financial markets requires that expected returns on different financial assets be equalised, adjusted for risk. Other things equal, a rise in domestic interest rates relative to foreign interest rates can be expected to appreciate the nominal exchange rate. The exchange rate must rise, relative to its long-run equilibrium, in order to deliver a future depreciation that offsets the impact on expected returns of the higher domestic interest rate. The exchange rate can also be expected to appreciate if the relative risk premium on domestic assets falls, reducing the rate of return investors require to hold such assets.
From this perspective, a rise in resource prices (other things equal) leads to a rise in the equilibrium exchange rate for two reasons:
- the rate of return on capital invested in the resources sector rises; and
- the stimulus to domestic demand from higher incomes normally requires tighter monetary policy than otherwise, resulting in higher interest rates.
Foreign exchange market equilibrium
Equilibrium in the foreign exchange market requires that the demand for Australian dollars from foreigners match the demand for foreign currency from Australians. Demand for Australian dollars arises from export receipts, income payments from abroad and gross capital inflows, while demand for foreign currency arises from import payments, income payments to foreigners and gross capital outflows.
From this perspective, a rise in prices of resource exports raises the equilibrium nominal exchange rate because it increases demand for Australian dollars through both increased export receipts and increased capital inflows in response to higher returns on Australian assets.
Exchange rate impact of higher budget surpluses
If the fiscal rules associated with a sovereign wealth fund result in higher budget surpluses than would otherwise be achieved, this will mean the level of domestic demand is lower than otherwise. As demand for non-tradables will therefore be lower, the real exchange rate required for goods market equilibrium will also be lower.
From a financial market perspective, the lower level of domestic demand due to tighter fiscal policy means that monetary policy settings over time will be easier than otherwise.7 Lower domestic interest rates mean that a lower exchange rate is required to equalise risk-adjusted returns on domestic and foreign assets. This in turn reduces the demand for Australian dollars to acquire Australian assets.
Exchange rate impact of investing surpluses in foreign assets
The impact on the exchange rate of investing budget surpluses in foreign financial assets, rather than domestically, is less clear. At first sight it might appear obvious that acquisition of foreign assets must increase demand for foreign currency, and thereby depreciate the domestic currency. However, this is a partial equilibrium perspective and we need to consider general equilibrium effects.
In order to understand these effects it is useful to consider first the case where domestic and foreign assets are perfect substitutes. For an economy too small to affect global interest rates, this case implies that the supply of funds from abroad is perfectly elastic.
If budget surpluses are invested in foreign assets, other investors will need to absorb more Australian securities (and less foreign securities) than would have been the case had surpluses been used to acquire domestic financial assets or repay existing debt. If the supply of foreign funds is perfectly elastic, acquisition of these additional securities by foreign investors will add to demand for Australian dollars, offsetting the rise in demand for foreign currency from offshore investment of surpluses.
In the more realistic case where Australian and foreign securities are somewhat imperfect substitutes, the effect of investing surpluses offshore rather than domestically will depend on the size of these investments relative to total stocks of Australian and foreign securities. This determines the impact on portfolio balance: that is, on the share of domestic securities in global investor portfolios.
The basic idea behind this is that investors prefer to hold a balanced portfolio to diversify country-specific risks, and will demand a higher return (risk premium) to increase the portfolio share of a country’s securities.8 The higher return occurs through both an increase in yields and a depreciation of the currency. Higher yields also reduce domestic demand, so that a lower real exchange rate is needed for goods market equilibrium.
The stock of domestic and foreign securities provides an indication of the potential size of portfolio balance effects. According to the IMF’s Global Financial Stability Report, the global stock of debt and equity securities at the end of 2010 was worth around US$150 trillion. The ABS Financial Accounts indicate that the stock of debt and equity securities issued by Australian entities was worth around A$4 trillion, implying that Australian securities comprised about 2.7 per cent of the global portfolio.
These numbers imply that increasing this portfolio share by even 0.1 of a percentage point (from 2.7 to 2.8 per cent of the global portfolio) would require an offshore investment of $150 billion, more than 10 per cent of current GDP (and twice the size of the accumulation to date in the Future Fund). Even this would be a relatively modest portfolio shift —less than 4 per cent in proportional terms —so its impact on the exchange rate would likely also be modest.
Australia, Norway and Chile: comparing resource boom experiences
This section presents a comparative analysis of the experiences of Australia, Norway and Chile through their resource booms over the past decade, with a view to assessing how the Norwegian and Chilean regimes may have influenced the behaviour of their exchange rates compared to that of Australia.
Dimensions of the resource booms
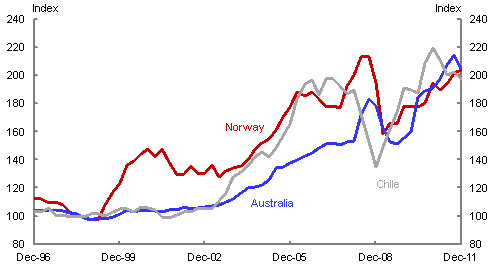
While Australia’s current experience of a once-in-a-lifetime terms of trade boom has attracted much comment, Norway and Chile have also experienced similar rises in their terms of trade (Chart 1). In all three countries, the quantity of imports that each unit of exports will buy has doubled since the late 1990s.
Chart 1: Terms of trade (1998=100)
Sources: ABS, OECD.
In Norway’s case, the rise in the terms of trade commenced much earlier, from 1999. While the terms of trade in Australia and Chile started to rise around the same time in 2003, the rise in Chile’s terms of trade was much steeper initially. The difference in terms of trade paths reflects primarily differences in key resources, which are oil and gas for Norway, iron ore and coal for Australia and copper for Chile.
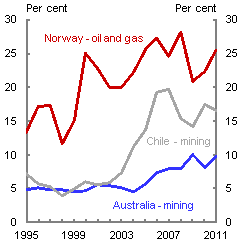
The resources sector also comprises a much larger share of the Norwegian and Chilean economies than that of Australia (left-hand panel of Chart 2). Norway’s oil and gas sector has grown from around 14 per cent of total factor incomes in the 1990s to around 25 per cent now. Mining in Chi
le has grown from around 6 per cent of factor incomes in the early 2000s to around 17 per cent now. In contrast, Australia’s mining sector still accounts for only 10 per cent of factor incomes, even though this share has doubled since the early 2000s.
Chart 2: Resource sector output
Share of factor incomes Real output (1999=100)
Sources: ABS, StatBank Norway, Central Bank of Chile, National Statistical Institute Chile.
Changes in these shares capture both output and price effects of the resources boom. It is useful to consider these two elements separately, as they link to the two key channels noted earlier through which higher commodity prices affect the economy: namely, the factor movement effect and the spending effect.
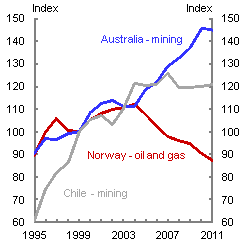
The right panel of Chart 2 highlights one key difference between the three booms. Output volumes in Norway’s oil and gas sector have been declining since 2003-04, reflecting limited remaining reserves of oil and gas, with production levels having already passed their peak. Mining output in Chile is no higher than its level six years ago. In contrast, mining output volumes in Australia have continued to grow, and the extent of mining investment still in the pipeline means that much of the expansion in mining output as a result of the current boom is still to come. This is significant because it means the pressures on the non-resource economy arising from the boom are significantly greater when the resource sector is expanding.
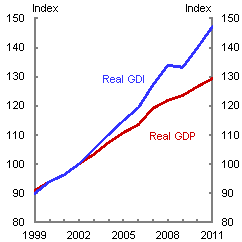
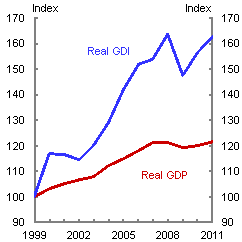
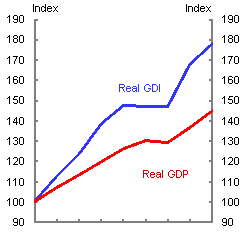
The extent of income gains from higher resource prices can be gauged by comparing growth in real gross national disposable income (income received by domestic residents) to growth in real GDP (Chart 3). This comparison suggests Norway’s terms of trade boom has boosted Norwegians’ real income growth by 41 per cent, while real income growth has been boosted by 33 per cent for Chileans and 18 per cent for Australians. The differences reflect the larger share of the resources sector in the Norwegian and Chilean economies.
Chart 3: Income effect of terms of trade booms
Australia (2002=100) Norway (1999=100)
Chile (2003=100)
Note: GDI is deflated by the implicit price deflator for gross national expenditure.
Sources: ABS, OECD, Central Bank of Chile.
Exchange rate behaviour during resource booms
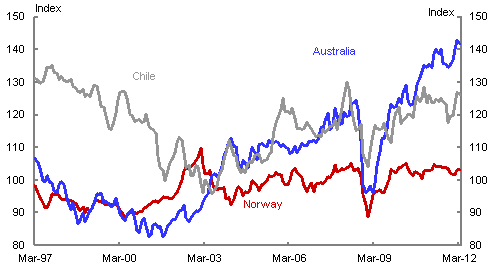
Chart 4 shows that the terms of trade boom in Australia has been associated with a substantial rise in the real exchange rate, which has appreciated by around 40 per cent using the CPI-based measure.
Chart 4: Real trade-weighted exchange rates (2003=100)
Source:IMF
In contrast, exchange rate appreciation has been much more limited in Norway, with the real exchange rate appreciating only about 10 per cent since its boom commenced in the late 1990s.
Chile has experienced an intermediate real appreciation of around 25 per cent over the same period, although its exchange rate is not high by historical standards, having depreciated significantly in the years leading up to the boom. Notably, Australian and Chilean real exchange rates appreciated at a similar rate between 2003 and 2010, with a significant gap emerging only over the past year.
What explains differences in exchange rate behaviour?
To what extent can the much smaller exchange rate appreciations in Norway and Chile be attributed to their sovereign wealth fund regimes? The earlier discussion concluded that impacts on the size of exchange rate appreciation are likely to come primarily from associated fiscal rules that ensure budget surpluses rise in line with increased resource-related revenues. Impacts from investing surpluses offshore are unlikely to be significant unless accumulated investments become very large.
Impact of fiscal regimes
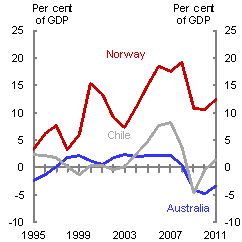
Since its terms of trade boom commenced in 1999, Norway has been running massive budget surpluses, rising from 3 per cent of GDP prior to the boom to a peak of 19 per cent of GDP in 2008 (Chart 5). Even after a large fall following the global financial crisis, surpluses have averaged 13 per cent of GDP since 2000. In Australia, by contrast, the terms of trade boom since 2004 has not been associated with any marked shift in the general government budget balance. The size of surpluses achieved in Norway reflects two factors (see Garton and Gruen 2012 for more detail):
- the Norwegian government captures a large proportion of the returns from oil and gas production; and
- the fiscal rule underpinning its regime ensures these revenues are saved, with the budget excluding oil and gas revenues averaging near balance over this period.
Accumulation of these budget surpluses has resulted in a massive build-up of financial assets held by the Norwegian government. The value of Norway’s sovereign wealth fund has reached nearly 130 per cent of GDP, which is reflected in the increase in general government net financial assets since the early 1990s (Chart 5).
Chart 5: General government financial position
Financial balance Net financial assets
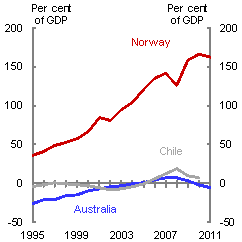
Note: Chilean financial balance is for central government only. Other data are for total general government.
Sources: OECD, IMF, Central Bank of Chile.
Chile’s fiscal rule also saw its fiscal position improve sharply from around balance in 2003 to a surplus of 8 per cent of GDP by 2007, before falling back into deficit following the global financial crisis. This is consistent with the intention of Chile’s fiscal regime, which is to play a macroeconomic stabilisation role rather being a means to increase long-term government saving.
As a result of the past accumulation of surpluses, the value of Chile’s sovereign wealth fund has grown to around 8 per cent of GDP, resulting in a similar improvement in government net financial assets.
Chart 6 shows that these movements in government financial positions in Norway and Chile have been reflected substantially in changes in current account balances and net foreign assets. This is important as it suggests that the impacts of the fiscal regimes in these countries have not been offset substantially by private sector behaviour.
Chart 6: External accounts
Current account balance Net foreign assets
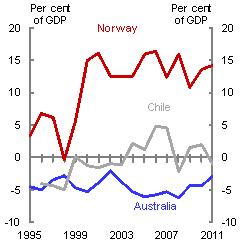
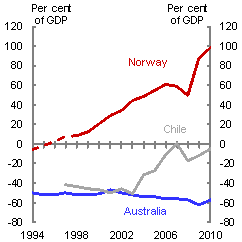
Note: Norwegian net foreign assets are interpolated between 1993 and 1998 as data are unavailable for these years.
Sources: ABS, OECD, Central Bank of Chile.
Chart 7 presents an alterna
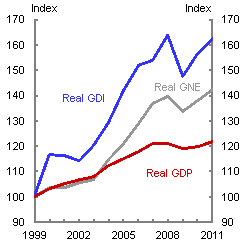
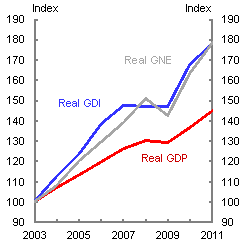
tive perspective which examines the extent to which income gains from terms of trade booms have resulted in increased gross national expenditure (GNE); that is, consumption and investment by government and private sectors.9 For Australia, the increase in national incomes, relative to GDP, has been matched by a similar increase in aggregate spending. This is consistent with the explanation outlined above; that a rise in the terms of trade can normally be expected to lead to an increase in domestic demand, which in turn requires a real exchange rate appreciation.
This is also true for Chile, although expenditure did grow more slowly than income over the initial period to 2007. In contrast, cumulative growth in national expenditure in Norway over the period of the boom has remained well below growth in national income. Indeed, up until 2004 real GNE had increased no faster than real GDP.
Chart 7: Expenditure out of income gains
Australia (2002=100) Norway (1999=100)
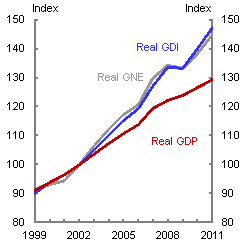
Chile (2003=100)
Sources: ABS, OECD.
The difference between Norway and Chile reflects partly the difference in fiscal policy stances shown in Chart 5. While Norway has had a lasting increase in budget surpluses, which have continued to limit the impact of higher national incomes on demand, Chile ran larger surpluses only in the pre-GFC boom period, but not more recently. This is consistent with the different objectives of the two country’s regimes noted earlier: long-term saving for Norway and stabilisation for Chile.
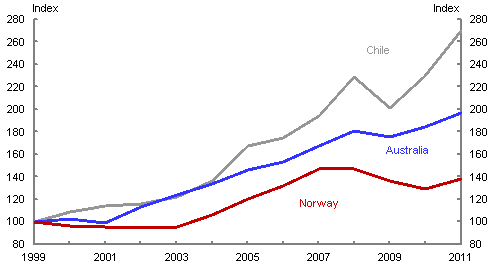
Another key factor has been the difference in investment responses to high commodity prices (Chart 8). While real investment in Chile and Australia has grown substantially faster than real incomes, real investment in Norway has not even matched growth in real GDP. Norway has experienced a much lesser increase in resource sector investment, which may be linked to the fact that the remaining life of its oil and gas reserves is limited (Garton and Gruen 2012). This has made it much easier for the fiscal regime in Norway to limit the impact of the boom on aggregate spending and, thereby, on the real exchange rate.
Chart 8: Real national gross fixed capital formation (1999=100)
Source: OECD
Differences in cyclical conditions
The combined impact of Norway’s fiscal regime and the absence of a resource sector investment boom is likely to explain much of Norway’s more limited real appreciation compared to Australia and Chile. Another factor likely to have influenced exchange rate behaviour is differences in cyclical conditions in the three economies, manifested in differences in the degree of spare capacity.
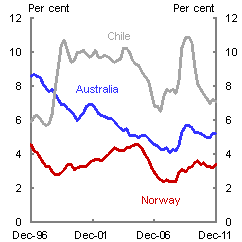
If an economy has more spare capacity this should reduce the need for its real exchange rate to appreciate in response to an increase in demand. This is difficult to assess by comparing unemployment rates, as natural rates of unemployment can vary considerably across countries and over time. The direction of the unemployment rate, however, provides an indication of whether spare capacity is tightening or easing. While unemployment rates have fallen in Australia and Chile over the course of their resource booms, this has not been the case in Norway, where the unemployment rate rose over the initial period of its boom (left-hand panel of Chart 9).
Chart 9: Indicators of spare capacity
Unemployment rate Core inflation less target
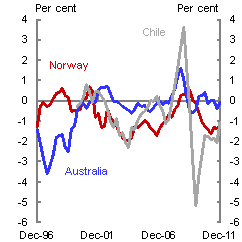
Note: Core inflation excludes food and energy for Australia and Chile and energy for Norway. Australian data are adjusted to remove the impact of the GST’s introduction in 2000.
Sources: OECD, StatBank Norway.
One way to assess the degree of spare capacity is from the direction of core inflation, which tends to decline when the economy falls below full capacity. The right-hand panel of Chart 9 shows the divergence of core inflation from the central bank’s inflation target or mid-point of its target band. Core inflation in Norway and Chile fell significantly below target in the early 2000s and again in the period since the GFC. This implies that both economies had significant spare capacity during these periods. In contrast, core inflation in Australia has not been significantly below target over the past decade, implying an absence of significant spare capacity.
The difference in cyclical conditions between Australia and the other two economies is also seen in differences in the stance of monetary policy. Norway and Chile began the 2000s with higher policy interest rates than Australia, but after considerable easing in the early 2000s have since been generally lower than Australian rates (Chart 10).
Chart 10: Interest rates
Central bank policy rate 10-year govt. bond yield
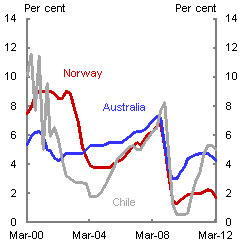
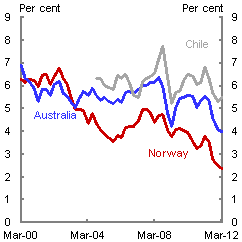
Sources: RBA, OECD.
Similarly, Norwegian long-term bond yields were similar to Australian yields in the early 2000s, but have generally been around 1½ percentage points lower since 2004. With Australia and Norway both being AAA-rated countries, this means that a higher Australia dollar is needed to make risk-adjusted returns equally attractive to global investors.10
A key factor likely to have contributed to continued easy monetary policy in Norway and put downward pressure on the exchange rate in recent years is the continued economic weakness in Europe and concerns over a possible crisis in the euro area. Norway is highly exposed to Europe, which accounts for more than 80 per cent of its exports, representing around one-third of GDP.
This leaves the question of what explains the recent divergence in Australian and Chilean real exchange rates, given that cyclical conditions in Chile have recently improved and monetary policy has been tightened. The Central Bank of Chile made substantial purchases of foreign exchange during 2011, although it is unclear how much impact these might have had, given the economic literature has generally been sceptical about the effectiveness of sterilised intervention.11 For the purpose of this article, however, the relevant point is that recent exchange rate behaviour appears to be unrelated to the operation of Chile’s sovereign wealth fund regime, given that the fiscal position has only just returned to surplus (Chart 5).
Conclusion
Some commentators have argued that establishing a sovereign wealth fund, as has been done in other resource-exporting economies like Norway and Chile, would help to relieve the pressures on trade-exposed sectors of the economy arising from the high Australian dollar.
Norway has experienced comparatively little real exchange rate appreciation over the course of its recent r
esources boom, despite a similar rise in its terms of trade to Australia and Chile. This appears to be due primarily to the impact of the fiscal objective associated with Norway’s regime, which has resulted in massive budget surpluses since the early 2000s. By capturing and saving the bulk of increased national incomes arising from the boom, Norway has limited the impact of the boom on domestic demand, which is the underlying driver of the real appreciation that is normally associated with terms of trade booms. The absence of a sizeable boom in resource sector investment has also been important in this regard.
In contrast, Chile’s real exchange rate had appreciated at a similar rate to Australia’s until quite recently. This probably reflects the size of Chile’s investment boom, which has meant that its fiscal regime was unable to prevent a rise in aggregate spending despite delivering large surpluses prior to the GFC. Further, these surpluses have been unwound since the GFC, consistent with the regime’s intended role as a stabilisation mechanism rather than a means to boost long-term saving. While it is unclear what explains the recent divergence between Chilean and Australian real exchange rates, it is unlikely to be related to the operation of the fiscal regime.
If Australia were to seek to emulate the Norwegian example, governments would need to target much higher budget surpluses than have been contemplated to date. For example, in order to save the same proportion of the increase in national income from the terms of trade as was achieved in Norway, Australian governments would have had to achieve budget surpluses averaging over 4 per cent of GDP over the past 8 years.
However, the economic structures of Australia and Norway are considerably different — Australia, for one, captures a much smaller share of the increased national income associated with resource booms (Garton and Gruen 2012). Furthermore, it is likely that the requirement would be even greater than this because of the larger surge in investment to expand resource sector capacity that has been occurring in Australia. This suggests, taking into account the favourable saving and macroeconomic stability outcomes already achieved during the current boom, that it would be inherently difficult, and not necessarily sensible to replicate the Norwegian experience, particularly within the current global economic environment.
References
Corden, M 2012, ‘The Dutch Disease in Australia: Policy Options for a Three-Speed Economy’, Melbourne Institute Working Paper 5/12
Frankel, J 2011, ‘A Solution to Fiscal Policy Procyclicality: the Structural Budget Institutions Pioneered by Chile’, NBER Working Paper 16945
Garton, P and Gruen, D 2012, ‘The Role of Sovereign Wealth Funds in Managing Resource Booms: a Comparison of Australia and Norway’, address by second author to the Third Annual Asia Central Bank and Sovereign Wealth Fund Conference, 23 February
International Monetary Fund 2010, ‘Strengthening Chile’s Rule-based Fiscal Framework’, Selected Issues Paper for the 2010 Article IV Consultation, Country Report No. 10/299
International Monetary Fund 2011, Chile: Staff Report for the 2011 Article IV Consultation, Country Report No. 11/260
International Monetary Fund 2012, Norway: Staff Report for the 2011 Article IV Consultation, Country Report No. 12/25
Jafarov, E and Leigh, D 2007, ‘Alternative Fiscal Rules for Norway’, IMF Working Paper 07/241
Ministry of Finance, Chile 2011, Annual Report Sovereign Wealth Funds 2010
Parkinson, M 2012, Macroeconomic Policy for Changing Circumstances, Annual Post Budget Address to the Australian Business Economists, 15 May.
Parkinson, M 2012, Macroeconomic Policy for Changing Circumstances, Annual Post Budget Address to the Australian Business Economists, 15 May.
Royal Ministry of Finance, Norway 2011, The National Budget 2012: A Summary
1 The author is from the Macroeconomic Policy Division, the Australian Treasury. This article has benefited from comments and suggestions provided by James Kelly and David Gruen. The views in this article are those of the author and not necessarily those of the Australian Treasury.
2 The structural balance adjusts the budget balance to remove the effects of the economic cycle, normally by estimating what the budget balance would be if the economy was always operating at non-inflationary full capacity.
3 A budget surplus, as conventionally defined, must be reflected in the accumulation of financial assets or the reduction in financial liabilities. Direct government investment in new physical assets is counted as government spending and reduces the measured surplus.
4 Prices of some domestic tradables may diverge from world prices due to factors such as product differentiation, imperfect competition and home bias in consumption. In this case, part of the real exchange rate movement will occur through a change in prices of domestic tradables relative to foreign tradables.
5 The real exchange rate could also be affected through tradables prices if the relevant commodity prices affect a larger share of the domestic price index than of foreign price indices. This effect is likely to be relatively minor for the commonly-used real exchange rate measure based on relative consumer prices.
6 For example, if the relative price of non-tradables is to rise by 10 per cent without affecting domestic inflation, non-tradables prices must rise by 3 per cent and tradables prices fall by 7 per cent (assuming non-tradables are around 70 per cent of the economy).
7 The extent to which tighter fiscal policy reduces domestic demand depends on, amongst other things, the size of the relevant multiplier, which is a function of a number of factors including the degree of spare capacity, and the composition and timing of fiscal consolidation.
8 Imperfect substitutability may also arise from factors that contribute to ‘home bias’ in investment of saving, including information imperfections and differences in legal and regulatory frameworks.
9 The current account balance is equivalent by definition to the difference between national disposable income and national expenditure. Hence, the gap between changes in GDI and GNE corresponds to the change in the current account over the same period.
10 Sovereign ratings for Australia and Norway are AAA for all three major credit rating agencies. Chile is rated Aa3 by Moody’s and A+ by Standard & Poors and Fitch.
11 The stated purpose of these purchases was to increase international reserves to a level comparable to other similar economies. While reiterating its commitment to inflation targeting and a floating exchange rate, the Central Bank of Chile also noted that ‘intervention should smooth the effects of the exchange rate adjustment’.