Will Devlin and Deepika Patwardhan1
Of the available measures of inflation expectations, those available with highest frequency are taken from financial market pricing — so-called ‘break-even’ inflation rates from the bond market and the market for inflation swaps. Bond market derived measures — which can be subject to both positive and negative biases — suggest medium-term inflation expectations are currently anchored within the Reserve Bank of Australia’s target band. Inflation swap rates — which can be subject to their own biases — also suggest that medium-term expectations are well contained. Finally, forward inflation expectations derived from the inflation swaps curve suggest that the market concurs with Treasury estimates that the introduction of the carbon price will have a modest, one-off impact on headline CPI of around 0.7 per cent in 2012-13.
Introduction
Given their ability to influence price and wage-setting behaviour in particular, inflation expectations play a key role in the determination of future inflation outcomes. As such, timely and reliable estimates of inflation expectations are an important input into the inflation forecasting process and, more generally, the determination of macroeconomic policy settings.
Measures of inflation expectations can be grouped into two broad categories: survey and market-based measures. Survey-based measures ask particular sub-sections of the community — such as market economists, consumers or trade union officials — what their expectations are for inflation over some defined period. While these measures can contain useful information, they are typically released with a lag and can be distorted by the systematic biases of the surveyed respondents.
This paper focusses on market-based measures, which directly infer market participants’ expectations for inflation from financial prices. These measures are readily available, updated in real time and, perhaps most importantly, reflect the collective actions of actors who have to back their views by ‘putting their money where their mouths are.’ Nonetheless, market-based measures are subject to their own biases, and the economic forecaster or macroeconomic policymaker must be aware of these when forming their views.
The paper is structured as follows. First, we examine inflation expectations taken from the market for government bonds, which have historically been the most widely used measure. Second, we look at the market for inflation swaps, which has developed into a viable alternative to bond market-derived measures. Using the inflation swaps curve to derive forward inflation expectations, we then assess the expected price impacts of the Government’s Clean Energy Future package. Finally, we discuss reasons for divergences in implied inflation expectations between the bond and inflation swaps markets.
Bond market ‘break-even’ inflation rates
The most widely used market-based measures of medium to long-term inflation expectations are those derived from the market for government bonds. Their use is based on the premise that (nominal) Treasury bond yields can be decomposed into three main components:2
- the real yield, which bond investors demand as compensation for postponing consumption;
- compensation for expected inflation over the term of the bond; and
- compensation for any potential variation in either of the above two components (also referred to as term and inflation risk premia, respectively).
In contrast, yields on Treasury indexed bonds — which pay a fixed coupon on the inflation-adjusted capital value of the bond — represent a real yield and compensation for its potential variation. By deduction, the difference between yields on nominal and indexed bonds — the ‘break-even’ inflation rate — can be regarded as representing the compensation investors demand for being exposed to inflation and to uncertainty around future inflation.3
The incorporation of an inflation risk premium potentially distorts bond market break-evens as a measure of inflation expectations. While it is possible to decompose break-even rates to get a cleaner estimate of the expected inflation component, this is a complex modelling exercise and, particularly given data limitations in the Australian market, is subject to some degree of imprecision (see, for example, Finlay and Wende 2011).
The use of bond market break-evens is also made somewhat problematic by the limited size and liquidity of the indexed bond market in Australia. While the market for (nominal) Treasury bonds is quite liquid, the market for Treasury indexed bonds is significantly less liquid (see Box 1). As a consequence, yields on Treasury indexed bonds likely trade at some premium relative to nominal Treasury bond yields — since investors will demand compensation for holding this liquidity risk. This, in turn, biases down implied inflation expectations taken from calculated break-even rates.
Box 1: The markets for nominal and indexed Treasury bonds
The Australian Government, via the Australian Office of Financial Management (AOFM), issues two types of medium to long-term debt securities to the public:4
- Treasury nominal bonds, which carry an annual (nominal) rate of interest fixed over the life of the security, payable six-monthly.
- Treasury indexed bonds, where the capital value of the security is adjusted for movements in the Consumer Price Index. Interest is paid quarterly, at a fixed rate, on the adjusted capital value. At maturity, investors receive the adjusted capital value of the security.
The bulk of the Commonwealth’s debt raising task has typically been met by the issuance of Treasury bonds, and the Treasury bond market has historically been the largest Commonwealth Government Securities (CGS) market as a consequence. Since the 2002-03 Review of the CGS market successive governments have committed to retaining a liquid and efficient CGS market. As discussed in the 2011-12 Budget, a panel of financial market experts reported that the CGS market should be maintained at around 12 to 14 per cent of GDP over time (around $200 billion at present), significantly higher than the previous target of $50 billion. There are currently 18 Treasury bond lines on issue, with maturities ranging from late 2012 out to 2027.
The issuance of Treasury indexed bonds was halted in 2003, and maturing bond lines saw the market shrink to a low of around $6 billion outstanding in 2008. In late 2009, however, the AOFM resumed its indexed bond issuance program and the market has since grown to just over $16 billion outstanding. At the 2011-12 Budget the Government announced it would support liquidity in the indexed bond market by maintaining around 10 to 15 per cent of the total CGS market in indexed securities. There are currently five indexed bond lines on issue, with maturities ranging from 2015 to 2030.
Owing partly to its limited size, the market for Treasury indexed bonds has typically been regarded as a significantly less liquid market. Since they are highly prized by portfolio managers with longer term inflation-linked liabilities to hedge — such as life insurers — Treasury indexed bonds tend to be very tightly held. As a result, secondary market trading in indexed bonds can be quite limited, particularly relative to (nominal) Treasury bonds.
That said, the size of this relative liquidity difference appears to have narrowed over recent years, largely due to reduced turnover of nominal Treasury bon
ds (Chart 1). There are likely several reasons for this reduction in turnover. It may reflect an increased preference by investors and bond traders to use derivatives referencing Treasury bonds (such as futures and swaps) to adjust their portfolio and trading positions, rather than trades involving the physical securities.
An increase in the proportion of Treasury bonds held by passive (or, ‘buy and hold’) investors, such as foreign reserve asset managers and institutional investors, may also have contributed to the decline in secondary market turnover (AOFM 2007-08). Finally, an increasing proportion of Treasury bonds are being held by domestic banks as they seek to enhance the quality of their liquid asset holdings ahead of the new Basel III liquidity rules.
Chart 1: The markets for nominal and indexed Treasury bonds(a)
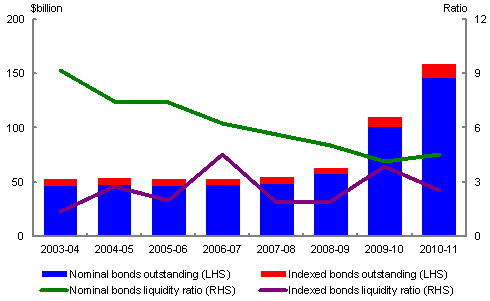
(a) The liquidity ratio is the ratio of annual turnover to total outstandings, where outstandings are an average of monthly data on CGS published by the AOFM.
Source: AOFM, Australian Financial Markets Association and Treasury.
The limited number of indexed bond lines on issue also means that, since break-even rates must be calculated using bonds on a comparable tenor basis, interpolation is usually necessary to fill in points on the real yield curve.5 Moreover, since Treasury indexed bond lines have typically been issued with maturities spaced every five years, a reliable time series of break-even rates can only be calculated at tenors of five years or more.
These caveats notwithstanding, the five-year bond break-even rate — which shows expectations for average annual inflation over the next five years, abstracting from the influence of any risk premia — is currently in the lower half of the Reserve Bank of Australia’s (RBA) target band (Chart 2).6 At the longer 10-year horizon, expectations are currently around the mid-point of the target band.
Chart 2: Bond market break-even inflation rates(b)
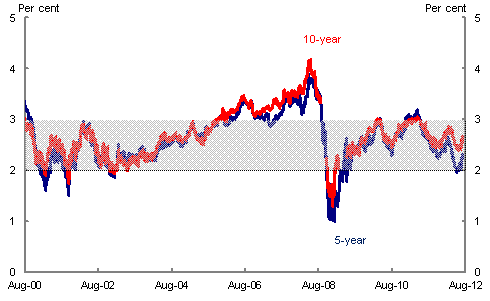
(b) There are two breaks in the 10-year break-even series — between September and November 2008, and February and June 2009 — owing to a lack of reliable pricing data for the 10-year indexed bond during those periods.
Source: Bloomberg and Treasury.
It is difficult to be precise about the relative magnitudes of the competing biases on bond break-even rates — there are likely to be periods when the positive inflation risk bias dominates and other periods when the negative liquidity risk bias dominates.7 Nevertheless, over relatively short periods, an assumption of constant inflation risk and liquidity premia is likely to be a reasonable one such that, while the relative magnitude of these competing biases at any one time may distort the implied level of expected inflation, short-term changes in break-even rates should represent changes in actual market inflation expectations reasonably well.
Over longer periods of time, however, both of these biases are likely to exhibit some variability. While relative liquidity conditions between the indexed and nominal bond markets may be reasonably stable during normal times, the relative liquidity premium incorporated in real bond yields can become more elevated during periods of heightened risk aversion (when investors show a strong preference for more liquid assets). Inflation risk premia, on the other hand, are likely to rise and fall with, for instance, unexpected volatility in realised inflation outcomes, announced government policy changes, volatility in world oil prices and a range of other influences.
Inflation swap rates
Inflation swap rates provide an alternative to bond market-derived measures of market expectations for inflation. An inflation swap is a bilateral agreement that requires one party (the ‘inflation payer’) to pay realised cumulative inflation over the period of the swap in return for receiving a fixed interest rate (the inflation swap rate) from a second party (the ‘inflation receiver’) (see Box 2).
As a measure of market inflation expectations, inflation swap rates (also called inflation swap ‘break-evens’) offer some advantages over bond market break-evens. They are available over a much wider range of tenors — quoted rates are available from one–year out to 30 years — and, thus, are able to provide a read on both short and long-horizon inflation expectations. As a primary (or, dealers) market, where contracts can be created as required, inflation swap rates are not subject to the kind of liquidity premia that can affect bond market break-evens. While inflation swap rates may incorporate some premium for counterparty risk, this is likely to be negligible since contracts are negotiated with reference to notional amounts (that is, there is no exchange of principal) and make use of standard agreements that provide some legal protection in the event of counterparty default (Hurd and Relleen 2006).
However, despite their advantages, inflation swaps are also unlikely to give a perfectly clean measure of market inflation expectations. As with bond market break-evens, inflation swap rates likely incorporate some premia for inflation risk — compensation demanded by the inflation payer for potential volatility in realised inflation over the term of the swap. Moreover, while inflation swaps are more liquid than Treasury indexed bonds in the sense that they can be created as required, the tailoring of contracts and their bilateral nature makes inflation swaps less liquid ‘on the way out’ — since the holder of an inflation swap who wished to exit the contract early would have to renegotiate terms with the original issuer, who may or may not be willing to do so. Compensation for this risk may bias inflation swap rates away from the market’s true expected inflation rate.
Further, regulatory changes enacted in recent years have meant that banks dealing in the inflation swaps market are required to set aside significantly more capital against any derivatives exposures. Compensation demanded by banks for these higher capital charges may also have introduced a systematic bias into inflation swap rates.
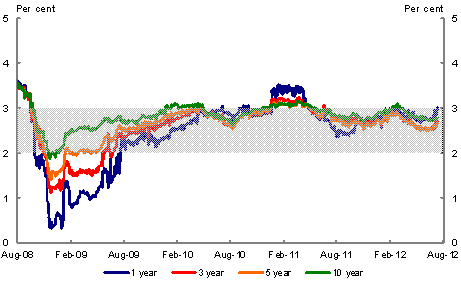
Chart 3 below shows the three, five and ten-year swap rates are currently in the top half of the target band.
Chart 3: Inflation swap rates
Source: Bloomberg.
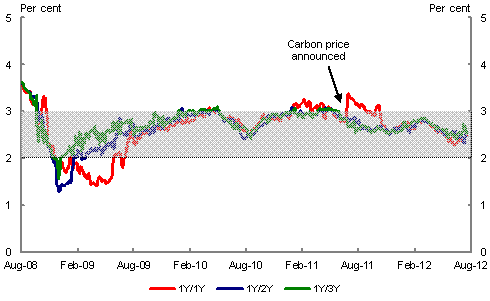
Since quoted rates are available at yearly intervals from 1 year out to 10 years, we can decompose inflation swap rates into a series of shorter spot and implied forward rates.8 A useful application of forward rates is to isolate the expected price impacts of announced policy changes that are due to take effect at some point in the future. In July 2011, the Government announced the introduction of a $23 a tonne carbon price beginning on 1 July 2012. At the time of the announcement the Government released the results of Treasury modelling which estimated the policy would result in a one-off rise in headline CPI of 0.7 per cent in the September quarter 2012.9
Box 2: The inflation swaps market
Whi
le a variety of inflation swaps are transacted in Australia, the most common is the zero-coupon inflation swap. This has the most basic structure, with payments exchanged only on maturity (Figure 1). Zero-coupon swaps have become the standard for which rates are quoted by brokers of these products (generally the major Australian banks and international banks dealing in the Australian swaps market).
Figure 1: Indicative cash flows of a zero-coupon inflation swap contract

Where the fixed rate is quoted as an effective percentage rate per annum and T is the number of years between the start and end dates.
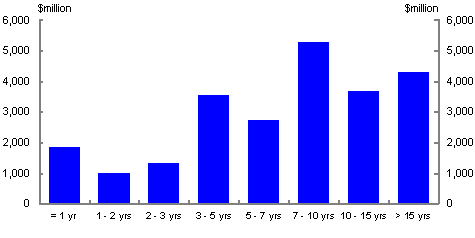
The inflation swap market is transacted over-the-counter, rather than via an organised exchange, so comprehensive data on market activity are not readily available. However, according to a survey by the Australian Financial Markets Association (AFMA) there were $23.7 billion of inflation swaps outstanding as at May 2011 — the majority of which were for terms of three years or more — with annual turnover (to end-June 2011) of $12.2 billion (Chart 4) (AFMA 2011).
Chart 4: Inflation swaps outstanding by tenor
As at May 2011
Source: AFMA.
AFMA only began collecting survey data on the inflation swaps market in 2010-11, but by all indications the market has expanded quite rapidly over the past decade. For instance, in August 2001 the Reserve Bank of Australia (RBA) estimated there were only around $500 million in inflation swaps outstanding (RBA 2001).
Activity in the inflation swaps market surrounding the announcement suggests these estimates were viewed as credible, with the implied one-year ahead forward rate rising by between 0.6 and 0.7 per cent upon the announcement (Chart 5). This level jump was maintained until end-October 2011 (since, following the release of the September quarter 2012 CPI in late October 2012, the impact of the introduction of the carbon price on the CPI is expected to have largely passed).
Currently, the one, two, and three-year ahead forward rates — which reflect expectations over time windows in which the introduction of the carbon price is not expected to have a material price impact — are currently around the mid-point of the target band (Chart 5).
Chart 5: Implied forward swap rates 5-day moving averages
Source: Bloomberg and Treasury.
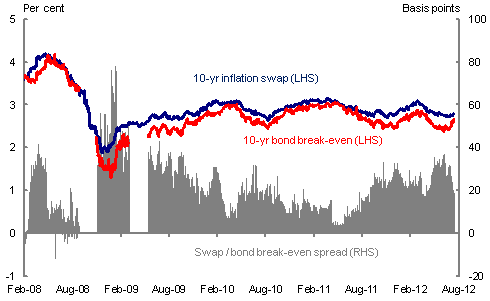
In summary, measures of inflation expectations taken from both the Treasury bond and inflation swaps markets are subject to a range of potential biases, the relative magnitudes of which will vary over time. As a consequence, inflation expectations implied by these two measures can diverge. While inflation swap rates generally move closely in line with bond market break-evens, they have typically been around 20 basis points higher at the 10-year tenor (Chart 6).
Chart 6: Bond market break-evens vs inflation swaps
Source: Bloomberg and Treasury.
Of course, in a world of perfect markets, arbitrage should ensure that the inflation compensation implied by the difference between nominal and indexed bond yields be equal to that implied by inflation swap rates.10 At a broad level, the reason for the observed divergence is that there may be specific factors that inhibit participants from fully arbitraging away any differences between the two markets.
On the one hand, the limited range of maturities available in the indexed bond market means it is difficult to fully replicate the inflation exposure in a given swaps position with simultaneous trades in the indexed and nominal bond markets. Further, one of the counterparties to an inflation swap will usually be a swaps dealer, who may seek to hedge their inflation exposure with parallel trades in the indexed bond market. Because a cash position in the indexed bond market necessarily entails a capital cost, and because indexed bonds are relatively illiquid, the swaps dealer may demand additional compensation for the cost and potential difficulties involved in hedging this risk. This, in turn, may drive a wedge between inflation swap rates and bond break-evens.
Conclusion
This article has examined two market-based measures of inflation expectations. The inflation compensation implied by the difference between the yields on nominal and indexed Treasury bonds — which can also incorporate time-varying premia for inflation and liquidity risk — suggest medium to long-term expectations are currently well contained within the RBA’s target band. Inflation swap rates, which can be subject to their own biases, point to expectations being within the top half of the target band.
Given the limited number of indexed bonds on issue in Australia, one clear advantage of inflation swap rates as a measure of inflation expectations is their ability to be easily decomposed into implied forward rates. A useful application of forward rates is to gauge the expected price impact of impending policy changes. For instance, forward inflation swap rates suggest the market concurs with Treasury estimates that the introduction of the carbon price will result in a modest, one-off increase in headline CPI of around 0.7 per cent in 2012-13.
References
AFMA (Australian Financial Markets Association) 2011, ‘2011 Australian Financial Markets Report’.
AOFM (Australian Office of Financial Management) 2007-08, ‘AOFM Annual Report 2007-08’.
Commonwealth of Australia 2011, Strong growth, low pollution: modelling a carbon price, The Treasury, Canberra, July.
Finlay, R. and Wende, S. 2011, ‘Estimating inflation expectations with a limited number of inflation-indexed bonds’, Research Discussion Paper, Reserve Bank of Australia, March.
Hurd, M. and Relleen, J. 2006, New information from inflation swaps and index-linked bonds, Quarterly Bulletin, Bank of England, Spring, p29.
Pepper, H. and Cassino E. 2011, ‘Making sense of international interest rate movements’, Bulletin, Reserve Bank of New Zealand, Vol. 74, No. 1, March.
RBA (Reserve Bank of Australia) 2001, ‘Box C: Inflation-indexed bonds and swaps’, Bulletin, August.
1 The authors are from Macroeconomic Policy Division, the Australian Treasury. This article has benefited from comments and suggestions provided by David Gruen, David Drage, Michael Bath (AOFM), James Kelly and Shane Johnson. The views in this article are those of the authors and not necessarily those of the Australian Treasury.
2 Note, compensation for default risk on Australian government debt is assumed to be negligible. Australia is currently one of only seven sovereigns globally to hold a AAA rating with a stable outlook from all three of the major credit rating agencies.
3 It is termed the ‘break-even’ ra
te since if future inflation turned out to be equal to this rate then the realised real return from holding a nominal bond and an indexed bond would be exactly the same.
4 The Commonwealth also issues Treasury Notes, which are a short-term debt security issued to assist with the Australian Government's within-year financing task.
5 We use the linear interpolation method, where the real yield at any given point in time, ![]() , is given by a weighted average of the yields on the two indexed bonds with maturity dates closest to the target maturity date:
, is given by a weighted average of the yields on the two indexed bonds with maturity dates closest to the target maturity date:
![]()
![]()
where ![]() is the number of days until maturity of the indexed bond that matures before the target maturity date,
is the number of days until maturity of the indexed bond that matures before the target maturity date, ![]() , and
, and ![]() is the number of days until maturity of the indexed bond that matures after the target maturity date. The weights are calculated based on the relative proximity (in days) to the target maturity date:
is the number of days until maturity of the indexed bond that matures after the target maturity date. The weights are calculated based on the relative proximity (in days) to the target maturity date:
![]()
6 Bond market break-evens should technically be adjusted to account for different compounding frequencies between (nominal) Treasury bonds (which pay semi-annual coupons) and indexed bonds (which pay quarterly coupons). In practice, however, this does not materially affect estimates of expected inflation taken from bond market break-evens.
7 Finlay and Wende (2011), for example, estimate extended periods of both positive and negative inflation risk premia, where they attribute episodes of negative inflation risk premia to the influence of liquidity premia (the two are not modelled separately).
8 The implied one-year forward swap rate, and any subsequent forwards, are calculated as:
![]()
Where ![]() is the forward rate over the period l - s and
is the forward rate over the period l - s and ![]() is the swap rate for a particular maturity,
is the swap rate for a particular maturity, ![]() , and
, and
![]() is the swap rate for a shorter maturity,
is the swap rate for a shorter maturity, ![]() (Pepper and Cassino 2011).
(Pepper and Cassino 2011).
9 A smaller step up in headline CPI, of 0.2 per cent, was expected to occur in 2015-16, when the scheme moves to the international carbon price (Commonwealth of Australia 2011).
10 Since the payoffs involved in entering an inflation swap can be replicated using nominal and inflation-indexed bonds, and two portfolios with identical future payoffs should, under the assumption of perfect markets, have the same price via arbitrage (Hurd and Relleen 2006).