Owen Freestone, Danial Gaudry, Anthony Obeyesekere and Matthew Sedgwick1
This paper looks at the increase in saving and the more subdued borrowing by households in recent years, exploring how this has been reflected in the household sector's financial transactions and balance sheet. The paper outlines a number of possible reasons for the turnaround and discusses the implications for the Australian economy, including the current account balance, bank funding, households' sensitivity to shocks and interest rates.
Introduction
Households have been saving a significantly larger proportion of their disposable incomes in recent years than in the previous two decades. This turnaround in saving has been accompanied by a moderation in the household sector's borrowing behaviour, which has seen the household sector's gearing ratio stabilise after two decades of increases.
These changes seemed to intensify following the onset of the global financial crisis (GFC), with households reducing their accumulation of debt and re-allocating their savings towards lower risk assets such as deposits.
These developments have a range of implications for the Australian economy.
Higher household saving — and lower household spending — in the context of Australia's mining boom means that record levels of business investment can be accommodated with less reliance on overseas sources of funds than would otherwise be the case. By reducing aggregate demand, higher rates of saving and lower household spending may also reduce pressure on prices and wages and therefore interest rates, while more moderate rates of gearing will reduce households' exposure to negative economic shocks.
The recent turnaround in household saving and borrowing
The household saving rate in Australia declined steadily from the mid-1970s to the mid-2000s, falling below zero for the first time on record in the early 2000s (Chart 1).2 Declining household saving over this period was accompanied by a related decline in household net lending, as strong growth in net borrowing (new borrowing less repayments) more than offset growth in net financial asset purchases (also Chart 1).3
Chart 1: Household saving and net lending(a)
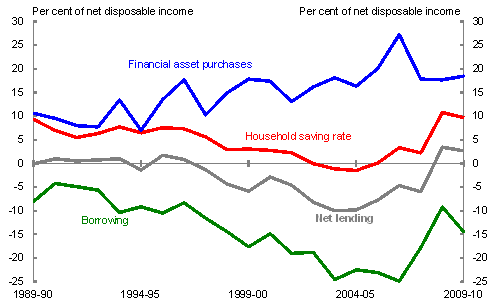
(a) Household borrowing is inverted.
Source: ABS cat. no. 5204.0 and 5232.0.
Household net lending has recovered in recent years, in line with household saving, underpinned by a moderation in net borrowing and broadly stable net asset purchases as a share of household disposable income (abstracting from the one-off effect of superannuation policy changes).4
While broadly stable in aggregate, there was a significant change in the composition of asset purchases during the crisis. Households shifted towards deposits and divested themselves of riskier assets such as shares (Chart 2, Panel A). The increase in deposits reflected a number of factors. On the supply side, a probable increase in households' risk aversion has seen a preference shift in favour of less risky assets, with higher interest rates on deposits supporting greater supply (Chart 2, Panel B). On the demand side, banks and other deposit-taking institutions shifted their funding base towards domestic deposits as credit availability in international capital markets tightened, and have continued to rely more heavily on deposits even as conditions have improved.
Chart 2: Shift towards safer assets
Panel A: Annual net asset purchases
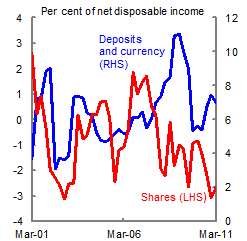
Panel B: Wisest place for savings
Source: ABS cat. no. 5232.0; Westpac-Melbourne Institute Survey of Consumer Sentiment.
On the borrowing side, the moderation has reflected a tightening in lending standards (which has, for example, resulted in a fall in the share of housing loans with loan-to-value ratios greater than 90 per cent since the crisis) and a moderation in household demand for credit, which is discussed further below.
More subdued borrowing has resulted in the stock of household debt, both personal and housing, growing at much lower rates than in the previous decade (Chart 3, Panel A). This has seen a stabilisation in key measures of household indebtedness in recent years, following two decades of increases (Chart 3, Panel B).
Chart 3: Household debt
Panel A: Stock of household
debt (growth)
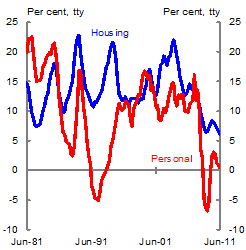
Panel B: Measures of household indebtedness5
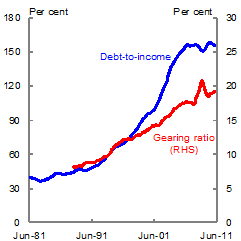
Source: RBA.
The significant rise in household saving rates and more cautious approach to borrowing likely reflects a combination of factors.6
The sharp rise in household saving in 2008-09 was underpinned by a significant fall in consumption, as Australian households responded to the adverse effects of the GFC on wealth, with similar responses seen internationally (Chart 4).7 In Australia, the GFC resulted in household assets declining around $500 billion by early 2009, with higher saving in 2008-09 helping to offset some of this decline.
The rise in the household saving rate in 2008-09 was underpinned by a temporary boost to the growth in household income, with a significant contribution from the cash transfers paid to households as part of the Government's fiscal stimulus. Treasury's estimate of the economic impact of the fiscal stimulus assumed that part of the cash payments to households would be saved.8 While the initial increase in the household saving rate is consistent with this analysis, the ongoing elevated rates of saving over the past two years suggest a more fundamental change in household behaviour. These issues are discussed further in Morling and McDonald (2011).
Chart 4: International comparison of net worth and saving
Panel A: Household net worth(a)
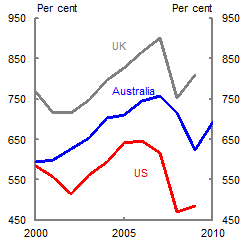
(a) International data are in calendar years while Australian data are in financial years. Net worth is expressed as a per cent of disposable income.
Panel B: Household saving(b)
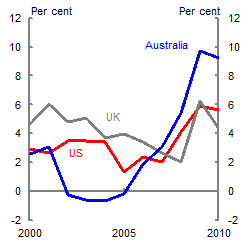
(b) All data are expressed in calendar years. Saving is expressed as a per cent of disposable income. UK saving is gross, others are net saving.
Source: ABS cat. no. 5204.0 and OECD Economic Outlook.
Higher saving rates, a shift towards safer assets and more moderate growth in debt in recent years could also reflect heightened caution among Australian households following the GFC. The damage inflicted on other advanced economies, and the ongoing economic uncertainty, may have highlighted the risks associated with high rates of private sector gearing.
Alternatively, the shift in saving and borrowing in recent years may simply reflect households returning to more normal patterns of behaviour.9 The low saving rates and high levels of borrowing during the 1990s and early 2000s may have reflected households transitioning to a desired level of debt consistent with the new structure of the economy brought about by the reforms of the 1980s and 1990s, including financial market deregulation and inflation targeting.10 Among other things, these reforms resulted in strong capital gains in household assets (or increases in expected future incomes), allowing households to enjoy rising asset values and wealth, even with low rates of saving (Chart 5).
Chart 5: Net saving plus capital gains and losses
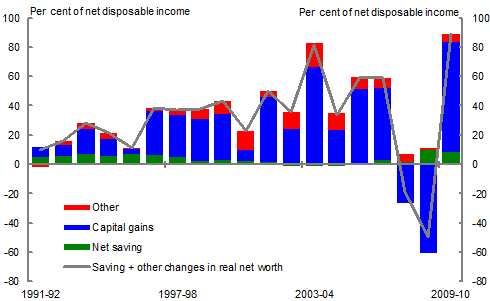
Source: ABS cat. no. 5204.0.
Given that these persistently strong capital gains are unlikely to be repeated in the near future, it also seems unlikely that households will revert to the very low saving rates seen in the first half of the 2000s.11 The latest national accounts and household credit data indicate that households continue to behave more cautiously with their spending and borrowing, with the household saving rate remaining elevated.
That said, it is likely that household sentiment will improve over time, as households begin to feel more secure and the effects of the GFC fade, which may lead to a strengthening in consumption growth and a modest decline in the household saving rate.
Implications of higher household saving for the economy
Higher household saving in recent years has already been reflected in the broader macro-economy, including Australia's current account, banking sector funding arrangements and household sector indebtedness. The prospect of sustained higher household saving rates has a range of important implications for the Australian economy.12
The current account deficit
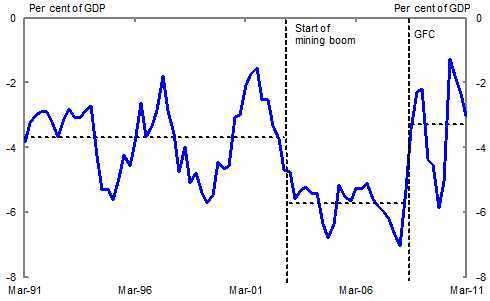
Australia has persistently run a current account deficit (CAD). This reflects high levels of investment that have consistently exceeded national saving, even though Australia's saving rate has been around the OECD average.
The increase in household saving has reduced the impact of the mining boom on the CAD. Large increases in commodity prices, which have pushed the terms of trade to their highest sustained levels in 140 years, have increased profits in the resources sector and led to a surge in mining-related investment. As a result, national investment since the start of the mining boom in 2003 has averaged around 28 per cent of GDP, 3 percentage points higher than its average over the preceding decade.
As the CAD is the difference between a country's gross investment and gross saving, this large increase in investment would have resulted in an increase in the CAD in the absence of a matching increase in saving. Indeed, this is what happened in the initial phase of the mining boom (Chart 6).
Chart 6: Current account balance(a)
(a) Horizontal dotted lines are averages over the relevant periods.
Source: ABS cat. no. 5206.0.
However, since the GFC Australia's CAD has averaged 3.3 per cent of GDP, which is lower than the pre-mining boom average of 3.7 per cent of GDP, and significantly lower than the average during the mining boom prior to the GFC of 5.7 per cent of GDP.
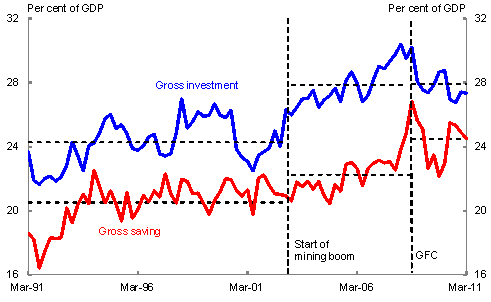
The narrowing of the CAD has occurred despite a high level of investment, which has fluctuated around its pre-GFC mining boom average of 27.9 per cent, well above its pre-mining boom average of 24.3 per cent (Chart 7). The narrowing has been driven by a large increase in gross saving between these periods, which has increased from 22.2 per cent of GDP to 24.5 per cent of GDP.
Chart 7: Gross investment and gross saving(a)
(a) Horizontal dotted lines are averages over the relevant periods.
Source: ABS cat. no. 5206.0.
Data from the annual national accounts provide a breakdown of national saving by sector, although the latest available data are for 2009-10 (Chart 8). These data show that higher household saving in 2008-09 and 2009-10 made an important contribution to national saving following the GFC. Saving by corporates as a share of GDP also increased in 2008-09, albeit much more modestly, before declining a little in 2009-10, while government saving fell as a result of automatic stabilisers and fiscal stimulus.
Chart 8: Net saving by sector
Source: ABS cat. no. 5204.0.
Looking to the future, the 2011-12 Budget forecasts that the current account balance will widen to 5¼ per cent in 2012-13 driven by the expected further increase in investment from the mining boom. While national saving should also remain high, supported by the Government's fiscal consolidation and household saving, it is not expected to rise to match the increases in investment. In the absence of the higher household saving rate, however, the surge in investment would result in a wider CAD.
Bank funding
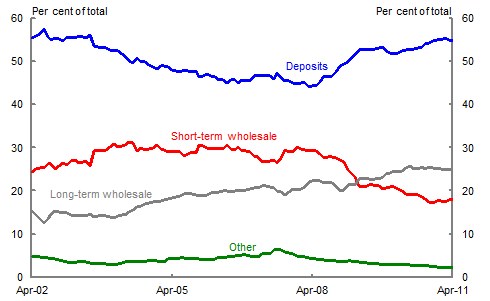
The rise in the household saving rate and the associated increase in deposits have helped the Australian banking sector move towards a more reliable funding pattern.
The problems that may arise as a result of an over-reliance on short-term wholesale funding were highlighted during the GFC when international and domestic funding markets tightened and banks encountered difficulties when attempting to roll over their short-term debt. As a result of this experience, banks have recently moved away from short-term wholesale funding towards long-term wholesale funding and deposits (Chart 9). This shift has been accompanied by a moderation in household borrowing, which has meant that banks' overall funding needs have been growing at a much slower rate than in the pre-GFC period.
Chart 9: Sources of bank funding
Source: RBA and Australian Prudential Regulation Authority.
Thus, increased household saving, particularly in the form of increased deposits, has helped to increase the resilience of the Australian banking system to disruptions in short-term wholesale funding markets.
Resilience to shocks
As previously shown, the higher saving rate ha
s been associated with slower growth in household debt and a stabilisation in the debt-to-income ratio (Chart 3). This has a range of important implications for the macro-economy.
Where households are highly geared, they are more vulnerable to adverse changes in their circumstances, such as job losses or reduced wages.13 On the other hand, higher savings provides households with more of a buffer to draw on if needed and, similarly, lower levels of debt are easier to service when finances becomes stressed.
High debt levels also result in greater sensitivity to interest rate changes. In Australia, housing debt accounts for 90 per cent of total household debt, the majority of which is tied to variable interest rates. This means that interest rate increases transmit quickly to households, increasing debt servicing costs and thus reducing the amount of disposable income available for consumption. It should be noted that household sensitivity to interest rates is well understood by the Reserve Bank of Australia (RBA) and considered when setting interest rates.14
While the stabilisation of household indebtedness may not last, it is important to consider the impact it has on household financial vulnerability. While debt stabilisation does not reduce vulnerability to the shocks discussed above, it has meant that vulnerability has not continued to rise over recent years.
Household indebtedness
The increase in household saving in recent years has been primarily reflected in a reduction in net borrowing (new loans less repayments on existing loans).15 It is useful to consider the relationship between the flow of net borrowing and the stock of debt as a share of household gross disposable income (GDI) in order to assess whether current flows are consistent with a continued stable debt-to-income ratio. In a simple framework, household debt evolves according to the following equation:

where r is the interest rate on household debt. Higher household saving can enter through either increased principal payments or reduced new borrowing, resulting in lower household debt accumulation, all else being equal.
After dividing through by GDI and rearranging, the change in the debt-to-income ratio is given by:

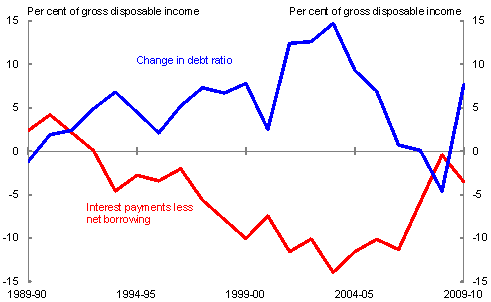
where g is the annual growth rate of GDI. Thus, when the interest rate exceeds growth in GDI (which is normally the case), interest payments must exceed net borrowing in order to stabilise the debt-to-income ratio. For example, consider the case where the difference between r and g is 1½ to 2 percentage points (that is, the average gap since lower inflation was established in the early 1990s). Then, households' interest and principal payments would need to exceed new borrowing by 2 to 3 per cent of gross disposable income each year to stabilise the debt-to-income ratio at around its current level of 155 per cent.
Chart 10 shows that household interest payments less net borrowing has been negative since the early 1990s, although it has approached a balanced position in recent years supported by a considerable moderation in net borrowing. This, together with interest rates being below the rate of income growth, saw a stabilisation in the debt-to-income ratio between 2006-07 and 2009-10.
Chart 10: Net borrowing, interest payments and the debt-to-income ratio
Source: RBA and Treasury.
However, as is it unusual for interest rates to remain below growth in GDI for extended periods, it is likely that some further adjustment in net borrowing will be needed to see a sustained stabilisation in the debt-to-income ratio. Such an adjustment would likely require a higher saving rate.16 That said, given the substantial adjustment in household borrowing that has occurred in recent years, the further adjustment needed to stabilise the debt-to-income ratio is not overly large, and could occur over a number of years.
Easing pressure on interest rates and the exchange rate
The rise in the household saving rate means that consumption is lower than it would otherwise be.
To illustrate the macroeconomic impact of this shift in consumption behaviour, it may be useful to consider a counterfactual scenario in which behaviour had not changed. Had the household saving rate remained at its 2004-05 level, and assuming disposable income was unaffected, consumption would have been 11 per cent higher than its current level (equivalent to around 6 per cent of GDP).
Higher consumption in this counterfactual scenario would not have translated into significantly higher GDP growth as the economy is now close to full capacity and was evidently operating above full capacity in the period prior to the GFC. The primary effect of the turnaround in household saving has therefore been to reduce the extent to which interest rates and the exchange rate have needed to rise to maintain macroeconomic balance.
In the context of Australia's mining boom, the rise in household saving, along with the improvement in the government's fiscal position, should be seen as a net positive, as it is providing room for rising investment in the resources sector, helping to moderate price and wage pressures, and alleviating upward pressure on interest rates. However, subdued household spending will present challenges to other sectors of the economy, including the retail and the residential construction sectors.
If the household saving rate stabilises around its current level, consumption will resume growing in line with incomes. In this case, the dampening effect on demand growth would be less than it has been over recent years when the saving rate was rising. Nonetheless, the level of household demand would be lower than if household saving had remained at the low rates seen throughout much of the 2000s.
Conclusion
The 1990s and 2000s saw major changes in the structure of the household sector's balance sheet. Fuelled by a number of structural reforms in the 1980s and 1990s, household indebtedness and gearing rose to unprecedented levels. Over the same period, household saving fell while real net worth rose, primarily as a result of large capital gains.
The saving rate has increased and household indebtedness has broadly stabilised since the mid-2000s, possibly as a result of households reaching their desired levels of gearing after a protracted period of adjustment.
Following the GFC, households increased their saving sharply and shifted from riskier assets such as shares, to safer assets such as deposits.
On the whole, this change in behaviour has assisted macroeconomic management. In particular, without the higher household saving, the CAD would be wider, the banking system's dependence on short-term wholesale funding markets would be greater and there would have been additional upward pressure on interest rates and exchange rates. Increased household saving and debt stabilisation have also reduced households' vulnerability to adverse economic shocks, which has helped to limit macroeconomic vulnerability.
Appendix 1: Key concepts and definitions
Households
- The Australian Bureau of Statistics (ABS) definition of the household sector includes persons, unincorporated businesses and non-profit institutions serving households.17 The RBA definition of the household sector excludes unincorporated e
nterprises.
Measures of household saving
- Household saving is not measured directly by the ABS. Instead, gross saving is calculated by deducting household final consumption expenditure from gross disposable income. This indirect measurement and the inaccuracies associated with measuring consumption means that saving data are subject to large revisions and should be interpreted with caution.
- The net saving ratio is calculated using the following formula:

- While net saving provides a conceptually more accurate picture of saving, it is dependent upon the method used to calculate depreciation. International variation in the measurement of depreciation results in net saving not being directly comparable across countries. In some cases, it may be better to compare gross saving.
- The national accounts measure of household saving does not take into account capital gains and losses, as these are not considered part of household disposable income. A broader measure of income — and therefore saving — can be constructed based on the idea that income is the maximum amount that a household can consume without reducing its real net worth. To this end, the ABS publishes an 'analytical measure of household saving', which applies this broader definition, incorporating real capital gains (and losses) in addition to conventional net saving from current income.
Net lending
- Household net lending can be measured in two ways. In the capital account, net lending is gross saving less gross investment. Thus, the household sector is a net lender when it provides funds to other sectors of the economy. Alternatively, in the financial account, net lending is the difference between the household sector's net acquisition of assets and its net incurrences of liabilities (or debt) in a given period. Net lending in the financial account is known also as the change in financial position. Conceptually, the capital and financial account measures of net lending should be equal. However, in practice they differ because of errors and omissions associated with their having different data sources.
Financial account
- The financial account records transactions that involve financial assets and liabilities that take place between the different sectors of the Australian economy (for instance, between households and financial corporations) as well as between the sectors of the domestic economy and the rest of the world.
The balance sheet and net worth
- The household sector balance sheet records the end of period value of assets and liabilities. Household net worth (or net wealth) is the excess of household assets over liabilities. The ABS measure of household net worth includes dwelling assets, the capital stock held by unincorporated enterprises, financial assets and financial liabilities.
Links between the balance sheet and flow accounts
- Changes in the values of assets and liabilities between periods can be decomposed into changes stemming from valuation (or price) movements and changes stemming from transaction flows.
- The income, financial and capital (or flow) accounts are linked to each other and the balance sheet through saving and investment flows. When households have income leftover after spending on consumption, fixed assets and depreciation, the resultant saving is reflected in a net acquisition of financial assets or a net reduction in financial debt, or some combination of both:

References
Cropp, J and Thorne, S 2008, 'Household Saving in Australia', Treasury Economic Roundup, Issue 4.
Gruen, D 2009, 'The Return of Fiscal Policy', address to the Australian Business Economists Annual Forecasting Conference, 8 December 2009.
Morling, S and McDonald, T 2011, 'The Australian Economy and the Global Downturn – Part 2: The key quarters', Treasury Economic Roundup, Current Issue.
OECD 2006, 'Economic Outlook 80', December 2006.
Reserve Bank of Australia 2011, 'Financial Stability Review', March edition.
Stevens, G 2010, 'Opening Statement to House of Representatives Standing Committee on Economics', 19 February 2010.
Treasury 1999, 'The Measurement of Saving in Australia', Treasury Economic Roundup, Spring edition.
Treasury 2001, 'The Household Balance Sheet in Australia', Treasury Economic Roundup, Spring edition.
1 The authors are from the Macroeconomic Policy and Domestic Economy Divisions of the Australian Treasury. This article has benefited from comments and suggestions provided by Simon Duggan, Phil Garton, David Gruen, James Kelly, Tony McDonald and Steve Morling. Assistance was provided by Janelle Hanns, Bonnie Li and Alistair Peat. The views in this article are those of the authors and not necessarily those of the Australian Treasury.
2 Decreasing household saving during the 1990s also reflected a trend of corporatisation, with a re-allocation of saving from households to corporations (Treasury 1999).
3 Net lending in the financial account (or the household sector’s change in financial position) equals net financial asset purchases less net borrowing. It is conceptually equivalent to net lending in the capital account, but differs in practice due to errors and omissions. Net investment in fixed assets – which is the difference between net lending and net saving – remained broadly stable as a share of household income over this period. Appendix 1 sets out the key national accounting and related definitions for the household sector.
4 The spike in financial asset purchases in 2006-07 is likely to have been influenced by legislative changes that provided incentives to make voluntary superannuation contributions before 1 July 2007.
5 The gearing ratio is the value of household debt as a percentage of assets.
6 See Cropp and Thorne 2008 for a related discussion of higher household saving.
7 While household wealth fell significantly in Australia, household income growth was relatively strong in 2008-09. This may partly explain the somewhat larger rise in household saving in Australia.
8 The estimates assumed that 70 per cent of the cash transfers would be spent over the horizon of the 2009-10 Budget forecasts (Gruen 2009).
9 A related explanation is that the decline in household saving and its subsequent rebound are a reflection of measurement issues, particularly the exclusion of capital gains from household income (Treasury 1999).
10 These earlier trends were driven by a range of economic reforms and related changes that occurred primarily throughout the 1980s and 1990s, with similar trends occurring in many advanced economies (OECD 2006).
11 The equilibrium price of an asset should reflect the present value of the future income stream from the asset. This implies that asset prices on average cannot grow faster than GDP indefinitely. While past asset price growth may be justified by financial deregulation and the reduction in interest rates as low inflation was re-established, these are one–off shifts that cannot be repeated in future.
12 The 2011-12 Budget forecasts the household saving rate to average 9 per cent over the forecast period.
13 That said, most household debt is held by higher income households that are generally better able to deal with adverse economic shocks. HILDA data show that in 2006 the top two income quintiles held around 80 per cent of total household debt while the bottom quintile held just 3 per cent.
14 See Stevens 2010.
15 Saving equals net investment in fixed assets plus net purchases of financial assets less net borrowing (new borrowing less principal payments). Therefore, higher saving can be reflected in increased net investment, increased net asset purchases, decreased net borrowing, or some combination of these.
16 This would need to be in addition to the expected increases in saving from the planned increases in the superannuation guarantee rate, which will lead to an increase in asset purchases, rather than a reduction in net borrowing.
17 See Treasury 1999 for a discussion on the impact of corporatisation on the national accounts measure of household saving.