Dr Martin Parkinson, PSM1
Secretary, Australian Treasury
Dr Parkinson's first speech as secretary was the annual post-Budget address delivered to the conference of Australian Business Economists at the Westin Hotel, delivered on 17 May 2011 in Sydney.
Dr Parkinson commenced as Treasury Secretary in March 2011. He previously served as Secretary of the Department of Climate Change and Energy Efficiency, after serving as Deputy Secretary in the Department of Prime Minister and Cabinet and the Treasury. Since beginning his career at the Treasury in 1980, he has worked in a range of areas including taxation policy, labour market and structural reform, and macroeconomic policy and forecasting. He has also worked at the International Monetary Fund, and in the early 1990s served as Senior Adviser to Treasurer Dawkins. Dr Parkinson holds a Ph.D from Princeton University, a M.Ec from the Australian National University and a B.Ec (Hons) from the University of Adelaide.
Introduction
Thank you for the invitation to address you today. I think it was Ted Evans, who first started the tradition of the Secretary to the Treasury speaking to the Australian Business Economists in a post Budget address - and it is a tradition I am happy to continue.
Today I would like to discuss some of the challenges confronted in framing the Budget released last week, a Budget heavily influenced by the fact that Australia is an economy in transition. In particular, I will address three issues that have shaped the pre- and post-Budget debate:
- that the Budget should have delivered faster fiscal consolidation, based on a particular view of the structural budget position;
- the influence of China, and other emerging economies, on Australia's future prospects; and
- the importance of participation and productivity in smoothing the transition we confront.
But before I get into that, let me provide a little context. As is evident, Australia has emerged from the global financial crisis (GFC) with low unemployment, solid economic growth, a stable and profitable financial system, and low levels of government debt - this is unique among the major advanced economies.
Moreover, the medium-term outlook for the Australian economy is strong.
The GFC resulted in the deepest global recession in 75 years. Australian financial conditions were stressed, but our financial system remained resilient. The economy slowed, but we avoided the sustained rise in unemployment that destroys human capital and opportunity, and condemns people to long-run poverty. Indeed, while the world as a whole lost around 30 million jobs, Australia created over 700,000.
The Australian economy dodged a bullet and we did so because of 25 years of hard, and not necessarily popular, economic reform, combined with rapid, fast-acting stimulus provided during the crisis.
Australian governments from the mid-1980s onwards recognised the need to transform our economy. They prosecuted the case for microeconomic and structural policy reforms that were crucial in increasing the economy's capacity to ride out a severe external shock. They put in place robust monetary policy frameworks. And they demonstrated the resolve needed to bring deficit budgets back into surplus, and committed themselves to increasingly well-articulated medium-term frameworks for fiscal policy.
We continue to get the payoffs from these reforms today.
But these reforms alone would not have saved us from more severe impacts of the GFC. These sound policy frameworks had to be supplemented by rapid and effective countercyclical policies which, in the case of fiscal policy, we estimate avoided the loss of around 200,000 jobs during the GFC.
Sensible, forward looking qualities have served us well for 25 years.
And while it is now time to bring the Budget back to surplus, that also needs to be done in a sensible, forward looking, fashion.
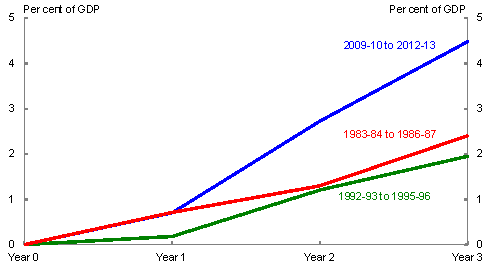
As the Budget indicates, the proposed fiscal consolidation between 2010-11 and 2012-13 amounts to almost 4 per cent of GDP - the fastest consolidation in the 40 plus years for which comparable data is available (Chart 1).
Chart 1: Australian fiscal consolidations
Source: Treasury.
And this is occurring against the backdrop of a patchy growth performance across different regions and different sectors of our economy, and a number of ongoing risks relating to global economic and financial fragility.
Sovereign debt problems continue in Europe. Market concerns over the sustainability of the debt burden remain, with the potential for contagion to the European banking sector being especially problematic.
At the same time uncertainty remains around the ultimate form of fiscal consolidation in the United States and, hence, of that economy's long-term growth prospects.
Failure to effectively deal with these two key problems threatens global growth prospects over all time horizons.
The short-term risks to Australia from the continued expansion of China, India and other emerging market economies relate to a tightening of a very different kind.
As noted in the Budget papers, a number of these economies face rising inflationary pressures. There is an inconsistency between the monetary policies some are pursuing and those that they need for sustained balanced growth.
In the case where exchange rates are being artificially repressed by some formal or informal link to the US dollar, these countries are importing monetary policy designed for an economy with subdued core inflation, a close to double digit unemployment rate, and where private demand is not yet self-sustaining. Yet emerging market economies are characterised by declining spare capacity, strong GDP growth and rising incomes.
As we know, global rebalancing requires changes to real exchange rates - and if the nominal exchange rate is repressed, then the competitiveness adjustments will be delivered through inflation in the high growth economies.
Unfortunately, the path being pursued is dislocative for the rest of the world, including Australia.
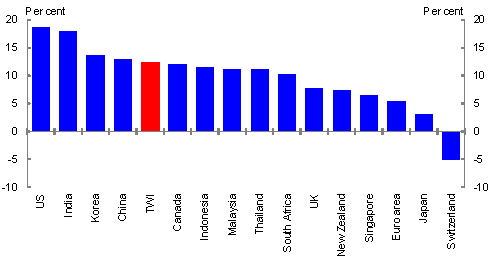
In a world of US dollar weakness, the Chinese renminbi is falling almost as fast against the Australian dollar as is the US dollar (Chart 2).
Chart 2: Australian dollar against selected TWI currencies
Source: Bloomberg.
China's approach to monetary policy is a source of global inflationary pressure but, more directly for us, raises the risk of action to restrain inflationary pressures in ways that impact on our export sectors. More generally, the macroeconomic challenges are becoming more, not less, complex for China with clear implications for Australia and the rest of the world. In short, volatility in China's future growth path cannot be ruled out.
So while we have a downside risk to our forecasts from more rapid global supply responses for our key export commodities, we also face the possibility of policy missteps beyond our influence.
But these are risks. And in the case of China, these are short-term risks around a positive long-term outlook.
Our central scenario, outlined in the Budget, is one of solid medium-term growth for Australia.
Framing the 2011-12 Budget
In addition to these global risks, this year's Budget was framed against the backdrop of some significant domestic challenges:
- more subdued economic conditions and outlook over the short-term;
- the legacy of the global financial crisis - particularly its impact on tax receipts;
- the beginn
ing of Mining Boom Mark II, which is significantly different to Mark I; and - a series of longer-term opportunities and challenges that will have a significant impact on the shape of Australia.2
Differing perspectives on these factors have influenced the reception to the Budget, so let me return to the three issues that I mentioned earlier.
Structural Balance - position of the Budget given the terms of trade
There has been some criticism of the Government's fiscal strategy based on various views of the structural position of the Budget.
In short, the argument is that given the historically high level of the terms of trade, and with the economy approaching full employment, we should already be in surplus.
While I understand where people are coming from, this is, in my view, an overly simplistic understanding of the limitations of estimates of the structural balance.
History of the Treasury's view
As you know, the Treasury has a long record of scepticism of structural balance estimates.
While conceptually appealing, such estimates are not sufficiently precise or robust to be used as an operational rule. Indeed, the key take-out message is that the relationship between government revenue and the level/value of economic activity can vary significantly over time - and that the complexity of that relationship is beyond the scope of structural balance estimates to capture.
That said, Treasury estimates of the structural budget balance were published in the 2009-10 Budget, and in a more detailed technical paper released last year.
Against that background, I would like to explore the proper application of the structural balance concept for assessing the appropriateness of fiscal policy because, while the estimates have been quoted widely, the caveats on their lack of precision have not.
Indeed, this excessive focus on point estimates has been at the heart of our long standing concern about publishing estimates of this kind.
To recap, there are two broad sets of issues with structural balance estimates.
Firstly, the difficulty in abstracting from the effects of the economic cycle to estimate the potential or structural level of economic activity.
In particular, we have long noted the difficulty in estimating the output gap in real time. As the UK has found following the GFC, estimates of potential output can change quickly - and when they do so, a structural surplus can turn rapidly into a structural deficit.
More recently, the much more important issue has been the difficulty of knowing the 'structural' level of the terms of trade.
The paper released last year included a detailed sensitivity analysis of the impact of different assumptions of the 'structural' terms of trade. What this says is that there is a range of plausible assumptions and different values that give very different results.
Exactly this point was made in the 2009-10 Budget papers.
Unfortunately, this sensitivity analysis is ignored in most public commentary on this issue - but it is fundamental to both the structural balance estimates and the policy conclusions that can reasonably follow from them.
This would be understandable if it was from people who did not understand the importance of sensitivity analysis - but curiously, this glossing over comes from many of the same people who also criticise the budget papers for not including more sensitivity analysis.
A second set of concerns with these estimates is that they necessarily make significant simplifying assumptions about the relationship between the state of the economy and government revenue.
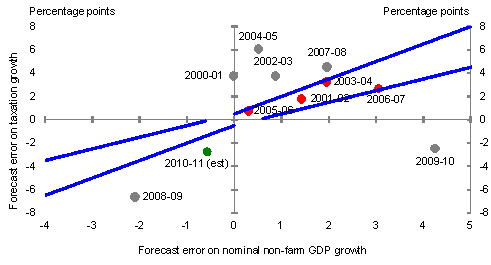
In particular, they necessarily assume that this relationship is constant into the future. However, as this chart from Budget Statement 5 shows, that assumption is not necessarily a safe one (Chart 3).
Chart 3: Budget forecast errors on nominal non-farm GDP growth and taxation revenue growth (excluding GST)
Source: Treasury.
Broadly, points below the dotted range represent forecasts of tax revenue growth that were too high, given the economic growth forecasts, and points above the range represent forecasts of tax revenue growth that were too low, given the economic growth forecasts.
For example, in 2002-03 nominal GDP growth turned out to be around ¾ of a percentage point higher than forecast but growth in tax revenue was almost 4 percentage points higher than forecast. This is higher than the around 1 percentage point error that the rule of thumb suggests should be theoretically associated with an economic forecasting error of that magnitude.
In recent years, errors in tax revenue estimates have been significantly affected by the GFC, particularly with regard to capital gains tax and the utilisation of both operating and capital losses.
So, to reiterate, the relationship between government revenue and the level/value of economic activity can vary significantly over time - and the complexity of this relationship is beyond the scope of structural balance estimates to capture.
As an aside, the chart also reinforces that the Treasury's forecasts have tended to be somewhat conservative.
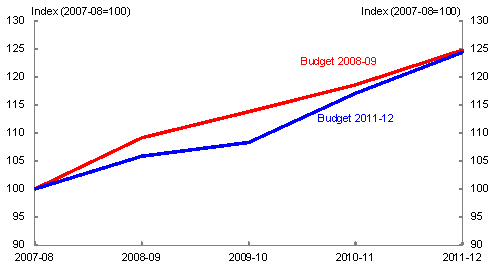
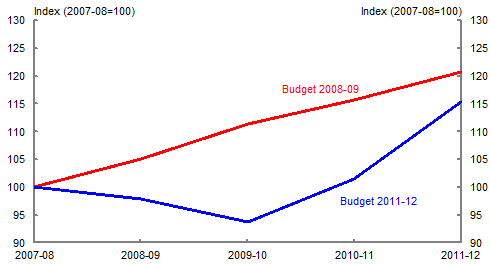
Chart 4 maps the projections for nominal GDP at the time of the 2008-09 Budget with the estimates in the current Budget.
Chart 4: Differences in nominal GDP estimates
Source: ABS and Treasury estimates.
What is striking is that the level of nominal GDP in 2011-12 is the same in both budgets.
However, despite this, revenue is much lower in the 2011-12 Budget - about $15 billion or 1¼ per cent of GDP (Chart 5).
Chart 5: Differences in expected tax receipts
Source: Treasury estimates.
This is contrary to the assumption underpinning traditional structural balance estimates methodology.
That is why significant resources - and one of the key analytical statements of the Budget Statement 5 - are devoted to explaining the drivers of the revenue estimates.
So, what does the analysis in the budget papers tell us about how these limitations might be affecting structural balance estimates?
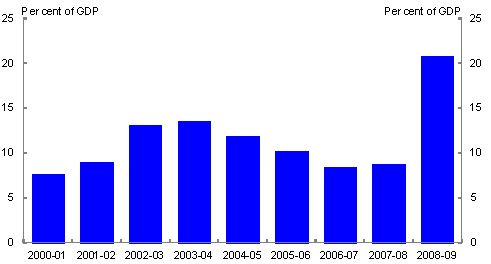
One thing is that in the lead up to the GFC, capital gains tax (CGT) became an increasingly important component of government revenue. Yet from 2008-09, CGT revenue has fallen.
Since MYEFO further information has become available on the stock of capital losses built up during the crisis. The stock of capital losses more than doubled in 2008-09 to $260 billion or 20.8 per cent of GDP (Chart 6).
Chart 6: Stock of capital losses as share of GDP
Source: ATO.
So it shouldn't be a surprise that, taking into account this information, the estimates for CGT revenue in 2010-11 and 2011-12 have been reduced by $3.2 billion and $3.0 billion since MYEFO.
Indeed, it has become clear that CGT collections are unlikely to return to pre-crisis levels for some years.
The structural balance estimates released last year tried to take account of the volatility of CGT revenues by assuming that their 'structural' level would be equivalent to their decade average.
While it is well understood that an increas
e in the terms of trade - all else being equal - should improve the underlying cash balance (for the same structural balance), it is not as well appreciated that achieving the same underlying cash balance with these lower CGT receipts would imply a higher structural balance has been achieved.
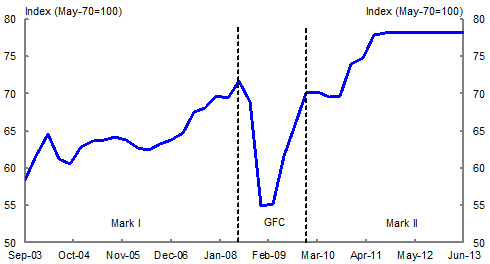
Another issue is that the increase in the terms of trade in Mining Boom Mark II is not translating into revenue in the same way as in Mining Boom Mark I.
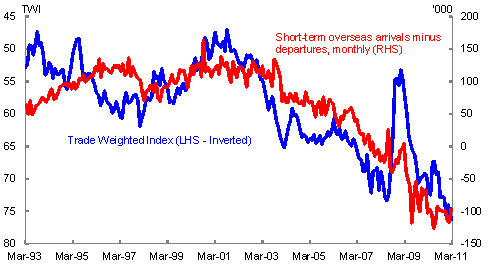
It is widely known that one of the key drivers behind the emergence of the multispeed economy is the record exchange rate - there are sectors of the economy that are not benefiting from the strength of the mining sector and which are being hurt by the high exchange rate (Chart 7).
Chart 7: Tourism and the TWI
Source: ABS cat. no. 3401.0 and RBA.
But what is less well appreciated is the difference in the sustained level of the exchange rate over these periods.
While the exchange rate rose during Mining Boom Mark I, the average level over the period - 64 against the TWI; 78c against the US dollar - was much lower than it is now - around 78 against the TWI; 107c against the US dollar, as assumed in the 2011-12 Budget.
This means that the exchange rate is having a significantly different impact on the economy in Mining Boom Mark II than in the Mining Boom Mark I period (Chart 8).
Chart 8: Exchange rate
Source: ABS cat. no. 5302.0 and Treasury.
In this environment it is not surprising that a lot of non-resource-related businesses will be less inclined, or able, to borrow to invest.
One of the implications is a significant shift in the composition of corporate profits.
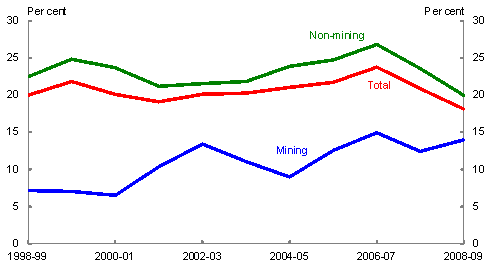
In 2003-04 mining was around 15 per cent of total private corporate gross operating surplus (GOS). It is presently around one-third. And because mining has a lower ratio of tax to GOS, this implies lower company tax collections than otherwise.
Chart 9: Ratio of company tax to corporate GOS - Mining versus non-mining
Source: ABS, ATO and Treasury estimates.
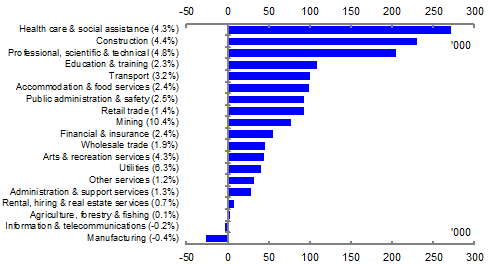
Moreover, the surge in mining investment in coming years will see depreciation expenses rise as a proportion of mining sector corporate profits.
As a consequence of this change in the composition of GOS and higher depreciation expenses, the outlook for company tax receipts is more subdued than implied by the medium term economic outlook.
If depreciation expenses as a share of GOS for mining companies stayed at their level since 2005-06 (around 19 per cent), rather than increasing (as a result of more investment), then company tax receipts in 2014-15 would be projected to be $3 billion or ¼ per cent of GDP, higher than projected in the 2011-12 Budget (Chart 10).
Chart 10: Depreciation expenses as proportion of corporate GOS
Mining versus whole economy
Source: ABS and Treasury estimates.
And were this to be for the same level of economic activity, it would be counted as a structural improvement in the budget.
Summary
The point in all of this is that we do not know what the structural balance is with sufficient precision for it to be an operational tool for policy.
So where does this leave us?
Even were the Budget to be in structural deficit in 2012-13, I do not believe that a sensible policy conclusion would be that we should automatically engage in a more rapid fiscal consolidation over the next two years than that set out in the 2011-12 Budget.
The economic impact of natural disasters, including the additional outlays required, and the emergence of a multispeed economy has placed significant pressure on the Budget. And with the economy expected to grow at an above-trend pace over the forward estimates, the labour market edging toward full capacity and the terms of trade expected to remain at elevated levels for quite some time, it is appropriate to improve the fiscal position.
The questions are 'by how much' and 'over what time frame'.
The fiscal tightening is already underway. The withdrawal of the fiscal stimulus results in a detraction from GDP growth of one per cent in 2010-11. Now if we had chosen to withdraw the stimulus more rapidly, the detraction would be greater still. And it is unclear whether a faster 'ex ante' consolidation would have resulted in an actual consolidation of the same magnitude because actual growth would have been weaker in 2010-11 than the 2¼ per cent now in prospect.
Looking ahead, the record consolidation in prospect over the next two years, combined with the tightening in monetary conditions associated with the high exchange rate, continuing effects of past monetary policy decisions and market expectations of further increases, places us in an interesting situation.
The central scenario is positive but, as discussed earlier, there are clear global risks. My own sense is that doing significantly more to tighten fiscal policy in the short-run would inject another risk - that of slowing the economy excessively - and could undermine the prospects for achieving the promised fiscal consolidation.
Some in this room may disagree with this position, arguing for more rapid tightening, both now and into the future. I respect your view, but would disagree.
A few have wanted tighter fiscal policy all along, as indicated by the criticism of policy as being excessively stimulatory in the midst of the GFC, or not being withdrawn before now.
Let me be clear, as one who chased the economy down in the early 1990s with repeatedly inadequate policy responses, I do not believe we can be precise about the extent of stimulus required in the midst of a crisis. And if the response is inadequate, we consign more Australians to sustained unemployment and lower living standards. We only have to look around the developed world post-GFC, or our region post the Asian crisis, to realise how long it can take to restore growth, employment and living standards to their pre-crisis levels.3
As such, decisions to pursue significant structural changes to the budget position need to be mindful of the state of the business cycle, and the attendant risks. Against those considerations, in an 'ex ante' sense I do not see any case for aiming for significantly more than the nearly 4 per cent of GDP fiscal consolidation over the next two years.
- Beyond 2012-13 - where we currently use projections not forecasts - is legitimately, a more open question. The stance of policy to be pursued thereafter needs to be guided by actual developments, globally and domestically, over the next year or so.
- And, of course, policy needs to continue to be anchored by medium-term fiscal objectives.
The transformation of the global economy - China's influence on Australia's prosperity
The second issue I would like to talk about today is Australia as an economy in transition.
The global economy is undergoing a transformation unprecedented in the last 100 years. Geo-strategic and geo-economic weight is moving, inexorably, from the Western advanced economies towards the emerging market economies. And the pace of this transformation is faster than many anticipated. Key emerg
ing markets from Australia's perspective are China and India.
Together accounting for slightly more than one-third of the world's people, these two economies are growing rapidly and should continue to do so. Indeed, the IMF estimate that China should overtake the US to become the world's largest economy by 2016 and, in turn, be overtaken by India by mid-century.
There is nothing pre-ordained about these growth paths, and size does not automatically confer economic or strategic weight. But these transitions - whether smooth or rocky - have important implications for Australia. Indeed, they constitute probably the most significant external shock Australia has ever experienced.
If handled well, from a macroeconomic perspective, these developments have the potential to be a significant positive for the Australian economy. Urbanisation and industrialisation have resulted in strong demand for Australia's energy and mineral resources. The resulting improved terms of trade has increased real income as the purchasing power of our exports increased. Looking ahead, a growing middle class will boost demand for our commodities, and for our services exports - education, tourism, and professional services - and for niche, high-end, manufactures.
But these developments also expose the economy to increased macroeconomic volatility and, arguably more importantly, a difficult adjustment process.
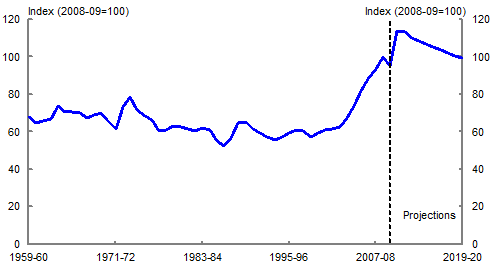
As noted in the Budget, our terms of trade are currently at 140 year highs and we assume they come off only slowly, falling by around 20 per cent over a 15 year period.
Visually, the impact of this is striking. Substantively, even more so (Chart 11). Not only has the terms of trade driven great increases in national income, but also in the nominal exchange rate.
Chart 11: Terms of trade
Source: ABS cat. no. 5206.0 and Treasury.
The Australian dollar, which is currently at record levels, can be expected to move roughly in line with the terms of trade over the longer term. It is therefore expected to also remain persistently high for some time.
The implications of a sustained increase in the terms of trade and a persistently high exchange rate are significantly different to those of a temporary shock - particularly for the structure of the economy.
Most Australian businesses are well equipped to deal with short-term volatility of the exchange rate.
But what we are dealing with now is a very different type of event - not a temporary appreciation, but a sustained shift.
This will challenge a number of existing business models.
Inevitably, this will see calls for support for producers that are suffering from a lack of competitiveness due to a 'temporarily' high exchange rate.
Higher resource prices will see capital and labour shift towards the mining sector, where they are more valuable. This shift will be facilitated by the appreciation of the exchange rate, which shifts domestic demand towards imports and reduces the competitiveness of exports and import-competing activities.
The manufacturing and other trade-exposed sectors that are not benefiting from higher commodity prices will come under particular pressure, but all sectors will be affected.
The longer-term shift away from parts of the traditional manufacturing sector, which began in the middle of the 20th century, will continue, although it would be wrong to automatically assume all manufacturing will be adversely affected.
And while the mining and related sectors can be expected to continue to grow - drawing resources from the rest of the economy - they will be overshadowed by the longer-term shift towards the services sector.
This change to the Australian economy - its structural evolution - reflects a prolonged shift in our comparative advantage that began in the second half of the 20th century, as rapidly industrialising Asian nations emerged as labour-abundant competitors.
Our evolution is common to the economic development of virtually all advanced economies, including those in Asia (Chart 12).
Chart 12: Employment share by activity
Australia
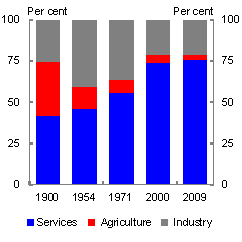
G7
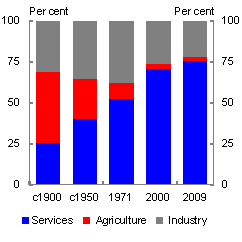
Note: Identifies broad changes and does not fully account for definitional or technical changes in data. Industry includes mining, manufacturing, construction, gas, electricity and water. Agriculture includes forestry and fishery. See also Withers et al. (1985) for similar historical estimates for Australia. Withers et al. (1985) estimated that Australian employment in agriculture and industry in 1900 was around a quarter and a third respectively.
Source: Feinstein, OECD Statistics and Treasury.
To date, the economy has demonstrated the flexibility to deal with significant structural change. In particular, a flexible exchange rate and labour market have helped facilitate the reallocation of resources across the economy.
Without a flexible economy we could expect higher inflation (and interest rates) and, somewhat perversely, a rise in unemployment.
So what, then, is the challenge in this?
The first challenge is to recognise and understand that this analysis can give rise to understandable concerns in significant sections of the Australian community. Such as:
- How will the benefits of the boom in the terms of trade be shared through the community?
- After all, today we are swapping a non-renewable capital asset - mineral and energy reserves - for an income stream. If we don't receive an appropriate return, and invest that wisely to build human and physical capital, and to boost national savings, including through superannuation, we could find ourselves having consumed our assets and be faced with lower future incomes.
- Will our manufacturing sector be 'hollowed out' and 'lost forever' leaving us as 'nothing but a quarry'?
- What if the boom suddenly stops, as all previous booms have?
Concerns like these are being reflected in calls for measures to protect sectors threatened by the structural shift in our terms of trade. They drive calls for strengthened anti-dumping legislation, intervention to deliver a lower exchange rate and increased industry assistance.
Why is there is so much discomfort in the community about this transformation?
In part, because it involves change, and change is often difficult. In addition, the short-term 'costs' of the adjustment are often concentrated in particular sectors. But perhaps most importantly, what is happening is not well understood.
To make the most of our favourable economic position, we need to understand these concerns and address them - with patience and reasoned argument.
For example, it is important to highlight that a higher exchange rate helps to spread the benefits of the terms of trade boom through the community by reducing the price of imported goods and services. Unless the global environment changes, attempting to lower the nominal exchange rate simply results in the required real appreciation being delivered through higher inflation rather than a higher nominal exchange rate. In other words, a higher nominal exchange rate benefits consumers!
We can remind ourselves, and others, that Australia is, in fact, a diversified, adaptable, knowledge economy as shown by Chart 12 previously. Services comprise around the same proportion of the Australian economy as they do in the G7 economie
s.
We can also show that the Australian economy is always changing - there are always new jobs and businesses being created as new opportunities are identified. By way of example, in a typical year, around 300,000 businesses are born and a similar number die (Australian Bureau of Statistics, 2010a); around two million people start new jobs and leave old ones; and half a million workers change industries (Australian Bureau of Statistics, 2010b).
The message is clear. Just as Australia is an economy in transition, the businesses and people who succeed are those that embrace and adapt to changing circumstances.
We can highlight how the emergence of major countries in our region will see the gravity of world trade shift closer to our region. The 'tyranny of distance' from major markets that has for so long been a limiting factor on the expansion of Australian business will continue to shift in our favour.
And somewhat related, but less well understood, is the changing world economy will present opportunities for the broader Australian economy from the rise of the Asian middle class - a potentially very large market for our goods and services.
However, if we are to take advantage of these opportunities it is likely to require more change in the structure, and perhaps more importantly, the mindset of Australian businesses and the skill sets of Australian workers.
It will also be important to build on our relationship with the Asian region to ensure that we embed ourselves in this vast market place.
The role of participation and productivity in smoothing the transition
I started off by focussing on the 'macroeconomics' of the Budget - the bottom line and the drivers of that outcome, and the debate about the structural fiscal position.
But the quality of individual spending and saving decisions - the 'microeconomics' - is arguably just as important to Australia's capacity to manage the transition currently underway.
The Budget addresses the key micro priorities necessary to achieve this; building on this foundation promises to deliver significant improvement over time.
The Budget includes initiatives to boost participation of groups in our society with a low attachment to the labour market. In doing so, it provides the opportunity for greater engagement in society while delivering clear structural benefits for the Budget's macroeconomics into the future.
The reductions in tax expenditures will also lead to a permanent strengthening of the fiscal position.
Among the spends, there is provisions for a boost for skills development and infrastructure. Both of these are necessary steps towards improving productivity.
The boost to skilled migration also adds to efforts to address Australia's labour force needs.
A reform agenda that increases the supply of labour, improves the flexibility of the economy and boosts productivity will be vital for our future prosperity in the face of the long-term trends reshaping our economy. The most credible policy responses will be those that allow the economy to adjust, while protecting those most vulnerable.
This will not be easy. As I noted at the outset, the reforms of the past 25 years were difficult and hard won, with populist challenges to their need and their effectiveness.
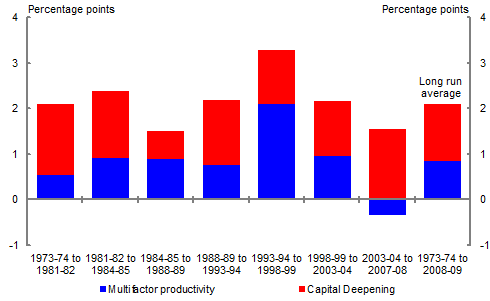
Yet today, it is now widely accepted that those reforms have transformed the dynamics of the Australian economy, driving a surge in productivity growth (Chart 13).
Chart 13: Productivity - growth cycle analysis
Source: ABS cat. no. 5206.0 and Treasury.
But, with the passage of time, it can be easy for people to hark back to this era and forget just how hard it was to build support for these reforms.
Importantly, structural reform is not a one-off - it is a process, not an event. Without continued effort the gains that were made can be eroded over time, particularly given the long lags between reforms and measured productivity improvements.
Indeed, multifactor productivity (MFP) growth, which measures the amount of output - in real value added terms - obtained from a combined unit of capital and labour, turned negative over the period 2003-04 to 2007-08. In the two years since the end of that growth cycle, MFP has declined further, at an average annual rate of around one per cent per year.
This decline is of concern to policy makers - and if it isn't of concern to everyone in this room, it should be. Were it not for the increased terms of trade, growth in living standards of Australians would have already begun to slow.
As the Treasurer has noted, Australia is an economy in transition. Productivity (and participation) measures of the type announced in this Budget need to be sustained and expanded over time; innovation needs to be encouraged; and price signals need to be allowed to work, if we are to grasp the opportunities that are open to Australia.
Conclusion
To conclude, there is a lot to like about our prospects, now and into the future.
Globalisation is transforming the structure of our economy. In particular, the re-emergence of China and the sustained growth of India have conferred on Australia a large boost to our real wealth but, at the same time, set up a set of structural adjustments that will challenge policy makers for decades.
A clear appreciation of these challenges is important when thinking about the longer-term implications of this Budget.
And Australians of all walks of life would be better served by a more sophisticated debate about both the macroeconomic and microeconomic dimensions of fiscal policy.
Thank you.
References
Australian Bureau of Statistics 2010a, Counts of Australian Businesses, including Entries and Exits, cat. no. 8165.0, Canberra.
Australian Bureau of Statistics 2010b, Labour Mobility, cat. no. 6209.0, Canberra.
Feinstein, C 1999, 'Structural Change in the Developed Countries during the Twentieth Century', Oxford Review of Economic Policy, vol. 15, no. 4, pp 35-55.
IMF 2011, World Economic Outlook, April, International Monetary Fund.
Withers, G, Endres, T and Perry, L 1985, 'Australian Historical Statistics', source paper in Economic History No. 7, Australian National University, Canberra.
1 Dr Parkinson would like to acknowledge the contribution of Treasury colleagues James Kelly and Shane Johnson. The views in this article are those of the author and not necessarily those of the Australian Treasury.
2 Key among the longer-term opportunities and challenges are: the consequences of population ageing, the continuing ICT revolution, a global economic transformation resulting in changing geo-strategic and geo-economic weight and the need to seriously address environmental sustainability and pockets of entrenched social disadvantage.
3 This is not, however, to suggest that fiscal stimulus should always be part of the suite of policy responses to a crisis, particularly if that crisis is triggered by an unsustainable fiscal position. However, that was not the situation that confronted Australia in either the early 1990s or in the GFC.