Steve Morling and Tony McDonald1
The Australian economy performed better than most other advanced economies during the global economic downturn that followed the Global Financial Crisis. This paper looks back at the two key consecutive periods during this episode — the period of global contraction and the early period of global recovery — providing detailed information about how the economy evolved during this episode and drawing inferences from the data about what factors might have been behind the economy's resilience.
It concludes that the strong performance of the Australian real economy during the key quarters of the global contraction largely reflected the strength of the Australian financial system, the rapid deployment of fiscal stimulus measures, the first effects of a significant easing in monetary policy and a pickup in demand from China which partly offset pronounced external weakness elsewhere.
The performance of the Australian economy during the early stages of the global recovery reflected the shift in the structure of fiscal stimulus from transfers to direct expenditure measures, the impact of monetary policy easing on household consumption and business investment and the rapid recovery in Australia's major trading partners.
Finally, it concludes that the influence of these different factors was likely to have been mutually reinforcing.
Introduction
The Global Financial Crisis was followed by the deepest recession in the world economy since World War II. The Australian economy performed better during this period than other advanced economies on nearly all relevant indicators. A range of policy and institutional factors have been put forward for the relatively strong performance over this period (see, McDonald and Morling, 2011).
A key challenge in testing the importance of different explanations for the resilience of the Australian economy during the global downturn is that the counterfactual — what would have happened in the absence of each factor — cannot be measured directly. It follows that the full impact of the various policy measures that were taken to support the Australian economy during the crisis may never be known with certainty.
That said, as more and better quality economic data become available to show what actually happened in the economy over this period, it is possible to draw some reasonable inferences about the extent to which the different factors may have played a role.
Periods of analysis
Given the potential importance of the choice of time periods examined to the conclusions of the paper, it is important to explain at the outset the basis on which the periods were chosen.
The first period of analysis in this paper is the three key quarters of the global contraction: the September quarter 2008, December quarter 2008 and the March quarter 2009. World GDP contracted over these three quarters, falling by nearly 2.7 per cent. Australia's main trading partners' GDP contracted by about 3.5 per cent in the three key quarters.
The second period covers the three quarters of the early stages of the global recovery: the June quarter 2009, September quarter 2009 and the December quarter 2009. The choice of the December quarter 2009 as the end point for this period is somewhat arbitrary, but the period picks up the first three quarters of solid and strengthening global recovery, and is clearly distinguishable from the previous period of contraction. Global growth was above 1 per cent in each of the three quarters, with the pace of growth peaking in the December 2009 quarter.
This approach has the advantage of avoiding the inherent volatility involved in analysis of individual quarters, while comparing periods within which global economic trends were broadly comparable. Further, it is analytically convenient to compare two periods of equal length.
Notwithstanding this, it is important to recognise that there is a degree of arbitrariness in the choice of any period of analysis (for example, calendar year compared with financial year). It is therefore appropriate to note that detailed analysis of different periods (either individual quarters or different aggregation of quarters) may produce different results. This caveat should be borne in mind when interpreting the results of this paper.
The Australian economy: September quarter 2008, December quarter 2008, March quarter 2009
This section analyses economic growth in the Australian economy during the three quarters representing the most acute period of the global downturn — the September quarter 2008, December quarter 2008 and the March quarter 2009.
Over these three quarters, the Australian economy grew by a little over 0.3 per cent — or an average of around 0.1 per cent per quarter, well below 'trend' or 'potential' growth of around 0.8 per cent per quarter.
The pattern of growth was uneven over this period, with growth of 0.5 per cent in the September quarter 2008 followed by a sharp contraction of 0.9 per cent in the December quarter 2008, with economic activity rebounding by 0.8 per cent in the March quarter 2009.
Australia was one of the few advanced economies that avoided recording at least two negative quarters of economic growth over this period. During the most acute period of the global recession Australia's economy slowed but it did not experience the large sustained contractions experienced in many other countries over the same period.
Industry contributions — GDP (P) components
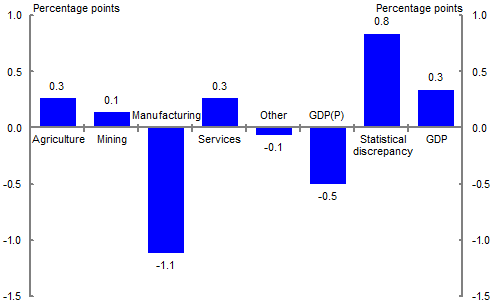
There were significant differences in the performance of different sectors of the Australian economy over the period of the global contraction (Chart 1). There was a sharp decline in output from the manufacturing sector, detracting 1.1 percentage points from economic activity over the period. The weakness in manufacturing was partly offset by growth in other sectors. Despite a reduction in output in the insurance and other financial services sector of around 1.3 per cent over the period (detracting 0.1 percentage points from growth) the services sector as a whole contributed around 0.3 percentage points to growth in activity in the period. Primary industry conditions started to improve with agriculture, forestry and fishing contributing 0.3 percentage points and mining contributing 0.1 percentage points to economic growth in the period. Unfortunately, a large statistical discrepancy in the National Accounts data masked some of the other sectoral developments.2 Overall, the production measure of GDP declined by 0.5 per cent over the period.
Chart 1: Sectoral contributions to growth
(September qtr. 2008, December qtr. 2008, March qtr. 2009)
Source: ABS cat. no. 5206.0 and Treasury.
Expenditure contributions — GDP (E) components
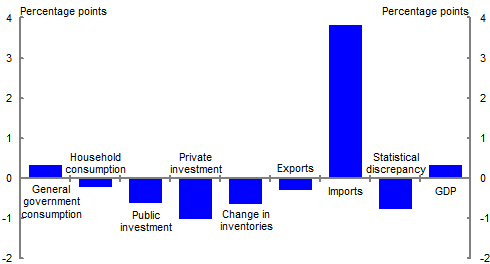
In a mechanical sense, the positive growth in the expenditure measure of GDP over this period primarily reflected a reduction of expenditure on imports. Overall growth was weak, but it would have been much weaker still if much of the slowdown in spending had not been borne by a large reduction in imported goods. The only growth in expenditure during these three quarters came from government consumption. Each of the other components — household consumption, private and public investment, changes in inventories and exports — fell over that period, detracting from GDP growth (Chart 2).
Chart 2: Contribution to GDP growth
(September qtr. 2008, December qtr. 2008, March qtr. 2009)
Note: Declining imports do not contribute to domestic output growth (see page 47).
Source: ABS cat. no. 5206.0 and Treasury.
Consumption
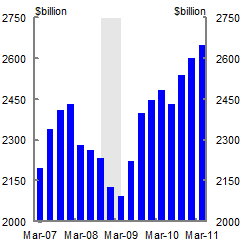
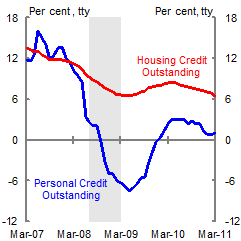
In real terms, household consumption fell by around 0.3 per cent over the period, reflecting a sharp deterioration in consumer confidence, deteriorating employment prospects and a sizeable fall in household wealth, underpinned by a decline in financial asset holdings of about $337 billion between December quarter 2007 and March quarter 2009 (Chart 3). Current price household primary income (which includes compensation of employees, household gross operating surplus from dwellings, gross mixed income and property income) was weak in the three quarters ending March 2009, with wage growth subdued and hours worked falling; real household primary income declined by around 1 per cent. As personal credit also declined, households' capacity and preparedness to increase spending was limited (Chart 4).
Chart 3: Household financial assets
Source: ABS cat. no. 5232.0.
Chart 4: Household credit
Source: RBA.
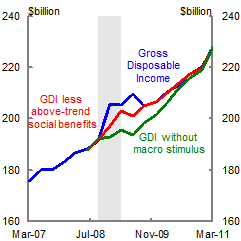
Notwithstanding the weakness in household primary income, household disposable income received a substantial boost from fiscal and monetary policy over this period (Chart 5).
Household gross income, which includes the transfer payments made under the fiscal stimulus, rose sharply in the December quarter 2008, reflecting a $9 billion (2.8 per cent of current price quarterly GDP) increase in social assistance benefits — largely the fiscal stimulus (Chart 6). Household gross income declined by $6.1 billion in the March quarter 2009 before picking up again sharply in the June quarter 2009 (by $6.4 billion) on the back of the next round of cash stimulus payments.
Household interest payments rose by $0.4 billion in the September quarter 2008 but declined by about $4.5 billion (1.4 per cent of current price quarterly GDP) in the December quarter 2008 and by a further $3.2 billion in the March quarter 2009 — largely due to the monetary policy easing (Chart 6).3
Chart 5: Impact of macro stimulus on
household gross disposable income
Source: ABS cat. no. 5206.0 and Treasury.
Chart 6: Social assistance receipts and
(net) interest payments
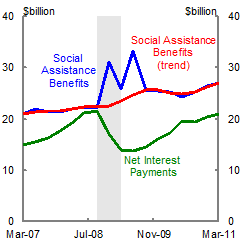
Note: Household gross disposable income (s.a.) is adjusted for the impact of macroeconomic policy stimulus by using the proxy of subtracting the dollar value of the difference between the seasonally adjusted and trend measures of social assistance benefits and assuming that net interest payments were held constant at their June quarter 2008 level.4
Source: ABS cat. no. 5206.0.
A key question is whether or not household consumption would have been weaker still in the absence of this boost to income, or whether the additional disposable income was simply saved. The evidence suggests that consumption was boosted substantially by the temporary increase in income, notwithstanding the rise in saving that occurred during, and subsequent to, the global financial crisis.
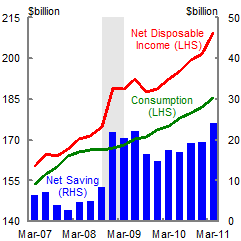
The household saving ratio rose sharply in the December quarter 2008, as household consumption rose by less than the jump in household disposable income (Chart 7), similar to the result observed in the United States in 2008 (Taylor, 2009).
While this could be seen as consistent with at least some of the additional disposable income in the period from fiscal and monetary stimulus being saved, it implicitly assumes that household consumption activity would have been largely unchanged in the face of the global downturn. There are good grounds to believe that this would not have been the case. The heightened uncertainty of that period (and reduction in financial wealth) would have seen households become more cautious, rebuilding balance sheets through increased saving and reduced reliance on debt. So the counterfactual — what the level of saving would have been during that period without the stimulus — is not clear.5
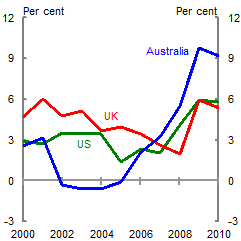
Indeed, the increase to the household saving ratio has been sustained well past the period of the boost to household incomes from fiscal and monetary stimulus (Chart 8). If the preferred level of saving from non-stimulus income at that time was around post-stimulus averages, the evidence suggests that nearly two thirds of the temporary boost to household income from the fiscal stimulus and lower interest rates in the December quarter 2008 and the March and June quarters of 2009 was spent. The household saving rate rose by an even greater extent than in most other advanced economies over the same period (Chart 8).
Chart 7: Household income and
consumption
Source: ABS cat. no. 5206.0.
Chart 8: International comparison of
household saving
Source: ABS cat. no. 5206.0 and IMF.
As an aside, it should be noted that the household saving ratio is a residual measure and as such has several limitations as a measure of household saving (Treasury, 1999). Among these, it compares data from the income measure of GDP with data from the expenditure measure of GDP — although, as noted above, there can be significant differences between these measures of GDP.
The weakness in household consumption over this period is at odds with the sharp rise in retail sales. A possible explanation lies in the behaviour of the different components of household consumption over the period (Table 1). The decline in household consumption was driven by a sharp decline in the purchase and operation of vehicles (down 14 per cent and 6 per cent) and (unsurprisingly in a financial crisis) in consumption of insurance and financial ser
vices (down 4 per cent). Other components of household consumption (such as food and rent) rose modestly over the period.
Table 1: Components of household consumption
(September qtr. 2008, December qtr. 2008, March qtr. 2009)

Note: Fuel-related items is the sum of Operation of vehicles and Electricity, gas and other fuel.
Source: ABS cat. no. 5206.0 and Treasury.
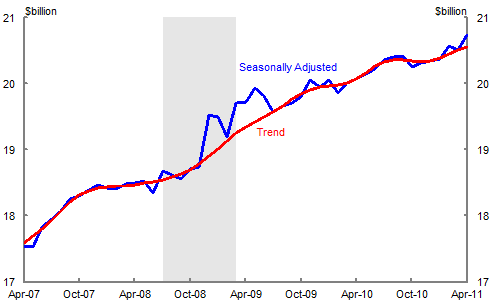
Interestingly, the monthly (current price) retail trade data, which do not include the purchase or operation of vehicles, consumption of insurance and other financial services or fuel-related items — each of which declined — clearly show the impact of fiscal stimulus payments (in particular) on consumption (Chart 9).
Chart 9: Monthly retail trade
(Nominal)
Source: ABS cat. no. 8501.0.
Overall, the most plausible explanation of the data is that, while some of the fiscal and monetary stimulus appears to have been saved, consumption would have been significantly weaker without the timely boost to incomes from the stimulus.
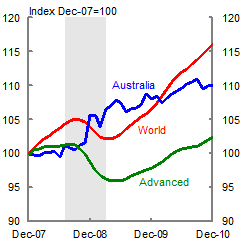
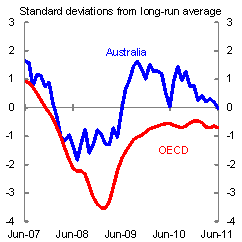
Retail trade and consumption recovered sooner in Australia than in other advanced economies that were slower in implementing tax or transfer payments to households and/or for which monetary policy easing had little effect on household income in the period (Charts 10 and 11).
The sharp rise in retail trade during this episode is in stark contrast to the sharp decline in Advanced countries as a group. By March 2009 Australia's retail trade was around 6.0 per cent higher than its pre-crisis level; Advanced countries' retail trade was about 3.7 per cent lower than its pre-crisis levels. It seems reasonable that the relatively large fiscal and monetary stimulus in Australia was at least partly behind this divergence.
Chart 10: International retail trade
(Monthly)
Source: ABS cat. no. 8501.0 and IMF.
Chart 11: International consumption
(Annualised)
Note: World and Advanced data based on three-month moving average.
Source: ABS cat. no. 5206.0 and IMF.
Investment
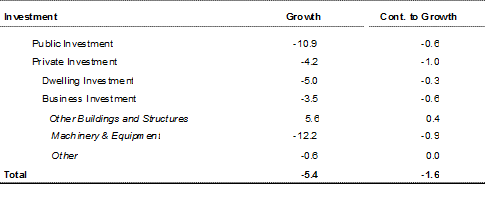
In real terms, investment fell by around 5.4 per cent over the period, detracting around 1.6 percentage points from GDP growth, with declines in both public investment (10.9 per cent) and private investment (4.2 per cent).6
The fall in private investment detracted 1.0 percentage point from cumulative GDP growth over these quarters.
Notwithstanding this, the decline in private investment was significantly lower than that experienced in previous global downturns. In the 1980s and 1990s recessions private investment detracted 3.6 percentage points (over 6 quarters) and 4.2 percentage points (over 10 quarters) from GDP growth respectively.
Table 2: Components of investment
(September qtr. 2008, December qtr. 2008, March qtr. 2009)
Source: ABS cat. no. 5206.0 and Treasury.
Dwelling investment
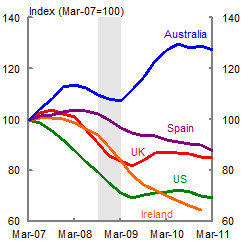
Dwelling Investment fell by around 5 per cent over the three quarters of the global contraction, detracting around 0.3 percentage points from GDP growth. This was a more modest fall than might have been expected, given the experience of past recessions (dwelling investment detracted 1.3 percentage points from economic activity during the early 1990s recession) and considering that a key catalyst for the global downturn was a collapse in the US housing market (and to a lesser extent the fall in the Spanish, UK and Irish housing markets).
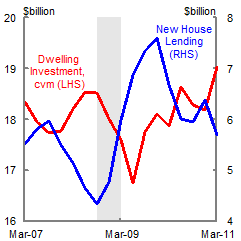
Indeed the housing sector proved particularly resilient during this episode. While the pace of housing credit slowed, Australian banks continued to provide finance to new housing investment (Chart 12). Further, the fall in house prices was much more muted than in many other countries, reflecting continued strong demand from population growth and supply restrictions, the support provided by the First Home Owners Boost and the early effects of lower mortgage interest rates (Chart 13).
Chart 12: New housing finance
Source: ABS cat. no. 5206.0 and 5609.0.
Chart 13: House prices
Source: ABS cat. no. 6416.0, Halifax, S&P Case-Shiller and national statistical agencies.
Note: New Housing Finance is new housing loans to owner occupiers for construction of dwellings or purchase of new dwellings.
Business investment
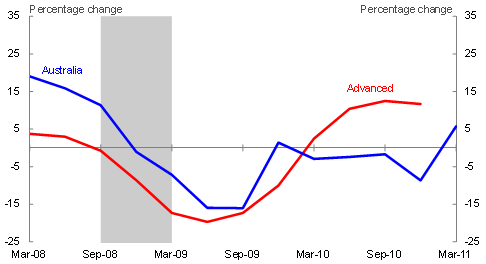
Private business investment fell 3.5 per cent over this period, detracting 0.6 percentage points from GDP growth. This decline was entirely due to a sharp 12.2 per cent decline in business investment in machinery and equipment. Nevertheless, the decline in machinery and equipment investment was less than in other advanced economies (Chart 14). Non-dwelling construction held up for longer, probably because these types of large projects take longer to respond, but subsequently weakened.
Chart 14: Machinery and equipment investment
(Through the year)
Source: ABS cat. no. 5206.0, Treasury and IMF.
Net Exports
Net exports contributed a cumulative 3.5 percentage points to growth over the September 2008, December 2008 and March 2009 quarters, with imports contributing 3.8 percentage points to growth and exports detracting 0.3 percentage points from growth. The strength of net exports has led some commentators to assert that the relative resilience of the Australian economy over this period can be fully explained by the strength of external demand and/or the effect of a lower real exchange rate. (See McDonald and Morling, 2011 for a summary of these arguments.) To test this view, it is useful to separately analyse the contributions of exports and imports.
Exports
Exports fel
l by 1.2 per cent over the three key quarters and detracted 0.3 percentage points from GDP growth. While rural commodities grew by nearly 20 per cent, this was more than offset by sharp falls in the volume of elaborately transformed manufactures (ETM) exports (down 17.3 per cent) and non-rural commodity exports (down 3.8 per cent), with services exports also falling slightly (down around 0.5 per cent).
Rural commodity growth was positive, driven by an improvement in weather conditions with improved production, particularly in cereal grains and cereal preparations (up 35.9 per cent).
The extent of the global downturn is evident in the sharp fall in the volume (as well as the prices) of non-rural commodity exports. The volume of metal ores and minerals fell by 9 per cent in the December quarter 2008, so that, despite a rebound in the March quarter 2009 it fell by 6.4 per cent over the three quarters. The volume of coal, coke and briquettes fell sharply in both the December quarter 2008 and the March quarter 2009, to be over 16 per cent lower over the three quarters. On the other hand, exports of non-mineral fuels (that is, oil and gas) increased over the period, up by around 6 per cent over the three quarters.
There was significant variation in the volume of non-rural commodity exports to different countries. In particular, the fall in export volume (and price) would have been greater over this period had it not been for continued growth in demand from China partly offsetting sharply lower demand from other major trading partners. Despite weakness in the December quarter 2008, the cumulative contribution to Australia's GDP growth from exports of iron ore and coal to China over the three quarters was 0.8 percentage points.7
The significant depreciation of the exchange rate over the period (the Trade Weighted Index fell around 23 per cent between June 2008 and March 2009) meant that Australian ETM exports became more competitive, as the Australian dollar price of ETM imports rose while the foreign currency price of Australia's ETM exports fell sharply.
Despite this, Australia's ETM export volumes fell sharply over this period, reflecting a global decline in demand for machinery and consumer durables over this period.
On the other hand, the relatively muted decline in services exports over this period is likely to have been partly due to the decline in the exchange rate. The Australian dollar price of service exports rose by around 2 per cent in the period, compared with the more than 20 per cent fall in the exchange rate, implying a significant decline in the foreign currency price of service exports, supporting volumes to a greater extent.
Overall, while it is clear that the volume of Australia's exports over this period was supported by the lower exchange rate, this effect appears to have been swamped by the impact of the global downturn on demand for exports over the period.
Imports
Mechanically, the decline in the volume of imports over the period contributed a massive 3.8 percentage points to growth over the three quarters. Clearly, then, understanding the behaviour of imports over this period is a key part of understanding the relative resilience of the Australian economy during the global downturn.
It is useful to consider the conceptual underpinning of a reduction of imports adding to GDP growth. In theory and practice, imports do not contribute to GDP — rather, it is an accounting treatment to allow for the fact that the other expenditure elements of GDP include spending that is not met by domestic production. The ABS does not provide a direct attribution of imports to the categories of domestic spending. However it were able to do so, it is likely that the growth rate in domestic production to meet these expenditures would have been higher than the unadjusted growth rate, particularly for investment spending which has a higher import elasticity.
The large fall in imports was broadly dispersed across consumption, capital and intermediate goods, and services.
Imports of consumption goods
Imports of consumption goods fell by nearly 20 per cent over the period, contributing 1.1 percentage points to GDP growth. While all categories of consumption good imports fell sharply, imports of 'non-industrial transport equipment' (that is, cars) fell by over 40 per cent, contributing 0.6 percentage points to GDP growth over the period.
Imports of intermediate goods
Imports of intermediate goods fell by around 14 per cent over the period, contributing 1.2 percentage points to GDP growth. While imports of some categories increased (fuel and lubricants, food and beverage for industry), many categories involving goods used as inputs to manufacturing processes fell sharply. These included processed industrial supplies and parts for transport equipment which contributed 0.4 and 0.3 percentage points to GDP growth respectively.
Imports of capital goods
Imports of capital goods fell 17.8 per cent in the period, contributing 0.8 percentage points to GDP growth. While many categories experienced significant declines, by far the largest was 'Industrial transport equipment', which fell by 44 per cent, adding 0.3 percentage points to GDP growth, with this being only partly offset by increased imports of telecommunication equipment and civil aircraft over the period.
Overall, three categories of transport equipment — 'non-industrial transport equipment', 'parts for transport equipment' and 'industrial transport equipment — explain over 40 per cent of the decline in imports of goods over this period.
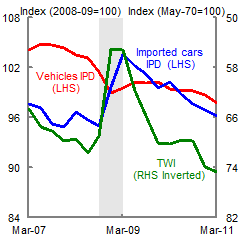
It appears unlikely that this sharp decline in imports of transport equipment can be attributed to the depreciation of the Australian dollar. While the fall in the exchange rate was clearly a key factor responsible for the rise in producer prices of imported cars over this period, there was no corresponding increase in consumer car prices (Chart 15).8
Chart 15: Exchange rate and car prices
(Quarterly)
Source: ABS cat. no. 5206.0, 5302.0 and RBA.
Chart 16: Composition of car market
Source: VFACTS.
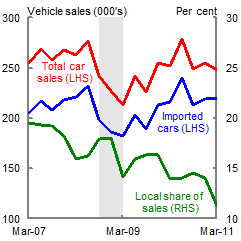
Rather, the sharp fall in demand for imported cars mirrored a more general fall in motor vehicle sales in Australia (and globally), reflecting the impact of confidence and liquidity effects, and the big increase in the risk premium, associated with the global downturn (Chart 16).9
While sales of imported cars fell by around 20 per cent over the period, sales of domestically produced cars fell by even more (over 30 per cent), contrary to what would be expected if the currency depreciation was driving the reduction in car imports. Indeed, the collapse in sales of imported cars did not spill demand to domestically produced cars as it would have had it been a relative price effect (from the sharply lower currency). The local share of sales fell over the three quarters, from around 16 per cent in the June quarter 2008 to a little over 14 per cent in the March quarter 2009.
More broadly acros
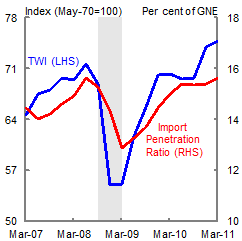
s the economy, the decline in the volume of imports is likely to largely reflect weaker domestic demand in the Australian economy (associated with contagion effects from the global downturn), along with a contribution from the improved competitiveness of domestically produced substitutes of imports due to the depreciation of the exchange rate (Chart 17).
Chart 17: Import penetration ratio
Source: ABS cat. no. 5206.0, RBA and Treasury.
Chart 18: New machinery and equipment
investment, and imports

Source: ABS cat. no. 5206 and 5302.0.
Note: The import penetration ratio is the volume of goods imports (excluding fuels and lubricants, civil aircraft, non-monetary gold and goods procured in ports by carriers) divided by the volume of gross national expenditure.
The pattern of decline in import volumes over this period broadly mirrors the pattern of domestic demand over this period, with the fall in business investment in machinery and equipment reflected in lower capital and intermediate imports (Chart 18).10
Imports of services fell by 17.2 per cent over the period, contributing 0.9 percentage points to GDP growth, reflecting significant falls in transport services (especially passenger services), travel services and other services. Over the same period, services import prices (as measured by the implicit price deflator) rose by 13.9 per cent, largely reflecting the impact of the depreciation of the exchange rate.
Inventories
In the classic business cycle, in the early stages of a downturn an unexpected slowdown in demand results in an involuntary increase in inventories, as firms produce more than required by consumers. In the next stage, firms reduce production by even more than the reduction in demand, drawing down on their stock of inventories. Where the reduction in production results in firms shedding labour, this then exacerbates the initial reduction in demand, resulting in a further increase in inventories and reduction in production.
One of the most volatile individual components of GDP over this period was the contribution of inventories. The September quarter 2008 saw an increase in inventories, contributing around 1.1 percentage point to GDP growth, before a sharp turnaround in inventories in the December quarter 2008 saw inventories detract 1.8 percentage points from GDP growth. While to this point the behaviour of inventories reflected the classic business cycle, a slight rebound in the March quarter contributed 0.1 percentage points to GDP growth. Over the three quarters, the change in inventories detracted around 0.7 percentage points from GDP growth, at least part of which would be offset by the reduction in import volumes over this period.
GDP deflator
Changes in the terms of trade during this period also affected the economy. The terms of trade increased in the September quarter 2008 but then declined by around 10 per cent in the next two quarters (and a further 10 per cent in the following two quarters). Real GDP does not measure the change in real purchasing power of the income generated by domestic production. Instead, the real purchasing power of income generated by domestic production is GDP adjusted for changes in the terms of trade, which is real gross domestic income. Growth in real gross domestic income was a percentage point lower than growth in real GDP in September quarter 2008 to March quarter 2009 (and a 1½ percentage point lower during the early stages of the recovery).
The effects of the sharp falls in the terms of trade were moderated by the sharp falls in the Australian dollar. The trade weighted index fell 25 per cent from peak to trough. Holding everything else constant, the fall in the dollar mechanically added about $16 billion to the Australian dollar value of key commodity exports during the critical three quarters.
The Australian economy: June quarter 2009, September quarter 2009, December quarter 2009
This section assesses the performance of the Australian economy over the three quarters covering the early stages of the global recovery: the June quarter 2009, September quarter 2009 and the December quarter 2009.
The Australian economy grew by around 1.8 per cent in the June quarter 2009, September quarter 2009 and December quarter 2009, an average of 0.6 per cent per quarter, or only a little below 'trend' or 'potential'.
The pattern of growth was much more even over this period, with growth of 0.4 per cent in the June quarter 2009 followed by growth of 0.7 per cent in both the September quarter 2009 and December quarter 2009.
This period saw a moderate recovery in the global economy, although progress was uneven, with strong growth in emerging economies (particularly China) over this period, but a weaker recovery elsewhere.
Industry contributions — GDP (P) components
The contribution of different sectors of the Australian economy was also more even during this period (Chart 19).
Production in the manufacturing sector started to recover, with the sector growing by 6.4 per cent in the period, contributing 0.5 per cent to economic growth. Output also picked up in the mining sector (ex-services), which grew by 4.2 per cent in the period, to contribute 0.4 per cent to growth as a whole. The largest contributor to economic growth in the period was the services sector (at 1.1 per cent), despite growing by a relatively modest 1.9 per cent. The agriculture sector detracted slightly from growth. Overall, the production measure of GDP rose by 2.0 per cent over the period.
Chart 19: Sectoral contributions to growth
(June qtr. 2009, September qtr. 2009, December qtr. 2009)

Source: ABS cat. no. 5206.0.
Expenditure contributions — GDP (E) components
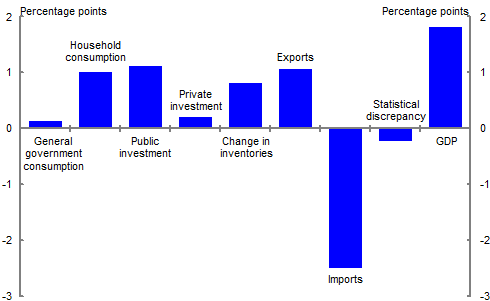
GDP growth was supported by solid household consumption growth, strong growth in stimulus-related public investment, inventory rebuilding, and a rise in exports, offset partly by a strong rise in imports (Chart 20).
Chart 20: Contribution to GDP growth
(June qtr. 2009, September qtr. 2009, December qtr. 2009)
Source: ABS cat. no. 5206.0 and Treasury.
Consumption
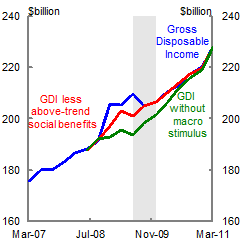
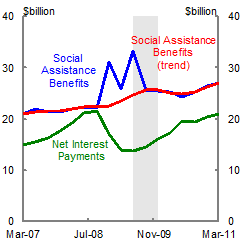
Household consumption contributed 1.1 per cent to GDP growth over this period. Household consumption in the June quarter 2009 was underpinned by the second round of the cash stimulus payments which boosted household incomes (Chart 21). The value of household financial assets rose by around $350 billion o
ver these three quarters, providing additional support for spending. Retail sales fell shortly after the period when the stimulus payments were made and the fall in household saving in the September 2009 (around $5½ billion) and December 2009 (around $1½ billion) quarters is consistent with the view that these payments would have continued to support the level of consumption over subsequent quarters. It is also consistent with international evidence (Agarwal et al., 2007). Household interest payments fell a little in the June quarter, but subsequently rose as credit growth picked up a little and interest rates were increased from October 2009 (Chart 22).
Chart 21: Impact of macro stimulus on
disposable income
Source: ABS cat. no. 5206.0 and Treasury.
Chart 22: Social assistance receipts and
(net) interest payments
Source: ABS cat. no. 5206.0.
Note: Gross disposable income (s.a.) is adjusted for the impact of macroeconomic policy stimulus by using the proxy of subtracting the difference between the value of the seasonally adjusted and trend measures of social assistance benefits and assuming that net interest payments were held constant at their June quarter 2008 level.
The direct effects of the stimulus were augmented by the early rise in consumer confidence, and increasing evidence that the deterioration in labour market conditions was likely to be less than expected. Although the unemployment rate rose, a substantial part of the labour market adjustment occurred through workers working fewer hours. By mid 2009, the unemployment rate had levelled off at under 6 per cent, and there was increasing confidence that, unlike in the US and Europe, the worst had passed. This is reflected in the broadly-based growth in household consumption.
Investment
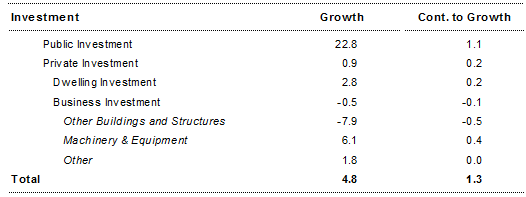
In real terms, investment rose by 4.8 per cent over the period, contributing 1.3 percentage points to GDP growth, with public investment contributing 1.1 percentage points and private investment contributing 0.2 percentage points (Table 3).
The contribution to growth from private investment during this period, while relatively modest, was substantially larger than the large detractions that had been factored into Treasury's forecasts in the 2009-10 Budget (Gruen and Stephan, 2010).
Table 3: Components of investment
(June qtr. 2009, September qtr. 2009, December qtr. 2009)
Source: ABS cat. no. 5206.0.
Public investment
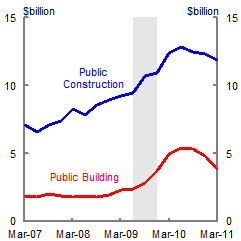
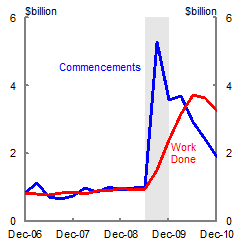
The dominant contributor to investment growth in the period was public investment, which grew by 22.8 per cent, and contributed 1.1 per cent of cumulative growth in the period, much of which was fiscal stimulus related. The BER program (parts of which are recorded as public investment spending and parts as private investment spending) picked up sharply in the latter part of the period, although the largest impact was during the first half of 2010 (Charts 23 and 24).
Chart 23: Public investment
Source: ABS cat. no. 8755.0.
Chart 24: Education investment
Source: ABS cat. no. 8752.0.
Dwelling investment
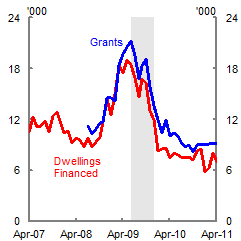
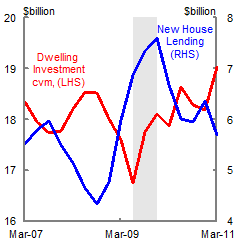
Dwelling construction grew by 2.8 per cent over the period, contributing 0.2 percentage points to GDP growth. The level of dwelling construction was supported over this period by the lift in the number of first home buyers, reflecting the temporary increase in the First Home Owners Grant as part of the fiscal stimulus (Chart 25). The continued provision of housing credit, higher house prices and lower interest rates would have also contributed to the solid performance of the dwelling construction sector over the period (Chart 26).
Chart 25: New home buyers
Source: ABS cat. no. 5609.0.
Chart 26: New housing finance
Source: ABS cat. no. 5206.0.
Business investment
Business investment fell over the period, as a sharp 7.9 per cent decline in investment in other buildings and structures was partly offset by a strong 6.1 per cent growth in business equipment in machinery and equipment (Chart 27).
A key question is whether the decline in private investment in other buildings and structures over this period reflected weaker market conditions or 'crowding out' by the surge in public investment. As always, the counterfactual is difficult to determine. Nevertheless, if public investment had indeed 'crowded out' private investment in the period, then it would be expected that the price of private investment in other buildings and structures would have risen — whereas in fact, it fell by around 2 per cent over the period, a result more consistent with weak demand in the sector as a whole. It is also worth recalling that there was considerable concern over this period over the availability of finance for commercial property developments.
The temporary investment allowance introduced as part of the fiscal stimulus appears to have been an important contributor to the recovery of machinery and equipment investment. In particular, other (light and commercial) vehicle sales jumped noticeably both in the June and December quarters of 2009, the cut-off quarters for eligibility for large and small businesses respectively (Chart 28). Of course, the response to the tax incentive would have been considerably more muted had business not been able to access credit over this period.
Chart 27: Business investment

Source: ABS cat. no. 5206.0.
Chart 28: Vehicle sales
(Monthly)

Source: ABS cat. no. 9314.0.
Net exports
Net exports detracted significantly from growth over the period, with the strong recovery of exports being more than offset by a surge in imports.
Exports
Exports grew 4.7 per cent in the period and made a solid contribution to growth (1.1 per cent). As with private investment, this was substantially stronger than the large detraction from growth that had been factored into Treasury's forecasts in the 2009-10 Budget.
A significant driver of the recovery of exports over this period was the surge in non-rural commodity exports to China. Exports of iron ore and coal to China contributed 0.8 percentage points to GDP growth over this period, supported by strong stimulus-related infrastructure spending; exports to other destinations were weak.
Elaborately transformed manufactures (ETM) exports picked up a little following their sharp decline over the previous period, as demand from Australia's major trading partners picked up ahead of the world economy as a whole. On the other hand, services exports fell by 3.8 per cent, as the exchange rate appreciated resulting in a significant increase in the foreign currency price of services exports in the period. Exports of rural goods also fell, reflecting lower production.
Imports
The volume of imports rose strongly over this period, recovering over half the sharp decline of the previous three quarters, detracting 2.5 percentage points from GDP growth. The recovery in imports — like the fall — was broadly dispersed among consumption, capital and intermediate goods and services.
The impact of the temporary business tax break is reflected in many of the categories of business imports. The three categories of transport equipment — 'non-industrial transport equipment,' 'parts for transport equipment' and 'industrial transport equipment'— grew by 55 per cent, 26.3 per cent and 34.4 per cent respectively, detracting 0.7 of a percentage point from GDP growth. Imports of automatic data processing equipment (that is, computers) grew by around 50 per cent in the period, to detract a further 0.3 per cent from GDP. Overall, this suggests that the business tax break contributed to both domestic output and imports in the period.
The appreciation of the exchange rate over this period would also have contributed to the recovery in imports. However, the variation in growth of different import categories in line with the pattern of domestic demand suggests that the recovery in domestic demand was probably the key influence.
Inventories
The early recovery of demand is evident in the recovery in inventories over the period with firms ramping up production in the face of an improved outlook. Over the three quarters, the change in inventories added 0.8 of a percentage point to GDP growth.
Conclusion
The analysis of the two key periods — covering the contraction in the global economy and the early stages of recovery — suggests that a combination of factors explain the extraordinary resilience of the Australian economy during this episode, albeit some were more important than others.
The strong performance of the Australian real economy during the three key quarters of the global contraction (September quarter 2008, December quarter 2008 and March quarter 2009) largely reflected the strength of the Australian financial system, the rapid deployment of fiscal stimulus measures, the first effects of a significant easing in monetary policy from October 2008 and a pickup in demand from China which partly offset weaker external demand elsewhere.
The Australian policy response appears to have been an important contributor to the outperformance of the Australian economy during the downturn. Measures to support the financial system were important in ensuring continued financial stability in Australia, allowing the flow of credit to households and businesses to continue (albeit at a slower pace). The rapid deployment of fiscal stimulus appears to have been effective in increasing domestic demand, with transfers in late 2008 and the first half of 2009 boosting household consumption and putting a floor under business and consumer confidence. The first effects of rapid and timely reductions in interest rates in Australia and the fiscal stimulus started to be reflected in increased household cash flow. Fiscal stimulus estimates imply that growth would have been negative for three consecutive quarters absent fiscal stimulus.
The performance of the Australian economy during the early stages of the global recovery reflected the shift in the structure of fiscal stimulus from transfers to direct expenditure measures, the impact of monetary policy easing on household consumption and business investment and the rapid recovery in Australia's major trading partners (particularly China).
More generally Australia's relatively good performance during both of the key periods was underpinned by the sound institutional and regulatory arrangements that were in place at the time of the crisis and the flexibility of Australia's product and labour markets following nearly three decades of reform.
In practice, it appears that the interaction between these different factors was also particularly important, as they operated in a mutually reinforcing manner to support confidence in the Australian economy during the global downturn and the early stages of the global recovery.
References
Freestone, O, Gaudry, D, Obeyesekere, A, and Sedgwick, M, 2011, 'The Household Sector in Australia', Economic Roundup, current edition.
Gruen, D, and Stephan, D, 2010, 'Forecasting in the Eye of the Storm', Economic Roundup, Issue 3, pp 29-49.
McDonald, T, and Morling, S, 2011, 'Reasons for Resilience: The Australian Economy & the Global Downturn Part 1', Economic Roundup, current edition.
Treasury, 1999, 'The Measurement of Saving in Australia', Economic Roundup, Spring edition.
Taylor, J, 2009, 'The Lack of an Empirical Rationale for a Revival of Discretionary Fiscal Policy', American Economic Review, Papers and Proceedings, 99(2), May 2009, pp 550-555.
1 The authors are from Domestic Economy Division and Macroeconomic Policy Division of the Australian Treasury. This article has benefited from comments and suggestions provided by David Gruen, Simon Duggan, Phil Garton and colleagues from Treasury's Domestic Economy Division and Macroeconomic Policy Division. Assistance was provided by Janelle Hanns, Alistair Peat, David Stephan, Alex Beames, Hien Tran, Jonathan Olrick, Deepika Patwardhan and Sarah Woods.
2 GDP is the average of three conceptually equivalent measures based on expenditure, income and production. The period of the global downturn saw a marked increase in the difference between these measures – referred to as the statistical discrepancy – with the production measure of GDP falling further and for longer over the initial period of the downturn. Over time, as additional data becomes available, the ABS will seek to reconcile these measures, effectively eliminating the statistical discrepancy. However, until this process is complete, interpretation of the performance of the Australian economy over this period should be tempered by the potential impact of data revisions.
3 There are difficulties measuring actual interest payments since some households may maintain interest payments at existing levels even as interest rates change, and the quarterly profile is typically based on indicators, so caution should be used in interpreting these data.
4 For an explanation of the method used by the Australian Bureau of Statistics to calculate a trend series during a period of large irregular movements in the data (as during the Government's intervention during the GFC) see http://www.abs.gov.au/AUSSTATS/abs@.nsf/Lookup/1350.0Feature+Article1Aug+2009
5 See Freestone et al. (2011) for a more detailed explanation of this point.
6 The main drivers in the large decline in public investment in this period were defence investment (down 38.3 per cent; accounting for around 60 per cent of the fall in public investment) and state and local general government investment (down 8.7 per cent; accounting for around 34 per cent of the fall in public investment).
7 Contribution to GDP growth was calculated using unpublished ABS trade data of exports to China. A 2008/09 price for each commodity was calculated using total volumes and values for that financial year. This price was used to then calculate a chain volume export number for each commodity. Seasonal adjustment was based on ABS Balance of Payments (catalogue number 5302.0) seasonal factors for the categories of metal ores and minerals applied to iron ore, and coal, coke and briquettes applied to thermal and metallurgical coal. GDP growth was sourced from the seasonally adjusted chain volume GDP series (catalogue number 5206.0). In 2009‑10, iron ore, metallurgical coal and thermal coal accounted for 63 per cent of Australia's goods exports to China. The trade of these three commodities to China accounted for 15 per cent of Australia's total goods exports.
8 Consumer car prices are proxied by the vehicles IPD from the National Accounts.
9 The Economist, reported Automotive News data showing that sales of cars and light trucks in the year to December 2008 fell by 35.5 per cent in the US, 16 per cent in France, nearly 50 per cent in Spain, and 22.3 per cent in Japan.
10 The change in the mix of GNE components explained about 0.4 percentage points of the decline in the import penetration ratio.