Tony McDonald and Steve Morling1
The Global Financial Crisis was followed by the deepest recession in the world economy since World War II. The Australian economy slowed, but did not fall into recession, performing better during this period than most other advanced economies on nearly all relevant indicators. This article documents the financial and economic developments during that episode and examines a range of factors that have been put forward for the relatively strong performance of the Australian economy.
Introduction
The Global Financial Crisis (GFC) was followed by the deepest recession in the world economy since World War II. The Australian economy performed better during this period than other advanced economies on nearly all relevant indicators. Financial conditions were stressed, but the financial system held up remarkably well; the economy slowed, but did not fall into recession; and while unemployment rose, it did so by far less than in many other advanced economies.
A range of factors have been put forward to explain the relatively strong performance of the Australian economy over this period. These include the strength and stability of the Australian financial system, the fiscal and monetary policy response, the flexibility of the exchange rate and the performance of our major trading partners, particularly China.
This article looks at each of these different factors and makes an assessment of the role that each may have played. It begins with a brief recap of the GFC and the subsequent global downturn, including a look at some of the key channels through which the shock was transmitted to the Australian economy. It then discusses a range of explanations that have been put forward for the Australian economy's resilience during this period. A more detailed analysis of the evolution of the economy during this period including, where possible, a quantitative assessment of the impact of the various factors described in this article, is provided in Part 2 of this paper (Morling and McDonald, 2011).
The global downturn
In the second half of 2008, the world economy experienced a severe financial and economic shock. The US sub-prime crisis of 2007 degenerated into the GFC: financial conditions deteriorated quickly, financial and real asset prices collapsed, and business and consumer confidence fell sharply. The world economy sharply changed course from a five-year period of above-trend growth to the deepest recession since World War II.2
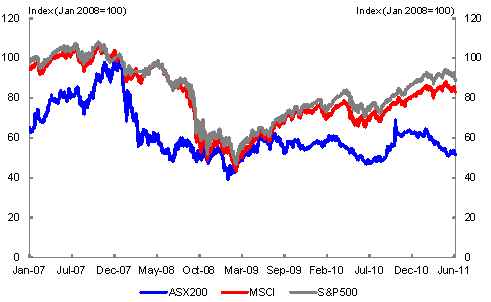
A key feature of the crisis was the sharp deterioration in global financial conditions, with global financial markets highly stressed and financial institutions coming under extreme pressure. Financial markets were extremely volatile, with equity prices falling precipitously at different stages under the weight of heightened uncertainty and risk aversion (Chart 1).
Chart 1: Equity prices
Source: Reuters.
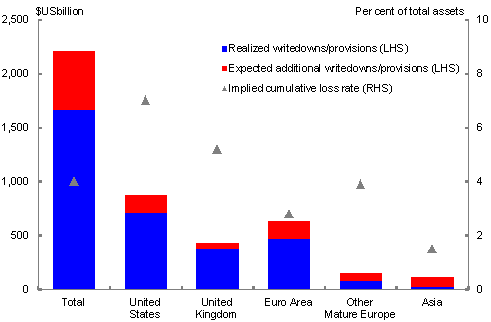
The crisis had a substantial impact on the solvency and liquidity of a significant number of financial institutions globally, causing share prices of banks to fall sharply, and some major financial institutions to collapse. Global bank writedowns and loss provisions are estimated to have exceeded $US2 trillion by the end of 2010, requiring significant recapitalisation of the banking sector including, in many advanced economies, a government injection of funds (Chart 2).
Chart 2: Bank writedowns or loss by region
Source: Global Financial Stability Report, International Monetary Fund (IMF).
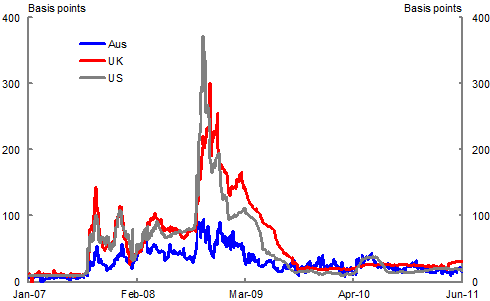
There was an extraordinary increase in the difference (spread) between the yields on short-term inter-bank instruments and the expected official cash rates, reflecting the collapse in confidence in the credit-worthiness of financial institutions and a huge increase in the perceived value of hoarding liquidity. From below 10 basis points before the onset of the sub-prime crisis in mid-2007, global inter-bank spreads increased sharply. This situation deteriorated dramatically following the onset of the GFC in September 2008, with spreads on bank instruments over the expected cash rate reaching nearly 400 basis points in the US, around 300 basis points in the UK, and nearly 100 basis points in Australia (Chart 3).
Chart 3: Interest rate spreads
Source: Reuters.
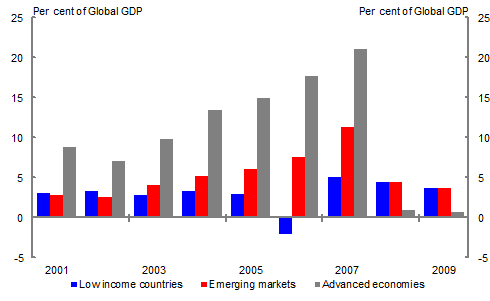
The crisis in the financial sector was also evident in the collapse of global capital inflows, particularly in advanced economies (Chart 4). After rising from around 6 per cent of global GDP in 2002 to 18 per cent of GDP in 2007, global capital inflows fell to around 2 per cent of global GDP in 2009. While this fall largely reflected developments in advanced economies, with gross capital inflows falling from 21 per cent of GDP in 2007 to around 0.7 per cent of global GDP in 2009, emerging market economies were also affected.
Chart 4: Global capital inflows
Source: IMF.
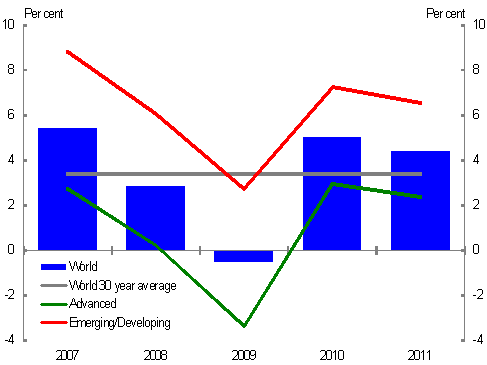
The deterioration in financial conditions was quickly followed by a sharp deterioration in economic conditions. World economic growth fell from over 5 per cent in 2006 and 2007 to -0.5 per cent in 2009 — the first contraction in the global economy since World War II (Chart 5) — with economic activity in advanced economies contracting by 3.4 per cent in 2009. While emerging and developing economies performed more strongly, growing by 2.8 per cent in 2009, there was still a large turnaround in their growth outcomes.
Chart 5: World economic growth (annual)
Source: IMF.
As stark as these annual growth figures are, they disguise the speed and extent of the decline in the second half of 2008. In through-the-year terms, world growth fell from 3.8 per cent in the June quarter 2008 to -2.8per cent in the March quarter 2009, a 6.6 percentage point turnaround.
The extent of the slowdown over this period was quite similar in the advanced and emerging economies. In through-the-year terms, advanced economy growth fell from 1.4 per cent in the June quarter 2008 to -5.0 per cent in the March quarter 2009, a 6.3 percentage point turnaround. While starting from a higher base, the turnaround in growth in emerging economies was even greater, falling from 7.7 per cent in the June quarter 2008 to 0.6 per cent in the March quarter 2009, a 7.1 percentage point turnaround.
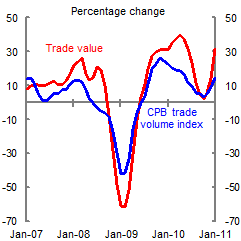
The global nature of the downturn was reflected starkly in its impact on world trade. The volume of world trade fell sharply, with trade in the three months to January 2009 in annualised terms around 40 per cent lower than the previous three months. The value of world trade fell by even more, reflecting a sharp decline in prices (Chart 6).
Chart 6: World trade
Source: IMF.
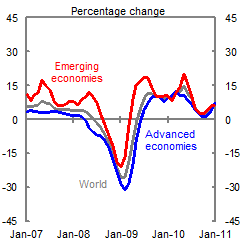
Chart 7: Industrial production
Source: IMF.
Note: Both charts are annualised per cent changes of three-month moving average over previous three-month moving average.
The pace of global industrial production growth slowed in the first half of 2008, from around 4 per cent at the end of 2007 to around ½ per cent in June 2008, reflecting a fall in advanced economy industrial production. In the second half of 2008 global industrial production contracted sharply in both emerging markets and advanced economies, falling by over 20 per cent in annualised terms in December 2008. However, while advanced economy industrial production continued to decline in the first half of 2009, it rebounded quickly in emerging markets (particularly emerging Asia), recording annualised growth of 17 per cent in the three months to June 2009 (Chart 7).
Impact on the Australian economy
The globally connected nature of financial markets meant that the shock in international markets was quickly felt in Australia. Financial asset prices declined sharply and accessing international capital became increasingly difficult. More broadly, business and consumer confidence fell, as did external demand, and domestic spending weakened.
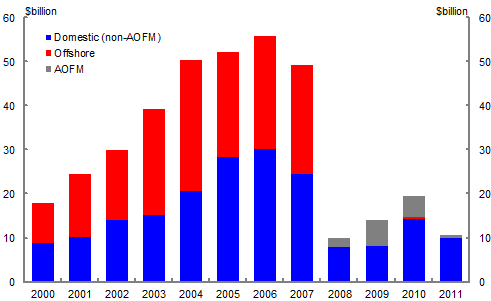
By November 2008 Australian equity prices had fallen by about 50 per cent from their peak a year earlier, and they fell further in early 2009. Australian equity markets fell further than US and global equity markets over this period. The collapse in international capital flows also meant that access to funding became more difficult. The most acute domestic example of this contagion was the cessation of issuances into the Australian Residential Mortgage-Backed Security (RMBS) market, despite the very low default rate on Australian mortgages (Chart 8).
Chart 8: RMBS issuance
Source: RBA.
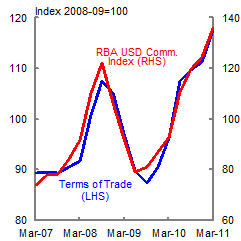
The weaker global economy also resulted in a reduction in demand for Australia's exports, with resulting falls in volumes and prices leading to subsequent falls in Australia's terms of trade, and the exchange rate. The terms of trade fell by around 10 per cent over the course of the December 2008 and March 2009 quarters, with further sharp falls in the June quarter 2009, largely reflecting movements in prices of our key commodity exports (Chart 9). The Australian dollar fell by around 10 per cent on a trade-weighted basis in the December 2008 and March 2009 quarters. In US dollar terms it fell from around 80 cents per US dollar to around 70 cents per US dollar over roughly the same period.
Chart 9: Terms of trade and commodity prices
Source: ABS Cat. No. 5302.0 and RBA.
Chart 10: Exchange rate

Source: Thomson Reuters.
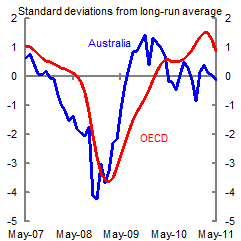
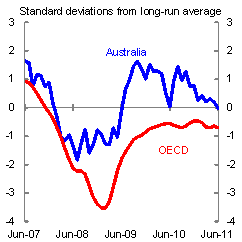
A key transmission mechanism of the GFC to the Australian economy was through its effect on confidence. By the end of 2008, business confidence had fallen dramatically and investment intentions had plummeted (Chart 11). Survey measures suggested that business conditions were at their lowest level since the 1990-91 recession. Consumer confidence had also fallen dramatically (Chart 12).
Chart 11: Business confidence
Source: National Australia Bank and OECD.
Chart 12: Consumer confidence
Source: Westpac-Melbourne Institute and OECD.
The Australian economy slowed under the weight of these global forces, but the slowdown was much more moderate than in most other advanced countries and the economy recovered more quickly.
Confidence recovered faster in Australia than in other OECD countries (Barrett, 2011). Business confidence started to recover from February 2009, following the announcement of the Nation Building and Jobs Plan and a further cut in the official cash rate. Consumer confidence rebounded sharply in June 2009 following the announcement of the March quarter 2009 GDP outcome, where the economy recorded solid positive growth, avoiding two consecutive quarters of falling real GDP (a so-called technical recession).
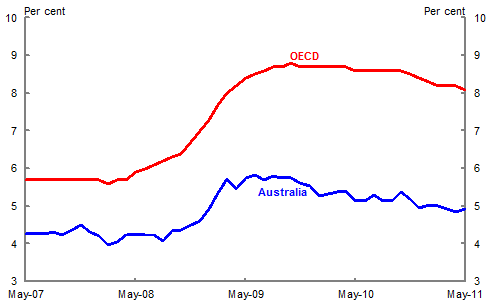
The rise in Australia's unemployment rate was much more muted than in other advanced economies, peaking at 5.8 per cent compared with the OECD average peak of 8.8 per cent (Chart 13).
Chart 13: Unemployment rate
Source: ABS cat. no. 6202.0 and OECD.
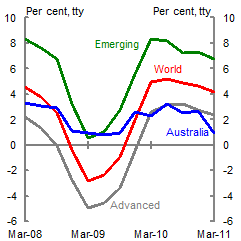
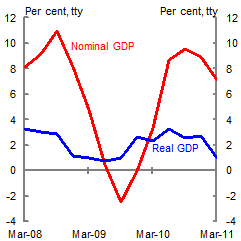
After falling sharply in the December quarter 2008, economic activity rebounded in the March quarter 2009 (Chart 14). The comparatively strong performance of the Australian economy was even more remarkable given the size of the shock to nominal incomes. Nominal GDP had been growing 8.1 per cent through the year to the March quarter 2008, but contracted by 2.5 per cent through the year to the September quarter 2009, driven in part by the large fall in the terms of trade (Chart 15).
Chart 14: Real GDP comparison
Source: IMF and ABS cat. no. 5206.0.
Chart 15: Nominal and real GDP growth
Source: ABS cat. no. 5206.0.
A more detailed analysis of the performance of the Australian economy during this period is provided in Part 2 of this article (Morling and McDonald, 2011).
Possible explanations for the Australian economy's resilience
Australia's resilience during the global downturn has been attributed to a range of factors. While there is some agreement that a number of mutually reinforcing factors likely contributed to this outcome, there is considerable disagreement about the extent to which the different factors, either individually or collectively, were important.
In some respects Australia's policy approach was similar to that of other advanced economies whose performance during the global downturn was significantly worse. A challenge in these circumstances is to explain why certain policies worked in Australia when they didn't seem to work as well elsewhere.
Financial system stability
A key factor underpinning the resilience of the Australian economy during this episode was the resilience of the Australian financial system. Australia's financial system was appropriately regulated and well supervised in the lead-up to the crisis, and the underlying strength of the system was buttressed at a key time by both the Reserve Bank of Australia and the Government.
In sharp contrast with many other advanced economies, no major Australian bank failed during the financial crisis. Australian banks remained profitable, and were able to access capital markets, enabling them to continue to lend (Edey, 2009). Australia and Canada were the only advanced G20 countries not to provide a Government injection of funds to the banking system.
A key factor behind the stability of the Australian financial system during the crisis was its strong state before the crisis. Unlike many banks in advanced economies, Australian banks had not built up large exposures to exotic tradeable securities that were responsible for the bulk of losses at banks in other advanced economies. In particular, 'Australian financial institutions had little exposure to complex structured instruments collateralised by US sub-prime mortgages' (Laker, 2009).
Australian banks were also much more circumspect in their use of special investment vehicles and other devices that sought to transfer assets and liabilities off balance sheet through 'shadow banking' type activity. Household credit growth in Australia was underpinned by rising incomes and employment rather than declining credit standards, with relatively few low-doc or no-deposit mortgages compared with the United States.
A key reason for the strong position of the Australian financial system entering the crisis was the effectiveness of financial regulations and regulators in the lead up to the crisis.
It is also striking that 'while all significant countries were operating on more or less the same minimum standards for bank supervision, some countries had serious financial crises, but many — in fact most — did not' (Stevens, 2010).
OECD analysis has found that banks in countries with stricter prudential regulation seemed to experience less of a run-up in share prices before the financial crisis but also less of a collapse afterwards with the net effect being positive overall (Ahrend et al., 2009).
However indicators of the level of financial regulation are an imperfect measure of the effectiveness of regulators and regulations. In particular, Australia and Canada had less 'strict' regulation than most other OECD countries and, as noted above, were among the few advanced economies whose banking systems did not require capital injection from the public sector. This highlights the importance of implementation.
Another explanation for the strong performance of the Australian and Canadian financial systems during the GFC is the restrictions on competition for corporate control in the banking sector in both countries (Macfarlane, 2009). Under this view, the effective protection from takeover or merger reduced the pressure on bank management to take bigger — and ultimately unsustainable — risks.
Nevertheless, it is clear that institutional and regulatory arrangements for the financial sector — following from both the implementation of the recommendations of the Wallis Inquiry and reforms following the collapse of HIH — were a key reason why the Australian financial system was better placed than those in many other advanced economies to cope with the global downturn.
Moreover, the sharp differences in experiences of countries with similar regulatory arrangements highlights the critical nature of supervisory practice and implementation, which in turn emphasizes the importance of the quality of financial regulators (Stevens, 2010). Australia's experience during the global downturn strongly suggests that it has 'benefited from years of rigid supervision by "better than world-class" financial regulators' (Henry, 2011).
F
inancial policy response
Despite the strong state of the Australian financial system in the lead up to the GFC, the extent of disruption in global financial markets, combined with actions of other countries, meant that Australian financial institutions' access to the wholesale funding needed to continue lending was sharply impaired.
Moreover, at the height of the GFC the sudden lack of liquidity in key financial markets — including short-term debt securities and foreign exchange markets — and the resultant greater volatility in markets, posed risks even for highly rated solvent institutions.
In this context, measures put in place to support the financial sector over this period were clearly important for maintaining financial system stability and growth (and employment) in the economy.
The Reserve Bank acted appropriately to ensure continued liquidity in the Australian banking system and foreign exchange markets. The range of securities accepted from authorised deposit-taking institutions (ADIs) as collateral for the RBA's Exchange Settlement facility was expanded and the RBA entered into a swap agreement with the US Federal Reserve to address the elevated pressures in US dollar short-term funding markets in the Asian time zone.
The Government put in place a range of other measures to support the financial sector, including providing government guarantees for deposits and for wholesale debt securities issued by ADIs, and directing the purchase by the AOFM of a substantial package of mortgage-backed securities.
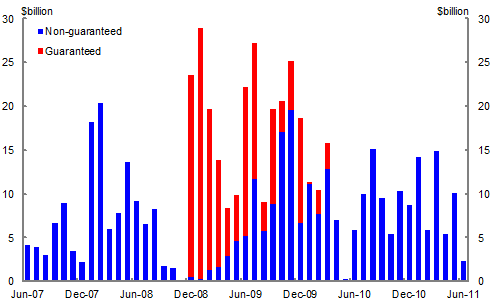
The option for banks to issue securities with a government guarantee (for a commercial fee) was important in maintaining the continued flow of funding to banks during the GFC (Chart 16).3 In turn, this supported the continued flow of credit to the economy, avoiding a potentially damaging credit squeeze.
Chart 16: Bank bond issuance
Source: RBA.
It is difficult to quantify the economic impact of maintaining the stability of the financial system during the GFC, but it was no doubt a key factor.
IMF research has found that recessions associated with financial crises are both more severe and last longer than 'typical' recessions (IMF 2009). Indeed, countries with weak banking systems, such as the United States and the United Kingdom, experienced severe downturns in economic activity during the crisis, although other factors are also likely to have been at work (Henry, 2011).
This suggests that the relative strength of the Australian financial system during the GFC is likely to have been a significant factor in the relatively strong performance of the Australian economy during the global downturn. Moreover, it is likely that the monetary policy response would have been considerably less effective had Australia's financial system succumbed to the crisis in the manner of many other advanced economies.
Of course, this relationship is not just in one direction. One reason for the continued strength of the financial system was likely to have been the resilience of the Australian economy (Laker, 2009).
Monetary policy
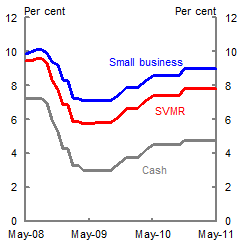
The Reserve Bank of Australia eased monetary policy significantly in response to the global downturn, with the official cash rate falling from 7.25 per cent at the start of September 2008 to 3 per cent in April 2009, a reduction of 425 basis points over seven Board meetings, with the bulk of this easing (375 basis points) occurring in the four Board meetings from October 2008 to February 2009 (Chart 17).
Importantly, the bulk of this easing in the official cash rate flowed through to lending rates. With most households and business loans in Australia being variable, monetary policy was rapidly translated to a change in household disposable income (muted somewhat by many households choosing to maintain their regular repayments).
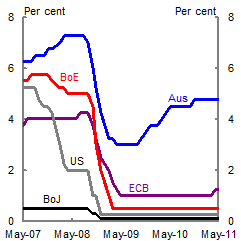
In contrast, in most advanced economies interest rates were already low at the start of the global downturn, leaving much less scope for monetary policy to respond (Chart 18 and 19).
Chart 17: Interest rates (Australia)
Source: RBA.
Chart 18: Interest rates (G7)
Source: RBA, Reuters.
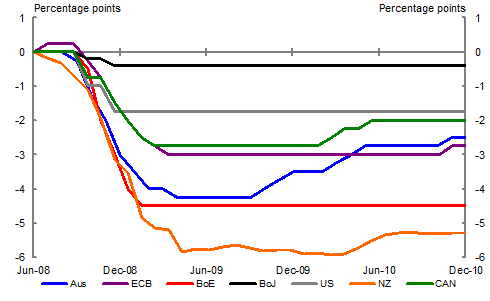
Of the major advanced economies, only the Bank of England reduced the official cash rate by as much as Australia, although the reduction was slightly slower at the start. New Zealand is one of the few countries which reduced interest rates sooner and to a greater extent than Australia (Chart 19). Different countries have different shares of fixed and variable rate mortgages and Australia benefits from a high share of floating rate mortgages. Under these conditions, changes in official cash rates are likely to flow through more quickly to changes in mortgage interest rates.
Chart 19: Reduction in Official Cash Rate from June 2008
Source: RBA, Reuters.
The impact of the sharp easing of monetary policy is difficult to quantify. Monetary policy works through a variety of transmission channels and typically affects the economy with 'long and variable lags'. A consistent research finding is that while some of the effects will be felt immediately, it can take around two years for the full effect of monetary policy decisions to be felt on the real economy.
Prior research undertaken by the RBA by Gruen, Romalis and Chandra, 1997, provides some broad guidance as to its likely impact during the downturn. Nominal bank lending interest rates fell by around 3.3 per cent and real rates fell by 2½ from September 2008 to April 2009. The RBA research suggests that a reduction of this magnitude would add about 0.85 percentage points to GDP growth in the first year. The effect could have been greater than this, as household debt levels were significantly higher in 2008-09 than over the period covered by the study. On the other hand, while interest rate reductions may have had a minor effect in the December quarter 2008 (particularly following the sharp cut of 100 basis points in October 2008), the bulk of the impact of interest rate reductions would have been progressively more marked over the course of 2009.
The extent to which monetary policy was able to support the economy may have been muted somewhat because of the nature
of the shock. Financial institutions became more cautious in extending credit during, and to a lesser degree, after the downturn, and business and consumers became more cautious in their borrowing and spending behaviour.
One intangible, but nonetheless important transmission channel for monetary policy is through effects on confidence. Business and consumer confidence plunged in the early part of the crisis, but they recovered earlier and much more strongly than in other countries. It is reasonable to assume that the sharp cuts in interest rates, and the early and substantial fiscal policy response, contributed to this rebound, reinforcing the direct first-round effects.
Movements in the Australian dollar
The impact of the global shock is likely to have been ameliorated somewhat by the sharp fall in the Australian dollar. The fall in the currency was partly due to the sharp reduction in Australian official interest rates, although this effect was muted somewhat by the cuts in interest rates in other countries, which saw the interest differential fall by less than the fall in official cash rates. More generally the sharp decline reflected a much weaker global outlook and expectations of a steep decline in Australia's terms of trade.
In July 2008 the Australian dollar was close to its post-float peak (74 on a TWI basis; 98 cents against the US dollar). By October 2008, the dollar had fallen to a low of around 55 on a TWI basis and around 65 cents against the US dollar.
The sharply lower Australian dollar buttressed the Australian economy, moderating the Australian dollar impact of sharply lower global prices for Australia's commodity exports, and improving the competitiveness of Australia's manufacturers and services exports, and import-competing industries. That said, the relatively short duration of the exchange rate trough, the volatility and the subsequent sharp reversal mean that the contribution to growth during the downturn, while positive, is likely to have been modest.
The exchange rate appreciated sharply during 2009 to be around 68 against the TWI or around 88 US cents against the US dollar by the end of September 2009 (an appreciation of around 35 per cent).
Fiscal policy
The role of fiscal policy during and since the downturn has been the subject of considerable discussion and debate. Australia entered the crisis in a stronger fiscal position — with a budget surplus and negative net debt — than most advanced economies. The additional flexibility and credibility this gave Australia's fiscal response to the crisis may have increased its effectiveness (Blanchard, 2010).
Australia's fiscal space gave the Government room to allow the automatic stabilisers to act and to put in place a substantial discretionary stimulus, while still maintaining a strong fiscal position.
Automatic stabilisers of the budget
A key element of the Government's Medium Term Fiscal Strategy is that the budget balance should be able to vary in the short term with economic conditions — that is, that the automatic stabilisers of the budget should be allowed to operate. The main channel of the automatic stabilisers during the global downturn was in a sharp downward revision to tax revenue.
The 2008-09 Budget forecast taxation receipts of $292.6 billion in 2008-09 and $310.1 billion in 2009-10. However the actual level of taxation receipts in 2008-09 was $272.6 billion ($20 billion, or 1.6 per cent of GDP lower than forecast) and the most recent estimate of taxation receipts for 2009-10 is $261.0 billion ($49 billion or 3.8 per cent of GDP lower than expected at the time of the 2008-09 Budget). Among other things, falling commodity prices due to lower global demand eroded revenue, contributing to the decline in tax receipts. Were the Government to have offset these variations it would have been contributing to, rather than leaning against, the macroeconomic instability arising out of the GFC.
Discretionary fiscal policy
From October 2008 to February 2009 the Australian Government announced significant fiscal stimulus packages. Further infrastructure initiatives were announced in the 2009-10 Budget.
In October 2008 the Government announced a $10.4 billion fiscal stimulus package in its Economic Security Strategy, largely comprising cash transfers to low and middle income earners. In November 2008 the Government announced a $15.2 billion COAG funding package, with funds to be delivered over a five year period, including a substantial amount in the first half of 2009. A further $4.7 billion stimulus was announced in the December 2008 Nation Building package. The $42 billion Nation Building and Jobs Plan announced in February 2009 included payments to low and middle income earners and investment in schools, housing, energy efficiency, community infrastructure, roads and support for small businesses.
Estimated impact of fiscal stimulus
In the 2009-10 Budget, Treasury published estimates of the economic impact of fiscal stimulus measures. These estimates were based on fiscal multipliers of 0.6 for transfer payments and 0.85 for direct government spending. Underpinning the transfer payment multiplier was an assumption that about 50 per cent of the fiscal stimulus would be spent during the first two quarters after receipt of payment with roughly another 20 per cent spent during rest of the forecast period.
As was acknowledged at the time, fiscal multipliers 'depend on a wide range of factors' and different studies provide estimates over a wide range. The multipliers used in the Treasury estimates are within the range estimated in major cross-country studies by the IMF and OECD, and are consistent with empirical evidence from the United States on spending out of temporary tax rebates (Johnson et al., 2006; Agarwal et al., 2007; Broda and Parker, 2008; Gruen, 2009b).
Importantly, the 2009-10 Budget papers argued that fiscal multipliers could vary with the economic cycle, noting that:
Where the economy is operating with a large amount of excess capacity, stimulus measures are expected to have a larger impact on activity. In contrast, where the economy is close to full employment, the multiplier would be close to zero as a result of exchange rate and price movements and the reaction of monetary policy.4
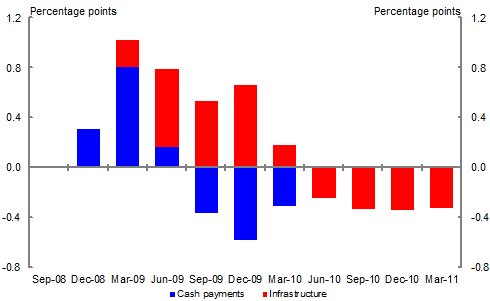
Overall, the fiscal stimulus was forecast to increase GDP growth by 2 percentage points in 2009 and to detract around 1 percentage point from growth in 2010. The most recent data suggest that the greatest impact was in the December 2008, March 2009 and June 2009 quarters (Chart 20). Fiscal stimulus estimates imply that growth would have been negative for three consecutive quarters absent fiscal stimulus.
Chart 20: Estimated contribution of discretionary fiscal policy to GDP growth
Source: Treasury.
These estimates have changed only slightly since then, due to data revisions and new information, with the underlying methodology remaining the same.5
Criticism of Australia's fiscal stimulus
Australia's fiscal stimulus was among the largest as a share of GDP among advanced economies, second only to South Korea. At the time, the OECD estimated that fiscal stimulus would have a larger impact on the level of GDP in 2009 in Australia (1.6 per cent) than in any other OECD country (the next highest was the United States at around 1¼ per cent) because of the timing, composi
tion and magnitude of Australia's fiscal stimulus (OECD, 2009a).
Nevertheless, critics of the importance of fiscal stimulus point out that some countries which had large fiscal packages (such as the United States) were among the worst performers during the global downturn, while some countries that had relatively small, or no, fiscal packages performed relatively strongly during the crisis (for example, Brazil, India and Indonesia).
One view is that fiscal transfers from Government to households have no impact on aggregate economic activity, with households looking through a temporary shock to the economy (McKibbin and Stoeckel, 2009). This assumes that most households are forward looking and not liquidity constrained.
A related argument is that rational households would save rather than spend the additional income from fiscal transfers (in the knowledge that they would have to pay higher taxes in the future as a result) (Taylor, 2009). Household saving did indeed rise during the downturn, but it is difficult to tell whether this was due to forward looking consumers anticipating higher taxes, or, as appears more likely, consumers becoming more cautious during a period of heightened uncertainty and in the face of increased international evidence of the risks associated with high levels of gearing. With the benefit of hindsight, it is also evident that the earlier long-run downward trend in household saving was not sustainable. Indeed, the saving rate had started to recover even before the financial crisis (Stevens, 2011; Freestone et al., 2011).
Another view is that the impact of fiscal stimulus would be fully offset by an appreciation of the exchange rate, this being the standard result in mainstream macroeconomic models of a unilateral fiscal shock, in a world with perfect capital mobility (see, for example, Makin, 2009; Makin, 2010b, Valentine, 2011). Of course, rather than appreciate, the exchange rate fell sharply during the downturn. That said, many countries undertook fiscal stimulus at roughly the same time, presumably muting some of the exchange rate offset; and the assumption of perfect capital mobility is difficult to sustain in a global financial crisis. Part 2 of this paper suggests that factors other than the decline in the exchange rate played an important role in the significant contribution of net exports to GDP growth. While much of the reduction in imports during this period was due to a sharp fall in car imports, import penetration of cars actually increased. That is, it was not the exchange rate spilling domestic demand from foreign production to domestic production, at least for this sector of the economy (Morling and McDonald, 2011).
The muted impact of the exchange rate on the fiscal stimulus is not surprising. The (negative) impact of the exchange rate on fiscal multipliers is significantly greater with countries with larger trade shares (Ilzetski et al., 2009). As Australia has a relatively low trade share compared with other advanced economies, fiscal policy could be expected to be relatively more effective (Gruen, 2009b).There have been suggestions that, to the extent that fiscal stimulus was effective in adding to demand, this task could have been achieved at least as effectively and more efficiently by monetary policy (through lower interest rates). Standard estimates of the transmission lags of monetary policy imply that additional monetary stimulus alone could not have had an effect quickly enough to mitigate the need for a quick and substantial fiscal response. In addition, the potential transmission difficulties of monetary policy during a financial crisis suggest that the effect could have been smaller than standard estimates imply.
International financial institutions have strongly endorsed the effectiveness of Australia's fiscal stimulus response to the GFC.
The IMF commended the 'quick implementation of targeted and temporary fiscal stimulus', considering that it provided a sizeable boost to domestic demand in 2009 and 2010 (IMF, 2009). IMF modelling suggested that stimulus would raise real GDP by 3 per cent in both 2009 and 2010 before dissipating in later years (Hunt, 2009).
Similarly, the OECD concluded that Australia's fiscal stimulus package 'was among the most effective in the OECD' and not only 'helped to avoid a recession as usually defined' but also that it 'had a pivotal role in boosting overall confidence' (OECD, 2010). The OECD attribute the effectiveness of the stimulus to both the size of the measures and the speed with which it was introduced (OECD, 2010b).
Performance of major trading partners (including China)
While Australia's major trading partners were affected by the global downturn, they recovered more quickly than the world economy as a whole (and advanced economies in particular) in the first half of 2009 (Chart 21). This was particularly evident in China. While official quarterly estimates of GDP are not published by Chinese authorities, Treasury estimates that growth fell from around 2 per cent in the September quarter 2008 to be broadly flat in the December quarter 2008, before rebounding in the March quarter 2009.
Chart 21: Major trading partner GDP growth
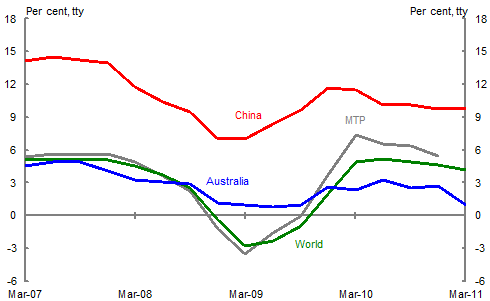
Note: MTP growth is calculated using export trade weights.
Source: Treasury, IMF.
Over the past decade the large emerging and developing economies in Asia have become an increasingly important destination for Australia's merchandise exports. Australia's greater exposure to the fast growing Asian region than other advanced economies has been cited as an important factor underpinning its strong performance during the crisis (see Treasury 2009). The relatively early recovery of demand from Australia's major trading partners will have contributed to Australia's stronger performance during the global downturn.
Australian commodity exporters have traditionally been price takers — with the volume of exports reflecting the productive capacity, and fluctuations in demand being reflected primarily in variations in export prices. However the collapse in global demand in late 2008 was sufficient to have a significant impact on the volume, as well as price of Australia's commodity exports — particularly those (such as iron ore and coal) where Australia has a large share of global trade.
However, while global demand for Australia's commodity exports declined, the fall was not as steep as would have been the case without strong demand from China.
A key reason for the early recovery of demand in China was substantial and rapid monetary and fiscal stimulus (McKissack and Xu, 2011). Nevertheless some have argued that the strength of demand from Australia's major trading partners, particularly China, is a competing — rather than complementary — factor with the importance of fiscal stimulus, in explaining the resilience of the Australian economy over this period (Day, 2011). The estimated contribution to growth from China's demand for Australia's key commodity exports during the downturn — reported in Part II of this paper — does not support this argument. While demand from China provided considerable support the economy during this period, it was not the only factor, nor the main factor, underpinning the resilience of the Australian economy.
Structure of the Australian economy
The global downturn affected the volume of trade across products unevenly, with trade in consumer non-durables affected least and capital and consumer durable products most affected by the global downturn (IMF, 2010a).
A possible contributor to the resilience of the Australian economy during the crisis is that it has
a relatively small manufacturing sector — and a relatively large commodity sector — compared with the OECD average (Chart 22).
Chart 22: Sectoral composition (Australia and OECD average)
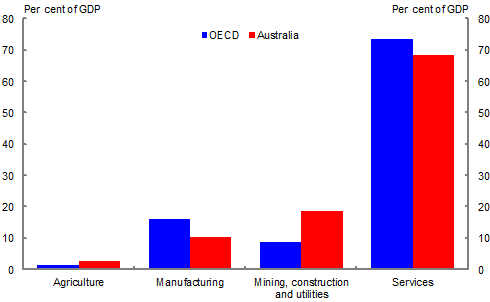
Note: The World Bank provides data on the proportion of the economy added by three sectors: agriculture, industry and services. The share of manufacturing (a subset of the industry sector) is also provided, with the residual of the industry sector comprising mining, construction and electricity, gas and water supply.
Source: World Bank and Treasury.
The global shock appeared to fall heavily on the manufacturing and related sectors, so having a relatively smaller proportion of activity concentrated in those sectors could help explain Australia's relatively strong performance during the global downturn (Black and Cusbert, 2010). Chart 23 compares quarterly growth in industry gross value added in Australia with what it would have been if Australia had the same industry structure as the OECD average. While Australia's industry structure helped to limit the impact of the global downturn, the performance within industries was a more important factor.
Chart 23: Impact of Sectoral Composition on GDP growth
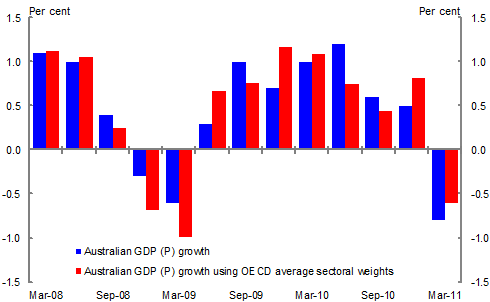
Note: Actual GDP(P) growth by sector in Australia is aggregated using the OECD average sectoral weights to estimate what GDP(P) growth would have been in Australia had its industrial structure been the same as the OECD average in 2008.
Source: ABS cat. no. 5206, World Bank and Treasury.
In estimating the relative importance of this factor it should be noted that services represents around two-thirds of the Australian economy, about the same proportion as for advanced economies as a whole.
Flexibility of markets
The market-based reforms of the past thirty years have combined to transform Australia's economy from being an insular and inflexible one, to one that is much more open and dynamic. There is little doubt that — taken as a whole — these reforms have contributed to the improved resilience of the Australian economy to external shocks (see, for example, Gruen, 2006). What is less clear-cut is whether this means that Australia was better placed than other countries to withstand the global downturn.
OECD empirical evidence finds conflicting effects of structural policy settings on resilience. While the initial impact of a common negative shock is almost twice as large in countries with relatively flexible labour and product markets than in counterparts with more stringent regulation, the cumulative output loss is lower in less regulated countries (OECD, 2010a).
Product market flexibility
While Australia has significantly more competitive product markets now than a quarter of a century ago, so do most other OECD countries, with Australia around the OECD median for the OECD's product market regulation indicator (OECD, 2009b; Wolfl et al., 2009). So this is unlikely to be a relevant factor in explaining Australia's relative outperformance of OECD countries during the global downturn.
Labour market flexibility
Australia also has a more flexible labour market today than it did in previous shocks. It can be argued that a more flexible labour market results in a lower increase in the unemployment rate, as the adjustment from a reduction in labour demand need not occur just through a lower number of people employed, but also through lower hours worked per employee, and/or greater multi-tasking of employees or lower wage growth.6
However, it can also be argued that increased labour market flexibility results in a sharper increase in the unemployment rate in an extended downturn, as employers find it easier to reduce their number of employees, with the effect of prolonging the downturn.
One — albeit imperfect — proxy for labour market flexibility is the OECD indicator of Employment Protection Legislation (EPL). A comparison of the EPL indicator prior to the global downturn with the change in the unemployment rate between 2007 and 2009 highlights this ambiguity. Australia had a relatively low EPL before the global downturn and a relatively low increase in the unemployment rate. On the other hand, the United States which had the lowest EPL of the OECD had among the highest increases in the unemployment rate. This highlights the importance of the rapid restoration of confidence in the economy and financial system in economies with relatively flexible labour markets.
Population growth
Demand in the Australian economy during the downturn is likely to have been supported by continued strong population growth. In the context of a negative global demand shock, strong population growth helps to reduce excess capacity by filling in the demand gap. As population rises, demand for goods and services rises irrespective of whether people are actually in employment (that is, irrespective of whether the supply-side expands).
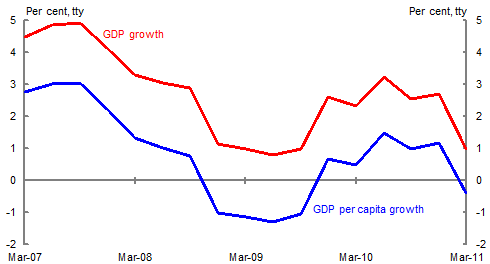
Australia recorded population growth of over 2 per cent through the year to December 2008, well above the average of other advanced economies. Population growth added close to 1.6 percentage points to cumulative GDP growth over the September quarter 2008, December quarter 2008 and March quarter 2009 — the three quarters of global contraction — and a further 1.3 percentage points over the subsequent three quarters.
Thus, while Australian real GDP held up during the global downturn, in per capita terms it fell (Chart 24).
Chart 24: Real GDP and GDP per capita growth
Source: ABS cat. no. 5206.0.
Conclusion
This paper has presented a range of possible explanations for the strong performance of the Australian economy during the GFC. The conclusion, unsurprisingly, is that a number of mutually reinforcing factors helped Australia outperform other advanced economies during the downturn, albeit some more important than others.
In particular, the Australian policy response appears to have been an important contributor to the outperformance of the Australian economy during the downturn.
Rapid and large monetary and fiscal policy stimulus played a critical role in increasing effective demand and the early recovery of consumer and business confidence in Australia. The strength of Government's fiscal position meant that it was well placed to undertake an appropriate fiscal policy response to these developments. Fiscal stimulus estimates imply that growth would have been negative for three consecutive quarters absent fiscal stimulus.
Measures to support the financial system were important in ensuring continued financial stability in Australia, allowing the flow of credit to households and businesses to continue (albeit at a slower pace).
It is also clear that improved policy and institutional arrangements in Australia following a quarter century of reforms have made the Australian economy much more resilien
t to external shocks.
The regulatory framework for the financial system, implemented by high quality regulatory institutions, helped Australia avoid the excesses that resulted from lax or ineffective prudential regulation in many other advanced economies.
More competitive and flexible product and capital markets — along with the weakness in domestic demand — meant that the sharp depreciation in the exchange rate helped cushion the impact of the downturn on the real economy, rather than simply resulting in higher prices and wages.
The Australian economy also benefited from the relatively early, and strong, recovery in growth in most of our major trading partners throughout 2009, which in turn was driven by substantial macroeconomic policy stimulus in those countries.
Australia's relatively strong performance would have been assisted by its industrial structure, with a relatively low share of the sectors hardest hit by the downturn compared with most other advanced economies.
In practice, these explanations complement one another, with the combination of factors — both institutional and policy — working together to support the economy.
Part 2 of this article looks in detail at the evolution of the components of output during the key quarters of the downturn, providing supporting evidence for some of the arguments presented above (Morling and McDonald, 2011).
References
Agarwal, S, Liu, C, and Souleles, NS, 2007, 'The Reaction of Consumer Spending and Debt to Tax Rebates — Evidence from Consumer Credit Data', Journal of Political Economy, vol. 115, no. 6, pp 986-1018.
Ahrend, R, Arnold, J, and Murtin, F, 2009, 'Prudential Regulation and Competition in Financial Markets', OECD Economics Department Working Papers, No. 735.
Barrett, C, 2011, 'Australia and the Great Recession', Woodrow Wilson International Center for Scholars, Washington DC.
<http://www.wilsoncenter.net/events/docs/Australia%20and%20the%20Great%20Recession.pdf.>
Black, S, and Cusbert, T, 2010, 'Durable Goods and the Business Cycle', Bulletin, September quarter 2010, pp 11-18, RBA, Sydney.
Blanchard, O, Dell'Ariccia, G, and Mauro, P, 2010,'Rethinking Macroeconomic Policy', IMF Staff Position Note, SPN/10/03, IMF, Washington DC.
Broda, C, and Parker, JA, 2008, 'The Impact of the 2008 Tax Rebates on Consumer Spending: Preliminary Evidence', Working Paper, University of Chicago Graduate School of Business. <http://faculty.chicagogsb.edu/christian.broda/>.
Day, C, 2011, 'China's Fiscal Stimulus and the Recession Australia Never Had: Is a Growth Slowdown Now Inevitable?', Agenda, vol. 18, no. 1, pp 23-34.
Edey, M, 2009, 'Financial System Developments in Australia and Abroad', RBA Bulletin, September 2009, pp 26-34.
Freestone, O, Gaudry, D, Obeyesekere, A, and Sedgwick, M, 2011, 'The Household Sector in Australia', Economic Roundup, current edition.
Gruen, D, Romalis, J, and Chandra, N, 1997, 'The Lags of Monetary Policy', RBA Research Discussion Paper, No 97-01, Sydney.
Gruen, D, 2006, 'A Tale of Two Terms-of-Trade Booms', Economic Roundup, Summer, pp 1-10.
Gruen, D, 2009a, 'Reflections on the Global Financial Crisis', Address to the Sydney Institute, Economic Roundup, Issue 2, pp 51-65.
Gruen, D, 2009b, 'The Return of Fiscal Policy', Address to the Australian Business Economists Annual Forecasting Conference 2009, 8 December, http://www.treasury.gov.au/contentitem.asp?NavId=008&ContentID=1686
Gruen, D, and Clark, C, 2009, 'What Have We Learnt? The Great Depression in Australia from the Perspective of Today', The 19th Annual Colin Clark Memorial Lecture, Economic Roundup, Issue 4, pp 27-50.
Henry, K, 2011, 'The Australian Banking System — Challenges in the Post Global Financial Crisis Environment', Address to the Australasian Finance and Banking Conference, Economic Roundup, Issue 1, pp 13-26.
Hunt, B, 2009, 'The Effectiveness of Fiscal Stimulus Measures', Australia: Selected Issues, August, IMF, Washington DC.
Ilzetski, E, Mendoza, EG, and Vegh, CA, 2009, 'How big are fiscal multipliers?', Centre for Economic Policy Research, Policy Insight, no. 39.
IMF, 2009a, World Economic Outlook, April, IMF, Washington DC.
IMF, 2009b, Australia Article IV Staff Report, August, IMF Country Report No 09/248, Washington DC.
IMF, 2010a, 'The Fund's Role Regarding Cross-Border Capital Flows', IMF Policy Paper, 15 November, IMF, Washington DC.
http://www.imf.org/external/np/pp/eng/2010/111510.pdf
IMF, 2010b, Global Financial Stability Report, October, IMF, Washington DC.
Laker, J, 2009, 'The Global Financial Crisis — Lessons for the Australian Financial System', Address to the Australian Economic Forum, 19 August 2009.
http://www.apra.gov.au/Speeches/upload/03-Aust-Economic-Forum-Opening-Remarks-19-Aug-09.pdf
Johnson, D, Parker, J, and Souleles, N, 2006, 'Household Expenditure and the Income Tax Rebates of 2001', The American Economic Review, vol. 96, No. 5, pp 1589-1610.
Macfarlane, I, 2009, 'The crisis: causes, consequences and lessons for the future: The Australian perspective', ASIC Summer School 2009 Report, pp 41-46.
McKibbin, W, and Stoeckel, A, 2009, 'Modelling the Global Financial Crisis', Oxford Review of Economic Policy, vol. 25 (4), pp 581-607.
McKissack, A, and Xu, J, 'Chinese Macroeconomic Management Through the Crisis and Beyond', Asian-Pacific Economic Literature, vol. 25, issue 1, pp 43-55.
Makin, A, 2009, 'Fiscal 'Stimulus': A Loanable Funds Critique', Agenda, vol. 16, no. 4, pp 25-34.
Makin, A, 2010a, 'Did Fiscal Stimulus Counter Recession? Evidence from the National Accounts' Agenda, vol. 17, no. 2, pp 5-16.
Makin, A, 2010b, 'How Should Macroeconomic Policy Respond to Foreign Financial Crises?' Economic Papers, vol. 29, no. 2, pp 1-10.
Morling, S, and McDonald, T 2011, 'The Australian Economy and the Global Downturn Part 2: The Key Quarters', Economic Roundup, current issue.
OECD, 2009a, Interim Economic Outlook, Chapter 3: The Effectiveness and Scope of Fiscal Stimulus, OECD, Paris.
OECD, 2009b, Going for Growth, Chapter 7, 'Reform of Product Market Regulation in OECD Countries: 1998 — 2008, OECD, Paris.
OECD, 2010a, Going for Growth, OECD, Paris.
OECD, 2010b, OECD Economic Surveys: Australia, November 2010, OECD, Paris.
Stevens, G, 2010, 'The Role of Finance', The Shann Memorial Lecture, RBA Bulletin, September quarter 2010, pp 77-87.
Stevens, G, 2011, 'The Cautious Consumer', Address to the Anika Foundation Luncheon, 26 July, http://www.rba.gov.au/speeches/2011/sp-gov-260711.html
Taylor, J, 2009, 'The Lack of an Empirical Rationale for a Revival of Discretionary Fiscal Policy', American Economic Review, Papers and Proceedings, 99(2), May 2009, pp 550-555.
Treasury, 2009, Treasury Briefing Paper for the Senate Inquiry into the Economic Stimulus Package, available at:
www.aph.gov.au/senate/committee/economics_ctte/eco_stimulus_09
Valentine, T, 2011, 'An Accelerator Tied to a Brake: Fiscal Stimulus Under a Floating Exchange Rate', Agenda, vol. 18, no. 1, pp 35-40.
Wolfl, A, Wanner, I, Kozluk, T, and Nicoletti, G, 2009, Ten Years of Product Market Reform in OECD Countries: Insights from a Revised PMR Indicator, OECD Economics Department Working Papers, No. 695, OECD, Paris.
1 The authors are from Macroeconomic Policy Division and Domestic Economy Division, the Australian Treasury. This article has benefited from comments and suggestions provided by David Gruen, Simon Duggan, Phil Garton and other colleagues from the Domestic Economy Division and Macroeconomic Policy Division of Treasury. Assistance was provided by Alistair Peat, Janelle Hanns, David Stephan, Deepika Patwardhan, Jonathan Olrick and Sarah Woods.
2 See Gruen (2009a) for a more detailed explanation of these events.
3 As at 30 April 2011, cumulative fee revenue received under the Guarantee Scheme had reached $2.7 billion.
4 Page 4-6, 2009-10 Budget Paper No. 1.
5 Further detail on these calculations is provided in Treasury (2009).
6 Through-the-year growth in the Wage Price Index fell from around 4 ¼ per cent in the June quarter 2008 to a little below 3 per cent in the December quarter 2009, before recovering to around 3 ¾ per cent in the March quarter 2011. This decline was particularly stark in the private sector, from around 4.4 per cent in June quarter 2008 to 2.6 per cent in the December quarter 2009, the lowest growth rate since the series began in 1997.