Audrey E Pulo1
This article examines the government tax expenditures related to owner-occupied housing, particularly as they compare to non-owner-occupied housing, and discusses the issues involved in modelling and analysing these expenditures. The approach used considers various aspects of owner-occupied housing, including capital gains, imputed rent, interest deductions, capital works deductions and miscellaneous deductions.
Introduction
This article examines the government tax expenditures related to owner-occupied housing, particularly as they compare to non-owner-occupied housing, and discusses the issues involved in modelling and analysing these expenditures. It is generally accepted that the indirect housing assistance provided to owner-occupiers is a significant component of total Australian Government tax expenditures, which is the key motivation for this study.
The capital gains tax main residence exemption has for the first time been reported2 in the 2009 annual Tax Expenditures Statement (TES) and is estimated to be around $14 billion in the 2009-10 financial year.3 Although the complexity and sensitivity make it difficult to estimate the indirect housing tax expenditures, modelling these expenditures with the purpose of quantifying them is nevertheless important in guiding and evaluating policy decisions in this area.
Indirect housing assistance for owner-occupiers
Tax concessions for owner-occupied housing fall into two broad categories, those relating to capital gains and those relating to income tax.
The main residence exemption from capital gains tax (CGT) means that the capital gains of owner-occupied dwellings may be tax-free.4 This is effectively a 100 per cent CGT discount. However, the CGT discount for individuals (currently at 50 per cent) means that even in the absence of the main residence exemption, owner-occupiers would only be liable for tax on the discounted capital gain of the dwelling, not the full capital gain.5
As owner-occupiers do not pay rent, the consumption of owner-occupied housing is not subject to income tax considerations. The owner-occupier’s notional imputed rent income is not taxable. If the owner-occupied dwelling was instead rented to someone other than the owner-occupier, the rental income would be taxed at the owner’s marginal tax rate. By effectively renting their dwelling to themselves, the owner-occupier avoids paying tax on the imputed rent they would be paying to themselves. Currently in Australia imputed rent is not taxed,6 and expenses related to earning imputed rent and capital gain, such as mortgage interest payments, are not deductible by owner-occupiers.7
Most countries in the OECD do not tax capital gains on principal residences, with the main exceptions being Japan and the United States (OECD 2006). The United States allow for home mortgage interest deductions, while maintaining the tax free status of imputed rent. Countries such as the Netherlands and Switzerland tax imputed rent, but allow for mortgage interest deductions as expenses that are necessary to ‘earn’ the imputed rent. The standard justification for allowing mortgage deductibility is to encourage home ownership.
Benchmark considerations and tax expenditures
Tax expenditures are one method of estimating the impact of taxation policies, and are reported extensively in the TES, under the Charter of Budget Honesty Act 1998. They measure the assistance provided to taxpayers due to the various tax concessions, relative to a benchmark. As such, they can only be interpreted with respect to that particular benchmark, and furthermore, they are not necessarily indicative of the expected tax revenues from changes to the policy. This is because they do not take into account the effects of taxpayer behavioural responses that arise from changes in policy. Thus, the choice of a suitable benchmark is an important aspect of determining tax expenditures and can be a difficult exercise.
Tenure and tax neutral benchmarks
Two useful concepts used in the literature for guiding housing benchmark design are tenure neutrality and tax neutrality (Flood and Yates 1987, 1989). These go beyond the typical benchmark approach of simply considering a taxation system in which the concessions are completely removed. A tenure neutral benchmark ensures that all owners (and consumers) of housing receive the same tax treatment, irrespective of their status as owner-occupiers or otherwise. A tax neutral benchmark ensures that the tax treatment of housing investments is the same as other non-housing investments, for example, shares or savings, and the tax treatment of housing consumption is the same as other non-housing consumption.
Tenure neutral benchmarks have the advantage of allowing the impact of concessions afforded to a tenure group to be directly assessed, relative to the situation where no tenure type is advantaged over any other. The tenure neutral benchmark also has the advantage of being more flexible to policy environments that change over time, since it is primarily concerned with maintaining identical treatments of tenures. This makes tenure neutrality a particularly useful construct for evaluating the tax expenditures on owner-occupied housing in the context of all types of housing, and as such it forms the basis of the benchmarks used in this study.
Tax neutral benchmarks are best suited to evaluating the impact of expenditures on concessions in the housing market, relative to other areas of the economy. For example, to determine the impact of the main residence CGT exemption compared to investment in the share market or in commercial property. This is useful when considering investment in rental housing, since these investors are also free to instead utilise other forms of investment. However owner-occupied housing, which forms approximately two-thirds of all Australian households,8 is often chosen for reasons beside pure financial investment, such as housing stability, security of tenure and the prospect of ‘free’ housing consumption once the dwelling is owned outright. Thus, a tax neutral benchmark is less appropriate for this study, although tax neutrality is still useful as a guiding principle.
For the purpose of this study three different benchmarks are considered against which the tax expenditures for owner-occupied housing are measured and analysed.
Investor benchmark
The first benchmark considered in this article is the tax treatment afforded to individuals who are producing and consuming non-owner-occupied housing, that is, the situation involving investors and renters. This investor benchmark formalises the notion that owner-occupiers are simultaneously both producers of housing (through their ownership of the dwelling) and consumers of housing (through their residence in the dwelling). Using this benchmark the owner-occupier may be considered to be two separate entities, a housing producer (landlord) and housing consumer (tenant).
The rationale behind using this tax benchmark in analysing the tax expenditure is the inherently equitable nature of a tenure-neutral treatment. By treating owner-occupiers and other consumers of housing in the same manner, it is ensured that all consumers of housing are subjected to the same tax treatment. This allows meaningful evaluations of the tax concessions afforded to one group compared to the other.
There are three main features of this benchmark.
- The capital gain on owner-occupied housing is subject to the 50 per cent CGT discount for individuals (or the indexation method of assessing capita
l gains for properties acquired before 21 September 1999). - Since the owner-occupier-as-tenant and the owner-occupier-as-landlord are considered separately, imputed rent is treated identically to ordinary rental income — that is, it is taxed at the owner-occupier's marginal income tax rate.
- Since imputed rent is deemed to be taxable for this benchmark, expenses incurred in generating that rental income can also be claimed as deductions. This includes the provision for the negative gearing of owner-occupied housing, where these deductions exceed the imputed rental income and can then be used to offset any assessable income. The main source of deductible expenditure, for income tax purposes, is the interest on mortgage repayments. Other deductions may include, for example, capital works deductions for major capital improvements. However, the amounts claimed in such deductions cannot then be included in reducing the cost base of the property for capital gains purposes.
Table 1 presents the tax expenditure estimates against the investor benchmark that were modelled in this study. Years 2005-06 to 2007-08 are based on historical data from a variety of sources, and years 2008-09 onwards are forward projections based on assumptions that are consistent with historical rates. An overview of the methodology used to obtain these estimates is presented in Appendix A.
| 2005-06 $m |
2006-06 $m |
2007-08 $m |
2008-09 $m |
2009-10 $m |
2010-11 $m |
2011-12 $m |
2012-13 $m |
|
|---|---|---|---|---|---|---|---|---|
| Tax | ||||||||
| 1 Tax on Capital Gains | 39,500 | 38,500 | 40,000 | 31,000 | 31,500 | 31,500 | 31,000 | 30,000 |
| 2 Tax on Imputed Rent | 19,000 | 19,500 | 21,000 | 22,500 | 23,500 | 24,500 | 26,500 | 27,500 |
| Sub-Total | 58,500 | 58,000 | 61,000 | 53,500 | 55,000 | 56,000 | 57,500 | 57,500 |
| Less Offsets | ||||||||
| 3 50% discount on capital gains |
-22,000 | -21,500 | -22,000 | -17,000 | -17,000 | -17,000 | -17,000 | -16,500 |
| Sub-totla | -22,000 | -21,500 | -22,000 | -17,000 | -17,000 | -17,000 | -17,000 | -16,500 |
| 4 Interest deductions | -6,000 | -6,000 | -6,500 | -6,500 | -7,000 | -7,000 | -7,500 | -7,500 |
| 5 Other deductions | -10,500 | -10,500 | -11,000 | -11,000 | -11,500 | -12,000 | -12,500 | -13,500 |
| Sub-total | -16,500 | -16,500 | -17,500 | -17,500 | -18,500 | -19,000 | -20,000 | -21,000 |
| Total tax expenditures | 20,000 | 20,000 | 21,500 | 19,000 | 19,500 | 20,000 | 20,500 | 20,000 |
These results confirm the expectation that the tax expenditures on owner-occupied housing, as it relates to investor housing, are indeed significant: $19.5 billion in 2009-10 and projected to be $20 billion in 2012-13. The falls in tax expenditures after 2007-08 are due to personal income tax cuts introduced in those years.10 At first glance one may expect the 50 per cent discount on capital gains to be half that of the tax on the capital gains. However, the discount is larger than this due to the progressive nature of the personal income tax system in Australia. Further insights into this effect on the 50 per cent CGT discount for individuals are discussed in the next section.
No imputed rent and no deductions benchmark
The treatment of imputed rent in the investor benchmark can be problematic, due to the paradoxical nature of imputed rent: tenure-neutrality suggests that imputed rent should be taxed identically to ordinary rental income, whereas the mutuality principle suggests that taxpayers’ internal transactions (the paying of rent to themselves) should not be taxed.
The second benchmark thus removes both imputed rent and any deductions for associated expenses such as mortgage interest payments and other housing deductions, leaving only capital gains considerations. This is similar to the situation of a holiday-home owner11 who does not rent out the dwelling, and is therefore not eligible to claim any deductions (but is generally ineligible to claim the main residence exemption).12
From the expenditures against this benchmark, shown in Table 2, a decrease in the total tax expenditure from $18 billion in 2007-08 to a projected $13.5 billion in 2012-13 is observed and is once again due to the personal income tax cuts after 2007-08. The key difference between the total tax expenditures for the investor benchmark in Table 1 and the benchmark in Table 2 is driven by the net value of imputed rent and the total deductions. The similarity in magnitude of the imputed rent and associated deductions in the investor benchmark causes them to largely cancel each other, leaving a residual amount of imputed rent which contributes to the total tax expenditure.
The no imputed rent and no deductions benchmark is used in Tables E4 and E5 of the 2009 TES, since it is consistent with the tax expenditure methodology specified in Appendix A.2.1 of the 2009 TES which excludes income from dealings with one’s self.
| 2005-06 $m |
2006-06 $m |
2007-08 $m |
2008-09 $m |
2009-10 $m |
2010-11 $m |
2011-12 $m |
2012-13 $m |
|
|---|---|---|---|---|---|---|---|---|
| Tax | ||||||||
| 1 Tax on Capital Gains | 39,500 | 38,500 | 40,000 | 31,000 | 31,500 | 31,500 | 31,000 | 30,000 |
| 2 Tax on Imputed Rent | 0 | 0 | 0 | 0 | 0 | 0 | 0 | 0 |
| Sub-Total | 39,500 | 38,500 | 40,000 | 31,500 | 31,500 | 31,500 | 31,000 | 30,000 |
| Less Offsets | ||||||||
| 3 50% discount on capital gains |
-22,000 | -21,500 | -22,000 | -17,000 | -17,500 | -17,000 | -17,000 | -16,500 |
| Sub-totla | -22,000 | -21,500 | -22,000 | -17,000 | -17,500 | -17,000 | -17,000 | -16,500 |
| 4 Interest deductions | 0 | 0 | 0 | 0 | 0 | 0 | 0 | 0 |
| 5 Other deductions | 0 | 0 | 0 | 0 | 0 | 0 | 0 | 0 |
| Sub-total | 0 | 0 | 0 | 0 | 0 | 0 | 0 | 0 |
| Total tax expenditures | 17,500 | 17,000 | 18,000 | 14,000 | 14,000 | 14,500 | 14,000 | 13,500 |
No imputed rent and partial deductions benchmark
The third benchmark examined in this study is an attempt to combine the different characteristics of the first two benchmarks. The second benchmark removed the eligibility for deductions on the basis that they were associated with imputed rental income, which was not to be taxed. However, this neglects the fact that the owner still receives income in the form of capital gains, even though this is not actually received until realisation when the housing is sold. Thus, it is still possible to make a case for allowing deductions in the presence of (expected) capital gains while imputed rent is untaxed. This is because deductions are generally allowed against relevant expenses incidental to capital investments as long as the investment is made with the intention of receiving capital gains. So, the third benchmark continues the non-taxation of imputed rent on mutuality grounds, but allows partial deductions of related expenses in recognition of the capital nature of owner-occupied housing.14
An initial expectation might be that the level of deductibility should be based on the ratio of imputed rent to capital gains. However, the amount of capital gains are unknown, and may indeed be a capital loss upon realisation. Furthermore, a pro-rated partial deduction is inconsistent with the concept of tax neutrality, since other capital investments, such as shares, do not have such a system of partial pro-rated deductions. Thus, this benchmark assumes a flat rate of 50 per cent applied to the eligible deductions of the investor benchmark.
| 2005-06 $m |
2006-06 $m |
2007-08 $m |
2008-09 $m |
2009-10 $m |
2010-11 $m |
2011-12 $m |
2012-13 $m |
|
|---|---|---|---|---|---|---|---|---|
| Tax | ||||||||
| 1 Tax on Capital Gains | 39,500 | 38,500 | 40,000 | 31,000 | 31,500 | 31,500 | 31,000 | 30,000 |
| 2 Tax on Imputed Rent | 0 | 0 | 0 | 0 | 0 | 0 | 0 | 0 |
| Sub-Total | 39,500 | 38,500 | 40,000 | 31,500 | 31,500 | 31,500 | 31,000 | 30,000 |
| Less Offsets | ||||||||
| 3 50% discount on capital gains |
-22,000 | -21,500 | -22,000 | -17,000 | -17,500 | -17,000 | -17,000 | -16,500 |
| Sub-totla | -22,000 | -21,500 | -22,000 | -17,000 | -17,500 | -17,000 | -17,000 | -16,500 |
| 4 Interest deductions | -3,000 | -3,000 | -3,000 | -3,000 | -3,000 | -3,500 | -3,500 | -3,500 |
| 5 Other deductions | -5,000 | -5,000 | -5,000 | -5,000 | -5,500 | -5,500 | -6,000 | -6,000 |
| Sub-total | -8,000 | -8,000 | -8,000 | -8,000 | -8,500 | -9,000 | -9,500 | -9,500 |
| Total tax expenditures | 9,500 | 9,000 | 10,000 | 6,000 | 5,500 | 5,000 | 4,500 | 4,000 |
Results for the tax expenditures against the third benchmark are presented in Table 3. Since there is no expenditure on imputed rent, the negative expenditure on deductions instead cancels some of the expenditure on capital gains. As a result, the total tax expenditures are still significant (projected to be $4 billion in 2012-13), but are considerably smaller when compared against the investor benchmark and the second benchmark.
Comparing the total deductions in Table 3 to that for the investor benchmark in Table 1 confirms that the values for the deductions in the third benchmark are approximately half the magnitude of those presented in Table 1. The reason why this difference is slightly more than 50 per cent, rather than exactly 50 per cent, is due to the progressive personal incom
e tax system in Australia.
The third benchmark may strike a useful balance between the competing interests of tenure neutrality and the mutuality principle.
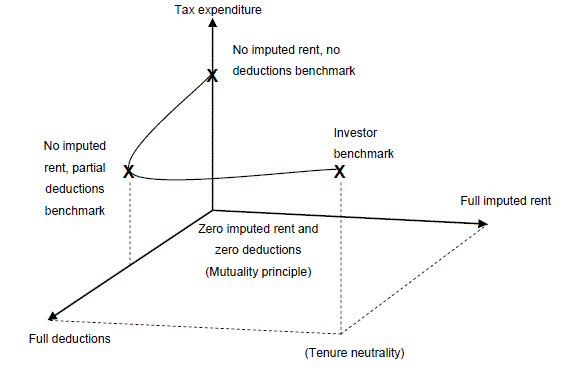
Visual construct of tax expenditure benchmarks for owner-occupied housing.
After presenting the three benchmarks against which the tax expenditures for owner occupied housing are determined, it is useful to provide a comparison of their analytical frameworks.
Figure 1 illustrates the concepts behind the three different benchmarks diagrammatically. One horizontal axis represents the level of imputed rent taxation, while the other represents the level of deductions allowed. Where there is full tenure neutrality (the investor benchmark), expenditures are high because imputed rent is fully taxed and deductions fully allowed, leaving mostly capital gains tax. Where the mutuality principle holds (the second benchmark), expenditures are also high because not only is imputed rent not taxed, but associated deductions are unavailable, again leaving capital gains tax. The third benchmark lies in between these two measures, where imputed rent is not taxed, but partial deductions are available.
Figure 1: Concept illustration of tax expenditure benchmarks
Insights into the impact of capital gains tax discount on owner-occupied housing
In an analysis which examines the tax expenditures related to owner-occupied capital gains, a number of insights into the nature of the capital gains discount may be observed. A discussion of these is presented to provide a better understanding of the implications of the capital gains tax discount on owner-occupied housing.
Capital gains tax discount and the main residence exemption
The interplay between the main residence CGT exemption and the CGT discount for individuals warrants further examination. As mentioned earlier, the main residence exemption can effectively provide a 100 per cent CGT discount, whereas the CGT discount for individuals is currently 50 per cent. The tax expenditure for the full 100 per cent discount of the main residence exemption for owner-occupiers is shown at item 1 in Tables 1 to 3.
However if this expenditure is considered in isolation, neglecting the effect of the discount for individuals, then the impact of the main residence exemption on the tax expenditures will be overstated. The reason for this is the subtle observation that in the presence of the discount for individuals, the main residence exemption is, in fact, not a 100 per cent discount. Rather, it discounts the remaining capital gains after the discount for individuals has been applied. Thus, of the full capital gains realised on an owner-occupied dwelling, the ‘first’ 50 per cent is discounted due to the discount for individuals, while the ‘remaining’ 50 per cent is discounted due to the main residence exemption, resulting in the overall 100 per cent discount. This is the reason for including item 3 in Tables 1 to 3; it is the part of the overall capital gains tax expenditures of item 1 which is attributable to the 50 per cent discount for individuals.
Thus, the true impact of the main residence exemption on tax expenditures, relative to these benchmarks that include the CGT discount for individuals, is found by adding items 1 and 3 in Tables 1 to 3. In terms of the TES (2009), the measure at item 3 for the second benchmark has been reported separately in Table E5 ‘Capital gains tax main residence exemption — discount component’ of the 2009 TES.
Possible effects of the capital gains tax discount on deductions
Similarly, the tax expenditures on mortgage interest and other deductions, shown at items 4 and 5 in Tables 1 and 3, are the full expenditures in the absence of the CGT discount for individuals. These non-capital-gains related deductions are influenced by the CGT discount for individuals because the marginal tax rate of taxpayers in receipt of capital gains has the potential to be lowered with the discounted capital gain, compared to the full capital gain.
As an example, consider the case of an owner-occupied dwelling owned by a single owner with a taxable income of $45,000 in 2006-07. If the dwelling was sold in 2006-07 after being purchased seven years prior, for the median house prices of approximately $421,500 and $216,500 respectively, then the capital gain is $205,000 in nominal terms.
The discounted capital gain of $102,500 would be taxed at a marginal tax rate of 40 per cent, whereas the full capital gain would be taxed at a marginal tax rate of 45 per cent. In this case, the effect of the CGT discount for individuals has been to reduce the marginal tax rate at which loan interest and other deductions occur.
This phenomenon is interesting because it illustrates the fact that the CGT discount for individuals can have effects that extend beyond the realm of taxing capital gains. This occurs despite the relatively small percentage of owner-occupiers receiving capital gains in each financial year. Although this effect is small when compared to the total tax expenditures in this study, it is not insignificant: the modelling shows that in 2009-10 (relative to the investor benchmark), approximately $300 million of the non-deductibility of loan interest and other payments by owner-occupiers can be attributed to the CGT discount for individuals.
Conclusion
This article has presented a study of Australian government tax expenditures that relate to owner-occupied housing as it compares to other forms of housing. In particular, the analysis includes the tax concessions of the main residence CGT exemption, 50 per cent CGT discount for individuals, imputed rent, mortgage interest deductions, capital works deductions and other deductions.
The tax expenditures have been presented relative to three different benchmarks; the tenure-neutral investor benchmark, the mutuality-preserving benchmark, and a hybrid benchmark featuring no imputed rent and partial deductions.
Considerable effort has been expended to model these expenditures, which has allowed them to be quantified for the first time in the TES 2009. The expectation of significant expenditures is confirmed against all three benchmarks, with total expenditures of approximately $14 billion forecast for 2009-10 as reported in Table E4 in the 2009 Tax Expenditures Statement. For context, the total tax expenditures on funded superannuation in 2009-10 is approximately $22.3 billion, as reported in Table D1 of the TES 2009
The effects of capital gains concessions appear to be more significant than the other concessions discussed; in particular the 50 per cent CGT discount for individuals is shown to affect non-CGT tax expenditures.
Appendix A
Model implementation and technical overview
The tax expenditure results presented in this article are based on assumptions that are consistent with historical growth rates. The overall expenditures are found by first estimating the following three components:
- capital gains tax on realisation for owner-occupiers;
- income tax on the imputed rent of owner-occupiers on an accrual basis; and
- income tax deductibility for expenses relating to generating imputed rent, specifically mortgage interest repayment deductions and ‘other deductions’ on an accrual basis.
The reliability of the tax expenditure estimates is only as good as the original source data that is used. The estimates are sensitive to small changes in assumptions and input data, and their reliability has not been quantified.
Estimating capital gain
The capital gain realised by an individual is approximated by taking the difference between the nominal median housing prices in the year of sale and the year of purchase.16 Total capital gains are determined by multiplying the individual’s capital gains by the turnover of the owner-occupied housing stock.17
In each financial year the housing stock is distributed according to the holding distribution in Table A1, which shows the percentage of housing stock that has been held for each holding length up to 26 years. This distribution is derived from the HILDA survey, in which owner-occupiers are asked how long they have lived in their current dwelling.18 The model makes the assumption that the dwellings sold in any time period are a random sample of the entire housing stock, that is, housing turnover follows the same holding distribution. This allows the yearly turnover to be treated as a collection of cohorts, each of whom purchased their dwelling in a different year. This in turn allows the capital gain of each cohort to be determined from the median house prices in the years of purchase and sale.
Table A1: Housing duration and alterations and additions profile assumptions
|
|
Housing duration profile for owner occupied households | Alterations and additions profile for owner occupied households Percentage of owner occupied | |||
|---|---|---|---|---|---|
| Percentage of owner occupied household sellers Main residence holding period |
Percentage of owner occupied households that undertake alterations and additions Main residence holding period |
||||
|
|
per cent |
|
per cent | ||
| 1 | 2.8% | 1 | 3.5% | ||
| 2 | 6.4% | 2 | 8.9% | ||
| 3 | 8.3% | 3 | 11.9% | ||
| 4 | 8.6% | 4 | 12.5% | ||
| 5 | 7.8% | 5 | 10.8% | ||
| 6 | 6.8% | 6 | 9.2% | ||
| 7 | 5.9% | 7 | 7.8% | ||
| 8 | 5.3% | 8 | 6.8% | ||
| 9 | 4.7% | 9 | 6.5% | ||
| 10 | 4.0% | 10 | 6.9% | ||
| 11 | 3.5% | 11 | 7.8% | ||
| 12 | 3.1% | 12 | 8.7% | ||
| 13 | 2.8% | 13 | 8.1% | ||
| 14 | 2.5% | 14 | 6.5% | ||
| 15 | 2.5% | 15 | 4.6% | ||
| 16 | 2.5% | 16 | 4.1% | ||
| 17 | 2.4% | 17 | 4.5% | ||
| 18 | 2.0% | 18 | 4.1% | ||
| 19 | 1.6% | 19 | 4.0% | ||
| 20 | 1.3% | 20 | 4.1% | ||
| 21 | 1.2% | 21 | 4.3% | ||
| 22 | 1.1% | 22 | 4.7% | ||
| 23 | 1.2% | 23 | 4.5% | ||
| 24 | 1.1% | 24 | 3.6% | ||
| 25 | 1.0% | 25 | 2.4% | ||
| 26 | 0.7% | 26 | 1.2% | ||
| Total | 91.0% | Weighted average | 8.0% | ||
Some dwellings have undergone major capital works, that is, alterations and additions. Table A1 shows the percentage of owner-occupied dwellings that undertake such improvements, based on the holding length of the main residence. This data is derived from the Housing Expenditures Survey (HES).19 For those dwellings that have undergone improvements, the average cost of an alteration or addition (based on ABS housing finance data20) is added to the cost base of the dwelling. Although alterations and additions have been included in modelling the tax expenditures of owner-occupied housing, it does not significantly impact the magnitude of the estimate. In fact, it is estimated to affect the total tax expenditure by approximately $1 billion in each of the years 2005-06 to 2012-13.
The expenditure estimates presented in this study are particularly sensitive to owner-occupied housing turnover rates and the housing duration profile.
Sometimes cohorts have aggregate capital losses, particularly when the median house price between a pair of years has fallen or when dwellings that have been held for short periods undergo improvements (which may effectively increase their cost price above the median house price for that year). These capital losses may be offset against future capital gains of the homeowner (that is, upon the sale of a successive dwelling). The model assumes that such homeowners purchase another dwelling for owner-occupation, and that this next dwelling will be held for a length of time determined by the holding distribution in Table A1.21 Thus, aggregate capital losses are distributed into the future years of that cohort. This process is repeated until all aggregate capital losses have either been offset against subsequent capital gains or else registered as potential future capital gains offsets.22
The tax liability of a cohort’s capital gain is determined by using the applicable average marginal tax rate, as described below in the section ‘Tax rate treatment’.
Capital works considerations
For dwellings that are used to earn income, expenses on major capital works are eligible for capital works deductions. These deductions are distributed over multiple years, being either 4 per cent of the capital works expenses per year over 25 years, or 2.5 per cent of the capital works expenses per year over 40 years, depending on when the capital works were performed, up to a maximum of the total nominal value of the capital works. Thus, for dwellings that undertake improvements, the cumulative capital works deductions are removed from the CGT cost base of the dwelling.
Tax rate treatment
In order to compute the tax liability of additional assessable income or the tax deductibility of deductible expenses, an appropriate marginal tax rate is required. However, owner-occupiers in different situations will have different marginal tax rates, the most obvious example being that owner-occupiers who receive capital gains after selling their dwelling will typically be in a higher marginal tax bracket.
This problem is addressed through the use of average marginal tax rates (AMTR) for the owner-occupiers in various situations. Table A2 shows the 24 different owner-occupier situations considered, based on whether the dwelling is owned individually or jointly by a couple (‘Joint ownership’), is mortgaged or owned outright (‘Housing mortgage’), has been sold in that financial year or not (‘Selling’), has been improved or not (‘Alterations and additions’), and if so, if a loan was used to fund the improvements (‘Mortgage for alterations and additions’). Each of these situations has a different level of additional assessable income and deductions.
- Joint ownership: Dwellings that are jointly owned by a couple have the feature that additional income and deductions can be split equally between the two joint owners. This has the potential to lower their joint tax liability, since each may face a lower marginal tax rate than if one of them faced the full additional income and deductions.
- Housing mortgage: Dwellings that have a mortgage can claim deductions for mortgage interest repayments.
- Selling: Dwellings that have been sold in a financial year are subject to additional assessable income of the discounted capital gain they make.
- Alterations and additions: Dwellings that have had improvements can claim capital works deductions. Furthermore, such dwellings that are also being sold must adjust their CGT cost base by the cost of their improvements, less any capital works deductions that have previously been claimed prior to selling.
- Mortgage for alterations and additions: Dwellings that have borrowed funds for improvements can claim deductions for the associated interest repayments.
In the investor benchmark, all the situations also have imputed rent as additional income and the miscellaneous other deductions related to rental income. These are not present in the second benchmark. Deductions for the depreciation of assets that are associated with owner-occupied dwellings are implicitly taken into account in the miscellaneous other deductions.
The overall average marginal tax rate for each of capital gains, imputed rent, mortgage interest deductions and other deductions are then obtained by taking the weighted average of the AMTRs for the appropriate situations, where the weights are proportional to the number of owner-occupiers in each situation.23
|
|
Joint ownership | Housing mortgage | Selling | Alterations and additions | Mortgage for alterations and additions |
|---|---|---|---|---|---|
| 1 | Y | Y | Y | Y | Y |
| 2 | Y | Y | Y | Y | N |
| 3 | Y | Y | Y | N | |
| 4 | Y | Y | N | Y | Y |
| 5 | Y | Y | N | Y | N |
| 6 | Y | Y | N | N | |
| 7 | Y | N | Y | Y | Y |
| 8 | Y | N | Y | Y | N |
| 9 | Y | N | Y | N | |
| 10 | Y | N | N | Y | Y |
| 11 | Y | N | N | Y | N |
| 12 | Y | N | N | N | |
| 13 | N | Y | Y | Y | Y |
| 14 | N | Y | Y | Y | N |
| 15 | N | Y | Y | N | |
| 16 | N | Y | N | Y | Y |
| 17 | N | Y | N | Y | N |
| 18 | N | Y | N | N | |
| 19 | N | N | Y | Y | Y |
| 20 | N | N | Y | Y | N |
| 21 | N | N | Y | N | |
| 22 | N | N | N | Y | Y |
| 23 | N | N | N | Y | N |
| 24 | N | N | N | N |
References
Australian Taxation Office, 2009 (2010) Guide to capital gains tax. Australian Taxation Office, 2009 Rental properties.
Bourassa, Steven C and Hendershott, Patrix H 1994, On the Equity Effects of Taxing Imputed Rent: Evidence from Australia, Housing Policy Debate vol. 5, no. 1. CCH Australia 2010, Australian Master Tax Guide, 46th edition.
Department of Housing and Construction (DHC), 1987, Housing Assistance Act 1984 Annual Report 1985-86, Canberra: Australian Government Printing Office.
Flood, J and Yates, J 1987, Housing Subsidies Study, Australian Housing Research Council, Canberra: Australian Government Printing Service.
Flood, J and Yates, J 1989, Housing Subsidies and Income Distribution, Housing Studies, 4(3): pp 193-210.
Haffner, M 2002, Dutch Personal Income Tax Reform 2001 an Exceptional Position for Owner-occupied Housing, Housing Studies, vol. 17.
OECD Tax Policy Studies 2006, Taxation of Capital Gains of Individuals, Policy Considerations and Approaches.
Reece, B 1985, Simons' Account of Australian Taxation of Imputed Rental Income, Australian Tax Forum, 2(2), 239-242.
Richard FE and Warburton, PH 2006, International Comparison of Australia’s Taxes, Canberra.
Australian Treasury 2010, 2009 Tax Expenditures Statement, Commonwealth of Australia.
Australian Treasury 2009, 2008 Tax Expenditures Statement, Commonwealth of Australia.
Yates, J 2009, Tax expenditures and housing, Brotherhood of St Laurence and the Australian Housing and Urban Research Institute, September.
Yates, J 1994, Imputed rent and income distribution, Review of Income and Wealth, Series 40, Number 1, March.
Yates, J 2002, A distributional analysis of the impact of direct and indirect housing assistance, Australian Housing and Urban Research Institute, August.
Yates, J 2003, A distributional analysis of the impact of indirect housing assistance, Australian Housing and Urban Research Institute, April.
1 The author is from the Tax Analysis Division, the Australian Treasury. This article has benefited from comments and suggestions provided by Thomas Abhayaratna, Scott Bartley, Colin Brown, Phil Gallagher, Chris Leggett, Maryanne Mrakovcic, George Rothman, and David Tellis. The views in this article are those of the author and not necessarily those of the Australian Treasury.
2 The tax expenditures are presented in Tables E4 Capital gains tax main residence exemption and E5 Capital gains tax main residence exemption — discount component and are identified as modified and new tax expenditures in Appendix B of the 2009 Tax Expenditure Statement.
3 The estimates reported are based on the second of three different benchmarks outlined in Appendix C: Alternative estimates for owner-occupied housing, 2009 Tax Expenditures Statement, January 2010. Tax expenditure estimates for owner-occupied housing have only been previously presented in an appendix of the 2008 Tax Expenditure Statement.
4 Deriving rental income from a main residence may have capital gains tax implications.
5 This is one example of the i
ssues involved in sequencing different components of the overall tax expenditure and raises questions regarding the choice of an appropriate benchmark and its components, which this article will attempt to address.
6 Imputed rent was included in the Australian Federal income tax base from 1915 to 1923.
7 In fact, deductions for mortgage interest repayment were available as a subsidy to first home owners, for the first 5 years of the loan, available on loans taken out between 1 July 1982 and 30 September 1983 (DHC, 1987).
8 Australian Bureau of Statistics 2007, Australian Social Trends — Housing 2007, ABS cat. no. 4102.0.
9 The tax expenditure estimates presented in this table are based on the tax estimated for that income year and not on assessment, which is typically lagged by approximately one year.
10 This occurs despite a continuing rise in median house prices during this time.
11 The main difference between this benchmark and that of a holiday-home owner is that a holiday-home owner can offset the cost base by the cost of rates, insurance, land tax, maintenance and mortgage interest. The second benchmark considered in this article does not include these offsets.
12 Or, equivalently, rents out the holiday-home to family or relatives, or for a token amount of rent, as described in Taxation Ruling IT 2167.
13 The tax expenditure estimates presented in this table are based on the tax estimated for that income year and not on assessment, which is typically lagged by approximately one year.
14 As explained earlier in footnote 11, the holiday home tax considerations would imply that for benchmark three the remaining 50 per cent of the deductibility would offset the cost base in calculating the capital gain. However, for simplicity, the third benchmark does not include this offset in the analysis.
15 The tax expenditure estimates presented in this table are based on the tax estimated for that income year and not on assessment, which is typically lagged by approximately one year.
16 Ideally the mean housing prices should be used in calculating the capital gains, but this data is unavailable. In fact, using median house prices rather than the mean is expected to understate the capital gains if it is assumed that the entire spectrum of the housing price distribution grows at a constant rate over time.
17 The modelling of the turnover rate is based on the ABS cat. no. 5609.0 – Housing Finance, Australia.
18 Housing, Income and Labour Dynamics data Waves A, B, C, D, E and F.
19 Housing Expenditure Survey 2003-04.
20 ABS cat. no. 5609.0 – Housing Finance, Australia, April 2008.
21 This neglects owner-occupiers who cease being owner-occupiers following the sale of their dwelling.
22 This corresponds to a negative tax expenditure on owner-occupied capital gains tax in unknown future years.
23 For example, the AMTR for capital gains is the weighted average of the AMTRs for situations 1-3, 7-9, 13-15 and 19-21 (that is, the situations where ‘Selling’ is ‘Y’), whereas the AMTR for imputed rent uses all the situations, since they are all subject to taxation of imputed rent in the investor benchmark.