Oil prices have risen substantially over recent months, driven by underlying demand and supply imbalances, short-term supply constraints in Venezuela and heightened geopolitical uncertainties. This article reviews developments that have been affecting oil prices and the potential implications of higher oil prices for the global economy.
Recent oil price developments
In the months following the terrorist attacks of 11 September 2001, oil prices (West Texas Intermediate) declined to a 2 year low of US$17.50 per barrel due to market concerns regarding a possible slowdown in the United States (US) and the global economy. The decision by the Organisation of Petroleum Exporting Countries (OPEC)2 to cut crude oil exports and signs of a more robust global recovery contributed to oil prices quickly returning to pre-September 11 levels in early 2002. In the period since then, a number of factors have contributed to oil prices rising to their highest level since the Persian Gulf War in the early 1990s:
- the uncertainty associated with possible oil supply disruptions in Iraq (Iraq has the second largest proven oil reserves) has resulted in a 'premium' estimated to be between US$4-US$8 per barrel being factored into recent market prices;
- OPEC oil production (and supply) have been affected by disruptions to supply from Venezuela;
- world inventory levels have declined considerably with US commercial inventories now at their lowest levels since 1975; and
- despite increased efficiency in the use of oil and increased substitution towards other sources of energy over recent decades, total world oil demand has been further boosted recently by colder than normal weather in North America and Asia, a sharp increase in Chinese imports, and a decline in Japanese nuclear energy output.
Chart 1: Oil prices, West Texas intermediate crude (daily)*
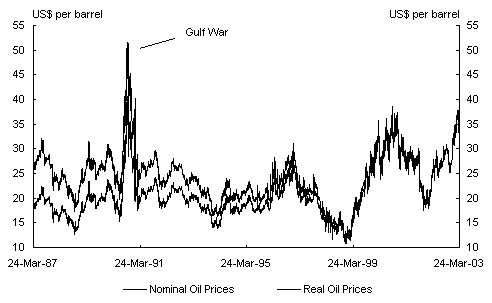
* Oil prices have been deflated using the US GDP deflator in 2002 dollars.
Source: Data Stream.
Oil prices have recently been at their highest levels since the 1990/1991 Gulf War highs in nominal terms, and have been above US$25 per barrel since June 2002. This sustained increase differs from the behaviour of oil prices during the early 1990s Gulf War when oil prices increased substantially over a relatively short period of time before war was declared, and then dropped to an average of US$22 per barrel for the period of the military conflict.3 While the increase in real oil prices is more muted, the upturn in prices to date suggests that the global economic recovery is likely to be constrained in the short term irrespective of future developments.
Recent developments in global oil demand
Over recent decades the world economy has reduced its relative dependency on oil when measured in terms of oil per dollar of real Gross Domestic Product (GDP). For example, in 2001, US oil consumption per dollar of real GDP was 10.4 thousand Btu (British thermal unit), down from 12.7 in 1991 and 18.8 in 1971.
Nevertheless, a number of factors have recently increased demand for oil. These include colder than normal weather in Asia and North America, low Japanese nuclear output increasing the demand for oil as an energy substitute and higher Chinese demand. These factors resulted in world oil demand increasing by 0.4 million of barrels per day (mb/d) over 2002.4
In 2003, world oil demand is expected5 to increase by an additional 0.5 to 1.1 mb/d, with US demand remaining robust due to unseasonably colder weather and slowly recovering industrial activity.The substantial increase in Chinese demand in 2002 is likely to be temporary due to stronger than usual seasonal factors associated with the Chinese New Year. However, Chinese demand for oil has been increasing and is expected to grow by 2.7 per cent in 2003, nearly double the increase in world demand. Japanese nuclear power output is expected to decline further in 2003, underpinning ongoing Japanese demand for oil. Japanese demand for crude oil is expected to increase by over 7 per cent compared with a year earlier, in the first half of 2003 (Chart 2).
Chart 2: Japanese demand for crude oil
(through the year growth)
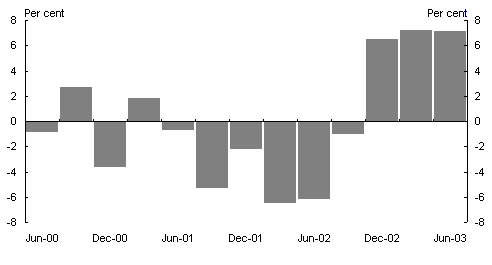
Source: International Energy Agency, Monthly Oil Report, February 2003.
Developments in global oil supply
OPEC and Non-OPEC supply in 2002
While demand has been increasing, world oil production declined slightly by 0.2 million barrels per day in 2002 due to a 1.6 mb/d6 decline in OPEC production outweighing a non-OPEC production increase of 1.4 mb/d. Around half of the additional non-OPEC production came from Russia.
In 2002, OPEC oil production declined due to its decisions to reduce production in the first half of 2002, as well as the nationwide strike in Venezuela that began in December 2002. The strike in Venezuela has caused major oil supply disruptions, with production declining from about 3.4 mb/d in November 2002 to around 0.9 mb/d in December 2002, declining further to about 0.6 mb/d in January 2003, before increasing to around 1.5 mb/d in February 2003. In the period immediately ahead, there is doubt that Venezuela's oil production will return to pre-strike levels, as some of Venezuela's older oil fields are not expected to reopen post strike, and a number of oil pipelines have been damaged during the strike.7
Projected OPEC and Non-OPEC supply in 2003
Abstracting from developments in Iraq, non-OPEC oil supply is expected to rise by around 1.4 mb/d in 2003, with North America and the Former Soviet Union being the major contributors.8
Unlike non-OPEC producers, OPEC member countries have been adjusting production levels in response to changing market conditions. In light of the supply disruption caused by the strike in Venezuela, on 12 January 2003 the OPEC-109 decided to raise their oil production ceiling from 23 mb/d to 24.5 mb/d, with effect from 1 February 2003.The OPEC meeting held on 11 March 2003 maintained these quotas.
In the event of any disruption to Iraqi oil exports, OPEC has stated that oil production will be increased further. Saudi Arabia has already increased its production in February 2003 above its quota of 7.96 mb/d to around 8.5 to 9.0 mb/d in response to falling production in Venezuela. However, looking further ahead, there would appear to be only limited capacity for oil producing countries to ramp up production in response to any further disruptions to the world's oil supply. Saudi Arabia (which accounts for the vast bulk of spare production capacity within OPEC) can increase production to around 10 mb/d within 30 days and to around 10.5 mb/d within 90 days. Nonetheless, with Saudi Arabia already increasing production in February, it would seem to have limited excess capacity (only 0.8 to 1.3 mb/d), representing less than half of Iraq's current oil exports.10
Another factor impacting on oil supply is Nigeria's capacity to continue exporting at the rate of 2 mb/d. In both Nigeria and Venezuela there has been social unrest, which is expected to increase in the lead up to elections in bot
h countries in April 2003.
Developments in global oil stocks
Declining oil production and stronger demand resulted in world private sector oil stocks declining, particularly towards the end of 2002. The industrial oil stocks of Organisation for Economic Cooperation and Development (OECD) countries declined in January 2003, to be about 8 per cent or 211 million barrels lower than levels recorded a year earlier. The fall in the OECD's oil inventories was dominated by large declines in commercial oil inventories in the US.
Since the beginning of 2003, US commercial crude oil inventories have fallen to their lowest level since 1975 and crude oil stock levels are a little above the Lower Operational Inventory level11 of 270 million barrels (Chart 3).
Chart 3: US Commercial crude oil inventories
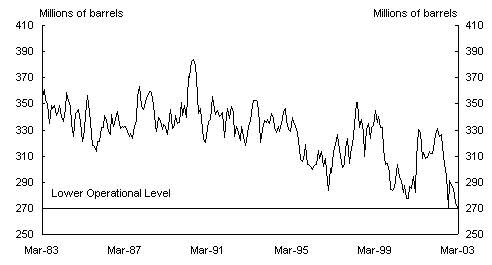
Source: Energy Information Administration.
If commercial oil stocks in the US decline further, the US Government may release crude oil from its Strategic Petroleum Reserve (SPR), which is a stockpile of oil that was established in the mid 1970s to help combat oil supply shocks. Since the beginning of President Bush's term in office in January 2001, the SPR has grown by over 10 per cent and currently contains a record 599.3 million barrels.
The SPR has a maximum drawdown capability of 4.1 mb/d for 90 days, with oil beginning to arrive in the marketplace 15 days after a presidential decision to initiate a drawdown.12 The reserve could currently supply oil to the US market for approximately 180 days assuming maximum withdrawal.
Disruptions to the world's oil supply
By some measures, the 1990-91 Persian Gulf War resulted in the largest average fall in the world's gross oil supply experienced to date, although oil production was only disrupted for 4 months.13 During the Gulf War, world oil supplies declined by over 4 million barrels per day (including the disruptions to Iraqi-held oil facilities in Kuwait).The relatively short-lived nature of the price increase in the Gulf War reflected both the short duration of military conflict as well as moves made by Saudi Arabia in late 1990 to increase production, which largely offset the disruption to Iraqi and Kuwaiti supplies. In addition the US released reserves from the SPR and members of the International Energy Agency (IEA) also released oil from their emergency reserves when war was announced in 1991.14
While the oil supply outlook remains very uncertain, the combined effect of the strike in Venezuela and possible supply disruptions in the Middle East have the potential to tighten oil supplies considerably. If production in Venezuela were to remain around 2.5 million barrels per day below its normal production level (as experienced in January 2003); and if Iraq's current daily production of around 2.4 mb/d were to be disrupted, the world's oil supply could be around 5 mb/d less than in November 2002 (Chart 4). The world's oil supply could decline further if Kuwait's oil production of 2.1 mb/d is also disrupted. Even without Kuwait being attacked, its government has announced that in the event of military conflict with Iraq, its northern oil fields producing between 0.4 to 0.7 mb/d would be shut down.
Chart 4: Oil supply disruptions - average gross supply shortfall
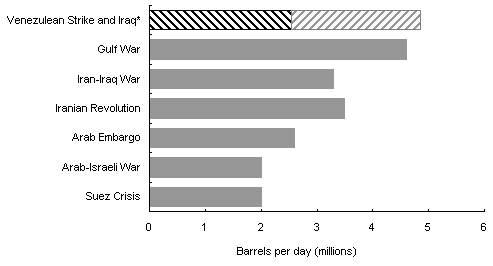
* Assumes oil production in Venezuela remains at January 2003 production levels (![]() );all of Iraqi oil supplies are disrupted (
);all of Iraqi oil supplies are disrupted (![]() ); and OPEC and non-OPEC countries do not increase supply.
); and OPEC and non-OPEC countries do not increase supply.
Source: Energy Information Administration.
Compared to the 1990/1991 Persian Gulf War, there appears to be less excess oil production capacity now than in 1990. Based on oil production levels in March 2003, OPEC's excess capacity is likely to be around 2.1-2.6 mb/d (1.5-2.0 mb/d excluding Iraq). This represents the second lowest spare capacity availability over the past three decades, trailing only the low point reached in 1991. As already noted, in the event of any disruptions to oil production in Iraq, it is estimated that higher oil production by Saudi Arabia could only cover around half of Iraq's reduction in exports.
The impact of any oil supply disruption will depend on the duration of uncertainty and the spread/containment of any military conflict. Current demand and supply imbalances suggest that oil prices are unlikely to fall to very low levels in the short term.
The recovery in Middle East oil production would depend upon the extent of damage to oil infrastructure and the restoration of stability. Furthermore, to address the current imbalances in the oil market, private oil stocks would need to be rebuilt, which could provide some support for oil prices.
Economic impact of higher oil prices
The risks to the global economy arising from higher oil prices appear to be relatively clear - all major world economic downturns over the last 30 years have been associated with large rises in oil prices. As a guide to the potential link between oil prices and global economic growth, the International Monetary Fund (IMF) estimates that a permanent $US 5 per barrel increase in oil prices reduces the level of global output by a ¼ of a percentage point from baseline over 4 years.15
A sustained rise in oil prices would be expected to translate into higher production costs and increased inflation, lower profitability and reduced incomes, depressed consumer and business confidence (and spending), and ultimately, more subdued economic growth.
The transmission of high oil prices through the economy can be complex, with the direct impact of higher oil prices on GDP growth being difficult to disentangle because of other developments taking place simultaneously. For example, during previous oil shocks, policy responses to higher inflation via higher interest rates (Chart 5) also worked to constrain short-term economic growth.
A number of factors might work towards some weakening in the historical relationship between higher oil prices and lower economic growth. The current very low inflationary global environment may see central banks being more willing to see through short-term inflation pressures arising from higher oil prices, if the increases in inflation are expected to be temporary. For countries currently experiencing deflation, even the longer-term inflationary pressures arising from the oil price shock might not be resisted. In addition, the world economy has continued to reduce its relative dependency on oil over the last decade.
These developments aside, strong linkages between high oil prices and global output growth are likely to remain. With the recent rise in oil prices coming at a time of a relatively weak global economy and uncertain global equity markets, it can be expected to constrain global economic growth in the short term irrespective of what happens from here on.
Higher oil prices have already resulted in higher import prices for net importers of oil, increased inflation and a deterioration in these countries' terms of trade.
While OPEC, the Former
Soviet Union, and other net exporting countries are already likely to have gained from higher oil prices, the US (the world's largest consumer of oil), Korea, China, Japan, Western Europe and India are likely to have experienced a deterioration in their balance of payments.
Chart 5: Developments in oil prices, world economic growth
and nominal interest rates
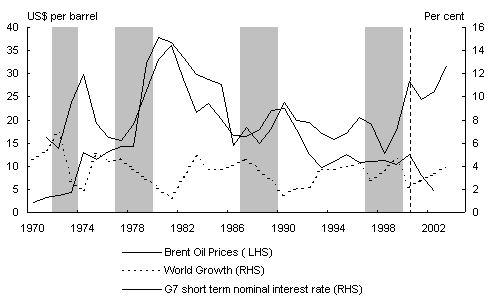
Note: World GDP growth forecasts in 2003 are sourced from Treasury's Mid-Year Economic and Fiscal Outlook 2002-03. Brent Oil price represents year-to-date averages for 2003. Shaded columns represent periods of substantial rises in oil prices.
Conclusion
Oil prices started rising from mid 2002 and have been very high since December 2002. The increase in oil prices has been due to a number of factors including: the rise in geopolitical uncertainties; stronger demand arising from colder than normal weather in North America and Asia; lower Japanese nuclear output; and strong Chinese demand. At the same time, world oil supplies have declined due to reductions in OPEC supply, especially from December 2002 when oil production in Venezuela declined due to strikes. Tightening supply conditions and strong demand has placed additional upward pressure on oil prices.
In 2003, demand and supply imbalances are expected to continue, indicating that even if uncertainties are resolved relatively quickly, oil prices could remain relatively high and volatile in the near term.
In the event of oil supply disruptions in the Middle East there is a possibility that oil supplies might tighten further. Under these circumstances, it is highly likely that countries would begin to release oil from their strategic reserves.
There has been a relatively strong historical relationship between high oil prices and lower global economic growth. While this linkage is likely to remain intact, the current very low inflationary environment in the world could see central banks responding differently to the inflationary impact of higher oil prices than they have in the past.
With the recent rise in oil prices impacting on top of an already relatively weak global economy and declining equity markets, these ongoing uncertainties are likely to moderate the strength of global economic recovery in the short term.
- Postscript: President Bush announced on 18 March 2003 that President Hussein had 48 hours to leave Iraq and war was subsequently declared on 20 March. Oil prices had fallen by 16 per cent on 19 March 2003 from post 1990/1991 Gulf War highs in the previous week. During the first week of the war oil prices were volatile. By 26 March 2003, 7 out of the 500 oil wells in Iraq's Southern oil field (which supplies between 40 and 60 per cent of Iraqi oil) had been set alight. Furthermore, civil unrest in Nigeria has resulted in its oil production of 2 million barrels per day declining by around one third. Nigeria is the world's seventh largest oil exporter and the United States' fifth largest source of oil.
- OPEC is an international organisation of eleven developing countries reliant on oil revenues as their main source of income. The current members are Algeria, Indonesia, Iran, Iraq, Kuwait, Libya, Nigeria, Qatar, Saudi Arabia, the United Arab Emirates and Venezuela.
- War was announced on 17 January 1991 and was officially over on 27February 1991.
- Source: International Energy Agency (IEA).
- In 2003, OPEC forecasts a rise in demand of 0.5 mb/d while IEA forecasts a rise of 1.1 mb/d. Source: OPEC, Monthly Oil Report, 18 February 2003. IEA, Monthly Oil Report, 17 February 2003.
- These IEA estimates of OPEC production compare with OPEC estimates of a decline of 1.9 million barrels per day.
- Although the general strike ended on 2 February 2003, oil workers (with the exception of oil harbour pilots who represent 10 per cent of total oil workers) remain on strike. In addition, many skilled workers who were on strike have been fired and replaced with unskilled workers.
- IEA, Monthly Oil Report, February 2003.
- OPEC member countries (Algeria, Indonesia, Iran, Kuwait, Libya, Nigeria, Qatar, Saudi Arabia, United Arab Emirates, and Venezuela) excluding Iraq.
- Source: Energy Information Administration (EIA). Saudi Arabia's excess capacity is based on estimated March 2003 production of 9.2 million barrels per day.
- The Lower Operational Level represents the size of oil stocks that the industry considers essential for smooth market operations.
- Source: US Department of Energy. The SPR drawdown rate declines to 3.2 mb/d for days 91-120, to 2.2 mb/d for days 121-150, and to 1.3 mb/d for days 151-180.
- The total decline in oil production during the Persian Gulf War was less than that experienced during the Iranian Revolution and in three other oil shocks due to the short duration of the disruptions to oil supplies in 1990/1991.
- IEA members are currently holding nearly 4 billion barrels of public and industry oil stock, which represent at least 114 days of net imports.
- Hunt, B., Isard, P., Laxton, D, The Macroeconomic Effects of Higher Oil Prices, IMF Working Paper, 2001. The baseline is where the economy would have been if the shock had not occurred.