Downloads
Thank you for inviting me to speak this morning.
There is a long and productive tradition of discussion between Treasury and CEDA on the macroeconomic outlook and how this will affect Australian wellbeing. Right now, that conversation is as important as ever. So it is a pleasure to be here.
My remarks will focus on global developments and their implications for our macroeconomic outlook. I shall finish with a few words on forecasting.
The broad context is that the Australian economy has performed remarkably well over the past couple of decades, in the face of some of the largest global supply and demand shocks in the best part of a century.
While we might always prefer somewhat better outcomes, particularly on unemployment, our current central case is for the economy to continue to perform well.
As a small open economy, foreign investment, trade and immigration are key to our economic outlook. Global conditions matter to us.
Over the past few decades, the global economy has been in a continual state of transformation.
Extraordinary technological advancement.
A stunning increase in global connectivity.
And tectonic shifts in the geographic balance of economic power.
Partly through good fortune, and partly through the application of good economic policy, these changes have contributed to an enormous increase in Australian living standards.
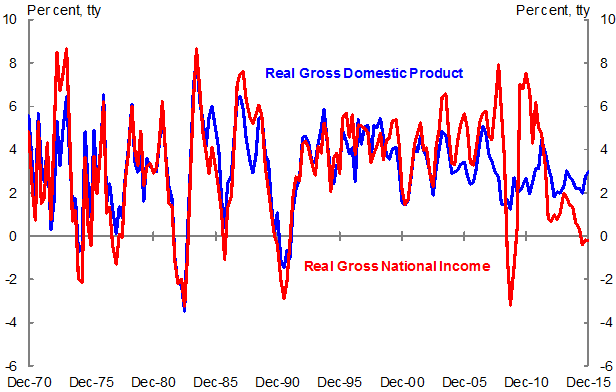
Decade after decade we have produced more goods and services, and our national income – our national purchasing power – has grown in line with these increases (Chart 1).
Chart 1: Historical Australian real GDP and real GNI growth

Source: ABS Catalogue 5206.0
You can see that this relationship between output and income has shifted markedly in the past decade and a half. Early this millennium, driven by strong global conditions, the price of our exports surged.
Not only did this global demand for commodities result in more real activity – a huge growth in mining investment and export volumes – it delivered Australia a striking and very large positive income shock.
This was positive for our commodity exporters. More importantly, it was positive for Australian household incomes, which were supported by real exchange rate appreciation during the commodity boom. And it supported government revenue.
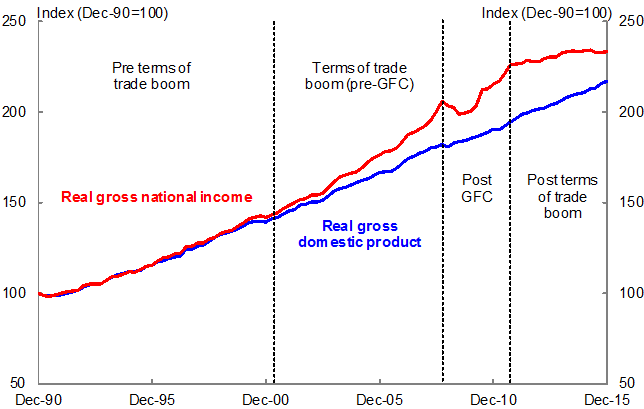
While the global financial crisis interrupted the terms of trade boom, you can see from the chart how extraordinarily large was the divergence between the growth in output and the growth in income.
Chart 2 – Historical Australian real GDP and real GNI levels

Source: ABS Catalogue 5206.0
Fast forward to 2016.
Production and employment are expanding at a solid pace.
But the downturn in our terms of trade since 2011-12 has seen growth in national income first drop below GDP growth, and then stall. And shrink on a per capita basis. Since the terms of trade peak in 2011, we have had declining net national disposable income per capita – a measure regarded as a proxy for standards of living.
Still, Chart 2, which is in levels, shows that Australia continues to enjoy much of the higher income that has been driven by the terms of trade boom.
So, what is next?
For one thing, we cannot rely on a resurgence in the global economy to underwrite our national prosperity.
Global growth has struggled to regain sustained momentum post-global financial crisis, and global aggregate demand remains weak.
This is despite monetary policy settings in nearly all of the major economies remaining extraordinarily accommodative, and global public debt increasing since the global financial crisis.
Global risks are tilted to the downside and have intensified in recent months.
We have seen deterioration and heightened volatility on global equity and credit markets. Markets seem to be questioning whether global growth will be strong enough to drive corporate earnings and maintain low default rates in order to sustain current valuations. In a lower growth, lower inflation world, there may well be continued heightened volatility on financial markets.
Major official forecasters have continued to downgrade prospects for global growth. The IMF downgraded its forecast in its January update – the 17th downgrade in five years. Last month, the OECD also downgraded its outlook for world growth.
Slower global growth has been accompanied by a number of trends that are observable across the global economy: slower growth in trade; weak business investment; slower productivity growth; slower population growth in advanced economies; low inflation; and lower inflation expectations.
Even against the long-anticipated backdrop of slower growth in the working age population in key economies, official forecasters are also reconsidering their view of long-run potential GDP growth. This partly reflects the ongoing legacy of the global financial crisis – such crises have long lived effects on investment in productive capital and on labour markets, increasing structural unemployment and lowering labour force participation rates. In addition, recent estimates by the IMF suggest that productivity growth was slowing in advanced economies even before the global financial crisis.
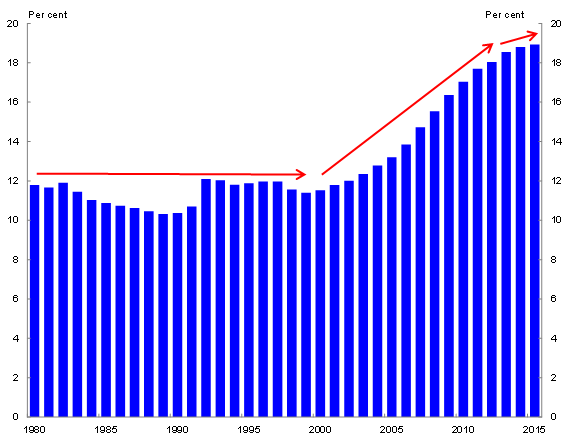
More recently, we have observed that the convergence between emerging and advanced economies we have seen since the turn of the century is showing signs of stalling (Chart 3). If this occurs, it would affect the outlook for future global economic activity; and could have broader consequences.
Chart 3: Emerging market GDP per capita as percentage of US GDP per capita

Source: IMF October 2015 WEO database.
Note: GDP per capita is calculated on a purchasing power parity basis.
This view of the world sounds a little grim.
But not all global developments are so clearly challenging for Australia.
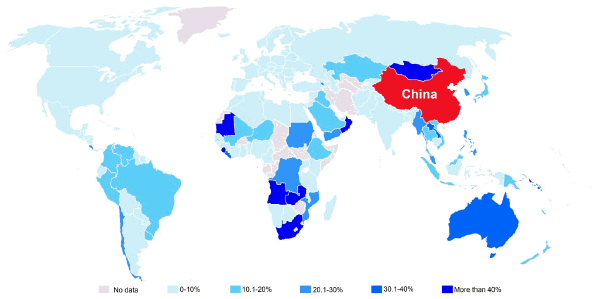
The Australian economy is today more than ever connected to China.
In fact, Australia has the highest proportion of its exports going to China of any advanced economy. China accounted for around 32 per cent of our total merchandise exports in 2014-15, up from around 10 per cent in 2004-05.
Chart 4: World exports to China (2014)

Source: CEIC China database and IMF
Twenty years ago the Chinese economy was less than a third of the size of the United States economy. Today the Chinese economy is the largest economy in the world in purchasing power parity terms. Despite slowing growth, China remains one of the fastest growing economies in the world. And its official growth target has been set at between 6½ and seven per cent for 2016.
Within that overall growth outcome there is significant restructuring occurring in the Chinese economy, with the major driver of growth shifting gradually from investment to consumption, albeit somewhat reflecting government spending rather than a pronounced pick-up in household consumption.
At the sub-national level in China growth is widely different between provinces. The ‘Old economy provinces&rsquo
; in the North East that rely heavily on mining and heavy industry are experiencing low growth with – at times - sharp contractions being driven by a slowing industrial sector.
Thus far, Australian resources production has held up well. Reflecting our higher quality iron ore, Australia has increased its share of China’s total iron ore imports even as the industrial sector has slowed, and our exports volumes to China have continued to grow.
The substantial increases in global supply, including from Australia, are the main driver of falling commodity prices. The slowdown in China’s industrial sectors is also causing some slowdown in commodity prices, reducing Australia’s terms of trade and real incomes.
The outlook for the North East of China contrasts with provinces in the South and along the Eastern seaboard, in which rapid technological adoption and innovation is supporting robust income and consumption growth. This is consistent with the Chinese authorities’ objectives of transitioning the economy to one reliant on consumption and services as drivers of growth.
This transition is creating opportunities for us.
Through our business liaison program, we are seeing a strong interest from Australian businesses in taking advantage of these opportunities.
China is already our largest destination for services exports, having increased from around 3 per cent of our services exports in 2000‑01 to around 14 per cent in 2014-15.
China is now our second largest source of overseas visitors, and their visitors spend far more than the average. There were over one million arrivals in 2015. As impressive as this number is, it is still only about one per cent of the Chinese overseas tourism market. And I don’t need to tell you that the Chinese middle class is a growing market.
So we are a part of China’s transition.
And China is a part of our transition. A transition to broader based drivers of growth is underway as we leave behind the investment phase of the mining boom.
We can see evidence of this transition in the services sector where employment is growing at its fastest pace in a decade, and services exports are growing strongly, partly in response to the depreciation of the Australian dollar. For example, travel expenditure by international visitors to Australia has increased by around 22 per cent since 2013.
Australia’s labour market is more flexible than in the 1980s and 1990s. This flexibility is supporting the movement of workers to industries and locations where there is greatest demand. For example, employment is shifting away from mining and manufacturing towards services such as health.
The transition is having different effects across states, and boosting economic outcomes in some areas that felt the positive impacts of the mining boom less directly. On a number of measures NSW and Victoria in particular appear to be benefiting, with strong employment growth, and strong services sectors buoyed by growing demand for healthcare by Australia’s ageing population, and demand for education from Asia’s growing middle class.
But another less obvious transition is also underway in the Australian economy – our relationship to the oil price.
The price of oil has fallen by around 70 per cent since mid-2014, driven by increases in global oil supply.
Australia is a net importer of oil and petroleum products, and our economy benefits from lower oil prices, particularly through lower fuel prices which benefit Australian households and businesses.
But the oil story for Australia grows a bit more complex going forward. As our enormous LNG projects come on line, production will ramp up and Australia will become a net exporter of oil and gas combined.
And since the price of LNG broadly moves in line with the price of oil, in the future a low oil price will not be so unambiguously positive for Australia.
So what?
First, Australia continues to benefit from the investment phase of these LNG plants. The construction of these projects alone is estimated to exceed $200 billion, and this does not include the substantial ongoing investment that will be needed to maintain these projects throughout their long production lifespans.
As production at these plants ramps up, LNG exports will contribute significantly to GDP growth by 2017-18. Long-term contracts are in place for this increasing supply of LNG. But the price at which these contracted volumes will be sold is still expected to be broadly linked to movements in the price of oil. And so, as a net exporter of oil and gas, lower oil prices will damp our nominal GDP growth.
As LNG projects are very capital intensive, the sector will likely have deductions available to them that will reduce their tax liabilities in the short to medium term, even if prices were to recover. And the high level of foreign ownership in the sector will reduce the impact that any profits would have on our national income.
And this brings me back to the relationship between GDP and GNI going forward. There are at least some factors that suggest Australia could continue to find itself in a challenging income growth environment. That would have implications for growth in living standards and government revenue.
Still, there are and will continue to be opportunities for Australia to grow and prosper. Understanding and responding to global trends and getting the macro and micro policy settings right will be crucial.
In the long run, productivity growth will be key in determining our living standards – as each successive IGR has shown.
This means that it will be an important time for economists. But – as ever – it is also a difficult time to forecast the global and Australian economies. Against that background, Treasury has recently conducted a review of its forecasting processes.
My colleague Warren Tease led this review, and I know that some of you would have heard Warren speak at a CEDA event in February1. As Warren foreshadowed, we will release the full review and Treasury’s response to it later today.
Warren agreed with previous reviews that Treasury’s forecasts were unbiased in the long run, and comparable in accuracy to other agencies and private forecasters. But he also noted that we tend to miss turning points, have overestimated real GDP growth in the years since the global financial crisis, and have had biases in our forecasts of prices that have persisted over horizons relevant for policy makers and their advisers.
Now, neither I nor Warren think that we’re alone among forecasters in that regard.
But we do want to do what we can to attempt to improve our forecasting. Some of the actions that we are undertaking include:
- engaging a panel of external experts to help us to consider a range of quantitative forecasting techniques that could be added to our toolkit;
- expanding our already extensive business and private sector economist liaison program to talk more with private sector commodity analysts;
- attempting to understand more deeply the impact of financial sector developments on our forecasts; and
- increasing the use of economy wide modelling.
Adopting these measures may or may not improve the accuracy of our ‘point estimate’ forecasts. But they will improve our understanding of the risks around the forecasts – and an understanding of the risks is as important for policy making as the point estimates.
This heightened understanding of risks will continue to be important as the global economic transformations already underway continue to unfold.
1 Available at
http://www.treasury.gov.au/PublicationsAndMedia/Speeches/2016/Forecasting-tsy