Downloads
Thank you for inviting me to speak here today. This, the second NatStats Conference, provides a great opportunity for those of us who work with statistics to come together, share knowledge and promote the use of statistics to a wider audience.
I would like to start with a quote from the Report by the Commission on the Measurement of Economic Performance and Social Progress, commonly known as the Stiglitz-Sen-Fitoussi Report. The Commission’s agenda is to seek to improve conventional economic measures to capture better elements of sustainability and wellbeing. It is also providing some sense of the complexities and challenges of seeking these improvements.
The quote from the Stiglitz-Sen-Fitoussi Report reads
... what we measure shapes what we collectively strive to pursue — and what we pursue determines what we measure1
This is an excellent summary statement of what this conference is about.
What we measure, and how we measure it, matters. Our society’s values and goals — as well as the challenges that we collectively face — also matter because they are drivers of what we measure.
Hence, the work of the Commission, and related work along similar lines by others, such as the Australian Bureau of Statistics (ABS) and the OECD, is essential reading, especially for policy advisers.
I will start my address today by providing a Treasury perspective on some important trends and challenges likely to affect Australia into the future.
Having outlined those trends and challenges, I then want to explore the importance for policy efficacy of a careful consideration of the links between objectives, conceptual frameworks and statistics. I will be making some observations about how we use statistics, including on the importance of making better use of the data and information that we already have.
Challenges facing the Australian Economy
At the risk of understatement, these are remarkable times for those interested in public policy.
Australia is facing some key economic challenges that are likely to have profound impacts on the economy, and indeed Australian society, for decades to come. These include international developments such as the rise of China and India in an increasingly globalised world; an ageing and growing population; technological change; and climate change.
I have spoken publicly about these trends on other occasions, but it is worth revisiting them today, as we ask ourselves what it is that we should be measuring that might prove of enduring value in shaping the policy debate for some time to come.
These trends are interacting with a set of immediate challenges facing us today as a result of market, social and government failures. Again, these will not be unfamiliar to you. They include:
- disincentives and barriers to work;
- areas of entrenched disadvantage, particularly those facing Indigenous Australians and those with a mental illness;
- barriers that prevent scarce resources from being allocated to their most productive and socially valuable use;
- an inefficient, and unsustainable, use of water resources;
- issues in housing affordability, congestion and the liveability of our cities; and
- less than fully developed mechanisms for public infrastructure planning and delivery.
Continuing globalisation and the growth of China and India
Notwithstanding the most serious financial crisis since the Great Depression, the global economy will continue to become more integrated, with increasing cross border trade, more seamlessly interlinked capital markets, increasing technological transfers and more competitive markets for internationally traded goods and services.
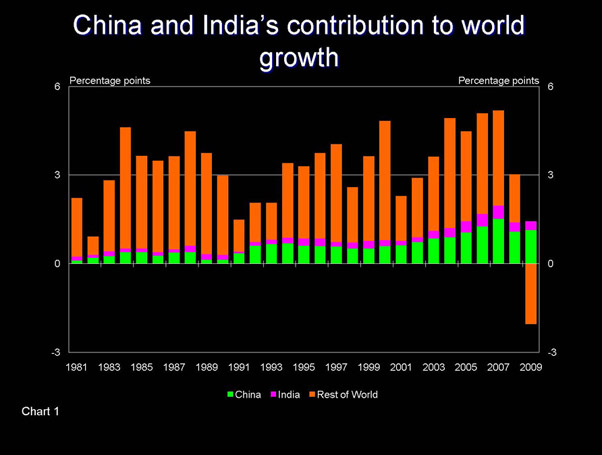
The re-emergence of China and India is now one of the key drivers of world economic growth.
Chart 1 — China and India’s contribution to world growth
Increasing globalisation matters to Australia for a number of reasons.
First, and most dramatically, the resource intensive nature of China and India’s growth, reflecting their stage of economic development, represents a very large shock to the Australian economy.
Australia’s terms of trade, a measure of the average price of our exports relative to the average price of our imports, is at historically high levels. That has obvious benefits for the nation, since it means that our aggregate purchasing power, measured by real wealth or real income, has increased. This is reasonably well understood. Not so well understood is the fact that, increasingly, as mineral resources account for a growing share of exports, our exports deplete our real wealth at the same time as they enhance measured real income. Other impacts of a strong terms of trade are not well understood either. For example, it is not well appreciated that in response to higher terms of trade, there will be a shift in economic activity towards mining and related sectors, with scarce labour and other factors of production being drawn away from other sectors involved in international trade. And there will be distributional consequences, some at a geographical or sectoral scale.
Just one source of the distributional consequences is the impact of higher terms of trade on the relative rates of growth of real wages and the real returns to capital; the latter being favoured.
Secondly, the increasing integration of economies and financial markets is also affecting the potential magnitude, speed and transmission of shocks originating outside of Australia. The recent financial crisis underlines the importance of understanding how international developments may affect the Australian economy.
Thus, our need for statistics extends well beyond what we can produce in Australia.
We have a strong interest in the quality of statistics in numerous countries. In some of those countries, the production of high quality statistics poses a considerable challenge. In China, for example, the task is made difficult by that country’s size and diversity, and the fact that it is undergoing major transition. Nobody should be surprised that statistics on the Chinese economy fall short in a number of areas.
Even so, in light of China’s growing economic influence, improvements in the quality, coverage, transparency and timeliness of its statistics will be of increasing value globally.
China recognises the importance of improving its national statistics. Progress has been made on many fronts over the years. It is noteworthy that China’s National Bureau of Statistics has been working in close cooperation with the OECD and other international organisations to enhance the comparability of its statistics with OECD norms and practices.
As an aside, I might observe that this example serves as a reminder to us that it is easy to take the quality and scope of statistics produced by the ABS and others for granted. It is all too easy, and common, to focus on gaps and errors and lose sight of the strong and well deserved international reputation enjoyed by Australian statistics.
My central point, though, is that in an increasingly globalised world, national statistics have something of the character of a global public good. And, as with all public goods, there is a risk of under-provision.
An ageing and growing population
The projections in the Government’s most r
ecent IGR highlighted some of the implications of an ageing population. Ageing is a consequence of a major decline in birth rates in the 1960s and 1970s and increasing life expectancy. The IGR projected that, by 2050, over 5 per cent of the Australian population will be 85 years old or more, compared with around 1.8 per cent today.
That changing age profile is likely to have a negative overall effect on the rate of economic growth.
Chart 2 — 3Ps of real GDP per person
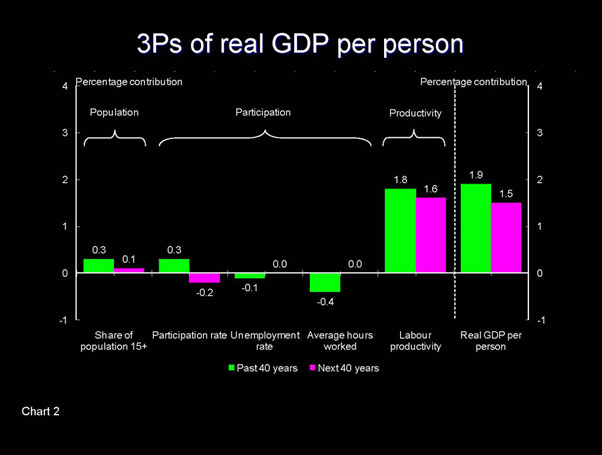
This impact is illustrated in Chart 2, which decomposes annual GDP per capita growth into the ‘3Ps’ of population aged 15 or more; labour force participation, including average hours worked; and productivity.
The IGR projects that while the share of the population aged over 15 will continue to grow, adding marginally to growth, the change in the age profile of that population will be reflected in lower hours worked per capita because of the falling workforce participation rates.
The IGR explores population developments primarily from the perspective of fiscal sustainability and implications for economic growth as conventionally measured. But the implications of such ageing will clearly be multi-facetted.
As you will be aware, public debate has focussed recently on the projected total population. A number of concerns have been raised about the potential positive and negative consequences of an increase in population for the economy, our cities and patterns of settlement, lifestyle and the environment.
Without getting deeply into those debates, it is worth noting in passing that some level of population growth is almost certainly inevitable. Even if net overseas migration were to fall to historically very low levels, we are still likely to experience a sizeable increase in the total Australian population. So these debates are likely to be with us for quite some time. It is clearly in the national interest that such debates be well informed, including by robust statistical analysis.
Technological change
Technological change and innovation, including technological change that has already happened, will continue to transform the economy and peoples’ lives.
Innovation is an important source of productivity growth. The productivity projection presented in Chart 2 is not a forecast. It is simply the average experience of the past 30 years. There is scope to do better than that.
Technological change and innovation expands the production possibilities frontier of the economy — that is, it expands what can be produced for a given quantity of capital, labour and natural resources. Production possibilities define our long-run potential. Equally important, and a focus of the next session today, is that we continue to undertake the reforms that make the most of that potential.
As real incomes rise, whether from a stronger terms of trade or technological change, the pattern of consumption is likely to favour what economists call ‘superior goods’: goods whose consumption increases more than proportionately with income. Such goods include health services and environmental outcomes.
Thus, reflecting again on the IGR, a substantial slice of the fiscal pressures identified there are due to an increased demand for publicly funded health services. Partly, this is a consequence of new technologies. But it is also a consequence of increased demand as real incomes rise.
Technological change and innovation have broader impacts than what might be measured in the National Accounts and budget statements of course. For example, the internet is having profound effects on how we access, intermediate and aggregate information. And it is impacting the development of social and community relationships in interesting, and sometimes challenging, ways.
Climate change
According to the latest IPCC report, it is very likely that, in the coming decades, there will be significant climate change. That change will force adaptation.
The costs of adaptation — again on the scientific advice available to us — are likely to be very large, absent efforts internationally to mitigate climate change.
The means by which we seek to mitigate climate change will also be important. And regardless of how it is done, any significant reduction in greenhouse gas emissions will require a major change in the structure of domestic and international economic activity. But there are more or less damaging ways of achieving any amount of abatement.
How we approach climate change, technological change, population ageing and globalisation will determine our economic performance and, in consequence, our ability to satisfy the material aspirations of future generations of Australians.
But, policy needs to consider broader metrics than this.
Implications of these challenges
Each of the four trends to which I have referred pose a different set of challenges and opportunities. But each will drive pronounced and challenging structural change in the Australian economy.
Structural adjustment will entail costs for some, and transitional change for many.
It will be important to ensure that the economy is flexible enough to adjust. But, at the same time, we will need to protect the most vulnerable and disadvantaged. This will not be easy.
Ensuring we have the correct metrics to identify appropriate policy responses will be crucial to meeting the challenges.
Policy objectives and measures of progress

Many of you will be familiar with the metaphor used to characterise the way economists use data: about the drunk looking for his keys under the lamp post because that is where the light is.
Metrics can influence views as to what policy objectives should be. We know that there are limitations on the availability and quality of data, and methodologies and techniques for turning data into meaningful and useful information. But we should take care not to allow these limitations to become barriers to developing policy.
Returning to the earlier quote, the metrics we use to measure our goals affects the path we take to reach our goals. It is therefore important that we understand the metrics we adopt, and that we appreciate their limitations. A classic example has been the use of GDP as a measure of economic wellbeing or progress.
As the Stiglitz-Sen-Fitoussi report acknowledges, we have long been aware of the limitations of GDP as a measure of progress. Indeed, the co-founders of national accounts — Simon Kuznets and Australian economist Colin Clark — were well aware of their limitations, particularly as a measure of progress.
For example, GDP does not adequately measure non-market production, such as the quality and quantity of government services.
And GDP deals poorly with environmental matters. Of course, GDP is not the only metric available to policy makers.
But, difficulties in measuring the value of market consumption and wealth notwithstanding, in a world with readily available market measures of things like employment and commercial asset values, the lack of similarly accepted measures of the value of the environment creates the risk that society will fail to get the balance right.
The lack of market prices for the flow of ecosystem services and biodiversity means that the benefits we derive f
rom these goods (often public in nature) can be neglected or undervalued in decision-making by private agents and even communities and governments.
Addressing market failures in the allocation of environmental resources is a classic problem of economics, not just one for environmental experts.
Currently, there is a renewed global focus on the valuation of non-market contributions to wellbeing. I would like to mention one stream of work that I find to be of particular interest.
The Economics of Ecosytems and Biodiviersity (or TEEB) study, hosted by the United Nations Environment Programme, is an international initiative to draw attention to the global economic benefits of biodiversity; to highlight the growing cost of biodiversity loss and ecosystem degradation and to draw together expertise from the fields of science and economics in developing practical proposals for action.
TEEB released an interim report in May 2008, which provided strong evidence for significant global and local economic losses and human welfare impacts attributable to the ongoing losses of biodiversity and degradation of ecosystems.
The second phase of the study is expected to be completed in October 2010. It is focusing on: developing a framework and methodology for ecosystem valuation; developing ‘toolkits’ for sustainable development for policymakers at all levels; and raising public and business awareness and access to information and tools for sustainable development and conservation.
I for one am keenly waiting to read their findings and to see what methodological progress they have been able to make in what is a difficult area of measurement.
I am not suggesting that measures of GDP are not useful — GDP remains a useful measure of market production. But confusing market production with progress, or ignoring distributional issues by focusing on aggregate or per capita measures of production and income, runs the risk of misinforming policy makers. Not only does it provide an inadequate measure of community wellbeing, it can lead to policy decisions that are detrimental to wellbeing.
A sophisticated understanding of “ends”, goals or objectives is extremely important. Just as important is an understanding of “means”: of how we might go about pursuing our goals.
Theory provides frameworks for how we perceive the world and how we might adjust it. Theory provides guidance on how we might move beyond correlation to establishing causation.
But theory without evidence can only achieve so much. Data and theory combine to develop evidence.
Evidence-based policy improves the reliability of advice concerning the efficiency and effectiveness of policy settings and alternatives. Knowing what works, and what does not work, is far better than fumbling around in the dark hoping to find the lost keys. It also means that we can avoid the temptation to look for the keys in the place that happens to be illuminated. Importantly, while data are important, it is information that matters.
Data without theory can be dangerous.
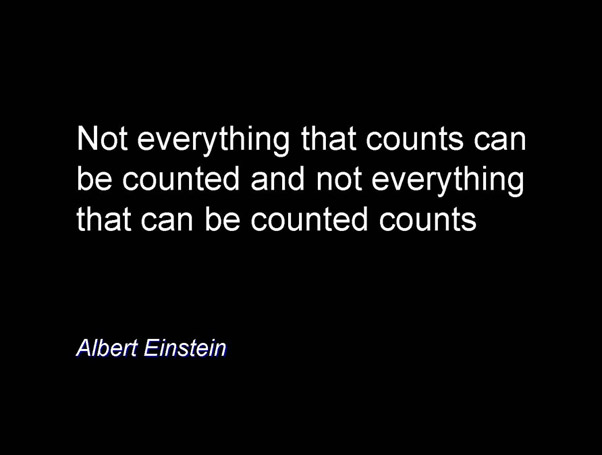
As the words of Einstein remind us:
“Not everything that counts can be counted and not everything that can be counted counts”.
Data collection should, therefore, be guided by theory. Specifically, data collection should permit the theory to be tested — falsified, if you like.
This is how the evidence base for policy should be developed.
Making best use of available information
Using numbers
Theoretical analysis supported by statistical evidence can be extremely powerful in garnering political and community traction for policy change.
But statistics and metrics can just as easily be misused. Just because a piece of analysis contains numerical support does not mean we ought blindly to trust the analysis.
The way in which statistical information is presented can also affect the public’s interpretation of it. The field of behavioural economics provides key insights into how individuals process information at hand.
For example, subjective judgements of risks are influenced by the way in which information is presented. A study of undergraduates at the University of Washington found that anchoring and base-rate neglect affected the magnitude judgement of riskiness.2,3
The study found that students would judge a risk more serious when fatalities were expressed by larger frequencies using larger numbers rather than by smaller frequencies. For example, 1,286 out of 10,000 - a 12.86 per cent mortality rate - is judged as more risky than 24.14 out of 100 - a 24.14 per cent mortality rate.
Consideration as to how information is framed is clearly important when delivering a message.
Who are the users?
When we say ‘what we measure affects what we do’, it is worth taking a moment to ask who is the ‘we’.
It would generally be accepted that an informed community is an important part of a well-functioning democracy — engaging the community in progress measurement strengthens their democratic capacity.
Drawing on Amartya Sen’s increasingly influential “functionings” or capabilities approach — people’s capabilities4 can be enhanced by public policy, and the direction of public policy can be influenced by the effective use of the participatory capabilities of the public.
Public trust in official statistics, general levels of statistical literacy and community engagement determine how powerful metrics are in informing public debate and in underpinning public accountability. These are important also in determining how statistics are used to measure progress and in enhancing policy credibility by affirming that what matters really is being considered in policy deliberations.
Even so, there is a sizeable gap between statistical measurements, and citizen perceptions, of socio-economic phenomena –for which there is no single explanation.
Work by the European Commission found that only 46 per cent of Europeans trust official statistics.5 If the community does not trust the statistics used to inform decision making, a sense of alienation from, and scepticism towards, political and democratic processes would not be surprising.
Chart 4 — People's knowledge of official measures of economic performance
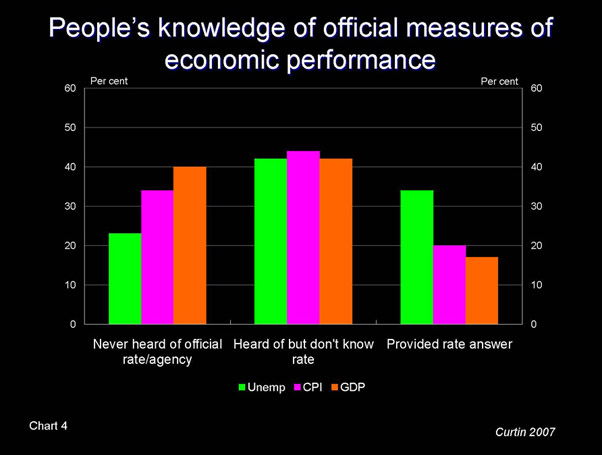
Scepticism aside, basic awareness of statistics is also an issue. A study from the US looking at people’s knowledge of official measures of economic performance found that 40 per cent of Americans had never heard of official GDP data or the source agency, 34 per cent had never heard of the official CPI figures and 23 per cent had never heard of the official unemployment figure.6
The role of intermediaries in disseminating information is a key factor influencing both trust and awareness of official statistics — for example, if some people turn to the media as their main source of information, the quality of media is a crucial factor in shaping public debate.
Chart 5 — Where do people get information from?
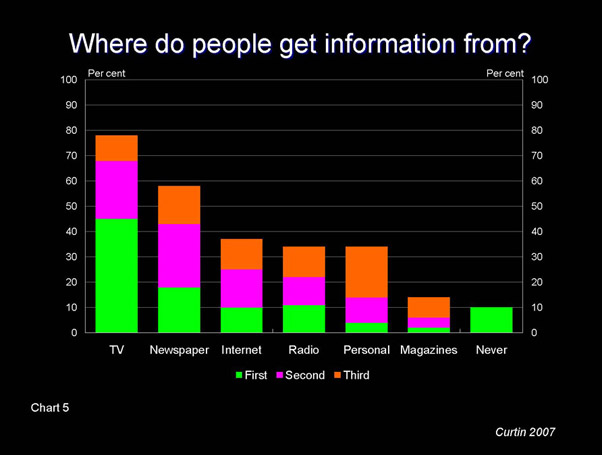
In the US for e
xample, the study mentioned earlier found that the dominant source of information on economic statistics was television, reported by nearly half of all people surveyed as their first choice, and by nearly three-in-four people among their top three choices.7
It is difficult to be optimistic about the quality of the information people get from these sources. While there are some exceptions, much of television and newspaper reporting on economic news, contain little more than a passing reference containing no detail, apart from a one-word summary that the news was ‘good’ or ‘bad’ – or that whilst Joe Bloggs claimed the data were good news, Fred Smith claimed they were bad news. I am therefore pleased to note that the NatStats Awards to be announced tonight include a category for excellence in the use of statistics in the media.
Sources of data and information
When it comes to sources of data and information, we don’t need to reinvent the wheel. A better understanding of how existing measures have been constructed and the appropriate use of these measures can provide rich analysis.
Better exploiting existing knowledge
It is also true that in some cases data exists but access to it is limited. In the report into Australia’s Future Tax System (AFTS), the panel argued that data on the tax system should be thought of as a public good and should be freely available8. Currently, unbiased and systematically collected data on the tax system, based on accepted methodologies appropriate for tax policy purposes, are rare and often not available in the public domain.9
Data on the transfer system are more readily available than tax data.10
Research undertaken using social security data has generated many insights that have fed into policy development, including information on the persistence of welfare dependence among specific groups, the ‘transmission’ of welfare dependence between generations, the responsiveness of different groups to policy changes, and the effectiveness of policies in achieving their intended outcomes.
Data, data everywhere but not a series to use
Data and information can be obtained from a wide range of places, not just official statistical bodies, issues of credibility and quality notwithstanding. A key role of the ABS and other statistical bodies is to set standards in conceptual frameworks for generating data and statistics, not necessarily producing and publishing all data themselves.
Sometimes the emergent pictures from alternate sources are contested, and this is a good thing. Informed public debate about issues that matter ought to be strongly encouraged.
In other cases, credible data exists, but are either overlooked or given insufficient weight.
The global financial crisis provides a case in point.
Chart 6 — Financial market data
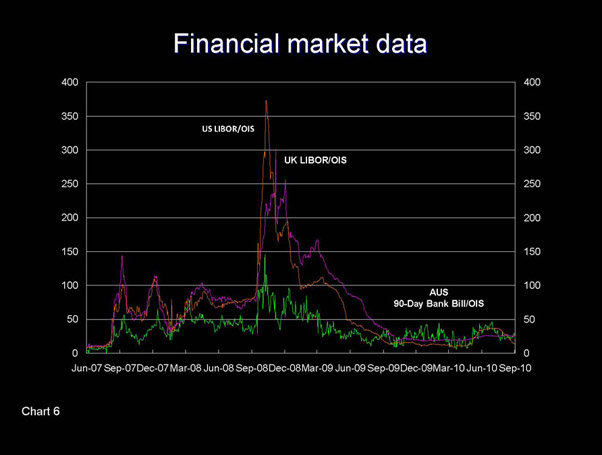
This chart shows that spreads on financial instruments – a measure of perceived risk – widened appreciably in the second half of 2007.
As the GFC intensified, particularly in the immediate aftermath of the fall of Lehman Brothers, the ‘hard’ data on the Australian economy were still robust. GDP growth was slowing but still positive at over 2 per cent11, unemployment was around 4 per cent and inflation was above target, at around 5 per cent.
Market data were a necessary part of understanding how the crisis was playing out, in advance of the impact being able to be ‘measured’ in the core economic data.
Conclusion
Australia is facing some economic challenges that are likely to have profound impacts on the economy and society for decades to come.
Public policy advisers and statisticians face their own challenges. There is a need for better measures of progress. But investing in better measures of progress will not produce better outcomes if those measures are not widely shared and clearly communicated; and more importantly, if the community does not understand them.
Forums such as this provide a way of reaching wider audiences.
I would encourage you over the next two days to engage actively and participate fully in the debates and discussions, and give some thought to how you might implement some of the ideas canvassed here.
1 Stiglitz, J. E., Sen, A. and Fitoussi J-P. 2009, Report by the Commission on the Measurement of Economic Performance and Social Progress, Commission on the Measurement of Economic Performance and Social Progress, p. 9
2 Yamagishi, K. 1997, 'When a 12.86% Mortality is More Dangerous than 24.14%: Implications for Risk Communication', Applied Cognitive Psychology, vol. 11, pp 495-506.
3 Anchoring occurs when people make estimations by starting from an initial value that is then adjusted (typically insufficiently) to yield the final answer. Base-rate neglect occurs when people fail to take into account the prior probability of the outcome when processing information (Tversky, A. and Kahneman, D. 1974, 'Judgement under Uncertainty: Heuristics and Biases', Science, vol. 185, pp. 1124-1131).
4 Capabilities are the ability of a person to achieve different combinations of functionings — the various combinations of things a person may value and have reason to value doing or being — reflecting the opportunity or freedom to choose a life that a person values (Sen, A. 1999, Development as Freedom, Oxford University Press, Oxford).
5 European Commission 2008, Europeans' Knowledge of Economic Indicators, Special Eurobarometer, April 2008, available at http://ec.europa.eu/public_opinion/archives/ebs/ebs_special_eco_ind_en.pdf.
6 Curtin, R. 2007, 'What U.S. Consumers Know About Economic Conditions', OECD World Forum on Statistics, Knowledge and Policy, Istanbul.
7 Ibid.
8 Volume 2, Chapter G5
9 In the past, Australian tax unit record files have not been generally available for research purposes. However, in 2009 the ATO produced and released a confidentialised 1 per cent sample file containing individual tax return information. Over time, expanded availability of this, and similar data for other taxes, would allow deeper analysis of the individual-level effects of the tax system.
10 Confidentiality and privacy concerns are addressed by providing de-identified data under strict terms relating to its use and safe storage.
11 September quarter National Accounts, ABS cat. No. 5206.0, 2.3 per cent through the year growth.