This chapter provides background information on the Australian debt market. The first part of this chapter puts the Australian financial markets in context with global markets. The second part identifies the major participants in the Australian debt market. The final part of the chapter identifies the key infrastructure associated with the debt market.
Australia's financial markets
Australia has well-developed financial markets across major products, including money, debt, equities, foreign exchange and derivatives. These market sectors are not large compared to equivalent markets in economies such as the United States (US) or Japan. However, trading activity in many Australian financial market sectors is higher than the size of the economy might indicate. For example, Australia's largest market sector is the foreign exchange market. The Australian dollar is the seventh most actively traded currency.
The Australian debt market is relatively small on a global scale. The global market is dominated by the US dollar market (around 50 per cent), the euro market (around 30 per cent) and the yen market (around 15 per cent). That said, Australian dollar denominated debt is included in several key global indices used by institutional investors. (These indices typically are weighted according to the volume of outstanding debt.) Australia's share of around 1 per cent is comparable to countries such as Denmark, Sweden, Brazil, China, and the Republic of Korea.
Australia's debt markets
Debt securities are an obligation by one party to make payment(s) to another party in the future. These securities take various forms. However, in general, they have a fixed maturity date on which the debt must be repaid, and they pay some form of interest. The level of interest paid may be either fixed or variable, although long-term debt tends to have a fixed rate of interest.
Participants in the Australian debt market include issuers of debt (groups that use the market as a source of funding), and investors in debt (groups that hold debt securities as assets). Three broad groups issue debt in the Australian debt market: the Commonwealth government, State/Territory governments and corporates. Chart 2 shows the proportion of fixed coupon bonds on issue according to the issuer type. Each of the three issuer groups account for around one-third of the total $155 billion fixed coupon bonds outstanding.
[caption id="attachment_40132" align="aligncenter" width="501"]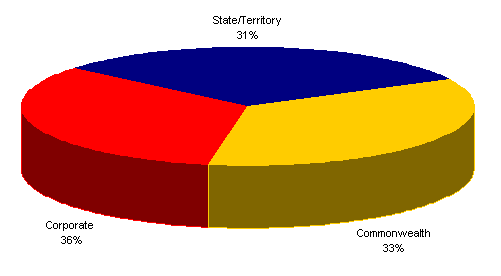 Chart 2: Fixed coupon bonds outstanding by issuer type (June 2002)[/caption]
Source: Reserve Bank of Australia, 2002 (unpublished).
Commonwealth Government Securities
Commonwealth Government Securities (CGS) includes all debt issued by the Commonwealth.
The Commonwealth currently uses three debt instruments: Treasury Fixed Coupon
Bonds, Treasury Indexed Bonds and Treasury Notes. Details of all CGS outstanding
in Australian dollars in recent years is shown in Table
1.
[caption id="attachment_40133" align="alignnone" width="509"] Table 1: Commonwealth Government Securities outstanding[/caption]
(a) Net of Commonwealth holdings and debt on issue for the States and Territories.
Source: Australian Office of Financial Management, 2002.
Gross outstanding CGS has fallen from a peak of around $106 billion in 1997 to around $62 billion. Treasury Fixed Coupon Bonds outstanding are around $50 billion. To date the Government has managed this reduction while maintaining the viability of the CGS market and its supporting infrastructure.
Treasury Fixed Coupon Bonds
Treasury Fixed Coupon Bonds account for around 80 per cent of CGS outstanding. With these securities:
- the face value or capital value is repaid at maturity;
- holders receive coupons semi-annually; and
- trade is on the basis of yield to maturity.
The profile of benchmark Treasury Fixed Coupon Bonds outstanding at June 2002 with their coupons and maturity dates is shown in Chart 3. There are 11 benchmark securities that have a range of maturities extending to April 2015. The average volume outstanding in these key benchmark securities is close to $5 billion.
[caption id="attachment_40134" align="aligncenter" width="492"]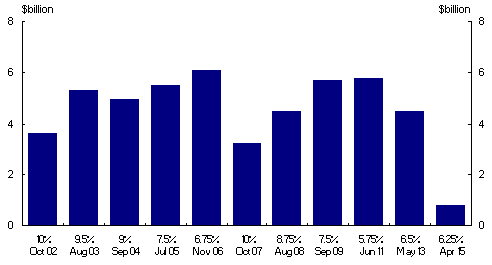 Chart 3: Benchmark Treasury Fixed Coupon Bonds outstanding (June 2002)[/caption]
Source: Australian Office of Financial Management, 2002.
The Government has weighted recent issuance towards securities with an initial term to maturity of between 11 and 13 years. This weighting towards the long end of the yield curve helps maintain the length of the Commonwealth yield curve. This financial year, the Government is expected to concentrate issuance in the April 2015 security.
Issuance of relatively longer dated securities reflects the Government's comparative advantage in borrowing for longer periods. The Commonwealth is the highest rated issuer in the country, and all major rating agencies give it the highest possible rating. This reflects the Government's capacity to raise taxes to service debt funding needs.
Treasury Indexed Bonds
Treasury Indexed Bonds guarantee holders of these securities a real rate of return. The coupon and capital for these securities is linked to a measure of inflation (Consumer Price Index). The volume of these securities outstanding is currently $6.4 billion or around 10 per cent of total outstanding CGS. Outstandings are concentrated into four benchmark securities (Chart 4).
[caption id="attachment_40135" align="aligncenter" width="492"]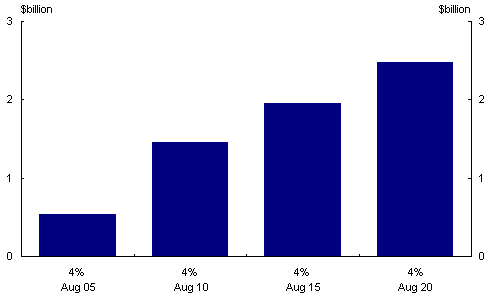 Chart 4: Treasury Indexed Bonds outstanding (June 2002)[/caption]
Source: Australian Office of Financial Management, 2002.
Treasury Notes
Treasury Notes are the third form of CGS the Government currently issues. Treasury Notes are short-term securities that assist in managing the Government's within-year funding requirement. This within-year funding requirement arises because the timing of the Commonwealth's revenue does not exactly match the expenditure profile.
The Government also uses short-term deposits to assist in managing the within-year funding requirement. When the Commonwealth has surplus funds, it places these funds on deposit with the Reserve Bank of Australia (RBA). The deposits earn a rate of return broadly similar to interest paid on Treasury Notes.
The Government's within-year funding requirement varies considerably (Chart 5). The volume of Treasury Notes outstanding ranged between $3 billion and $6 billion during 2001.
[caption id="attachment_40136" align="aligncenter" width="492"]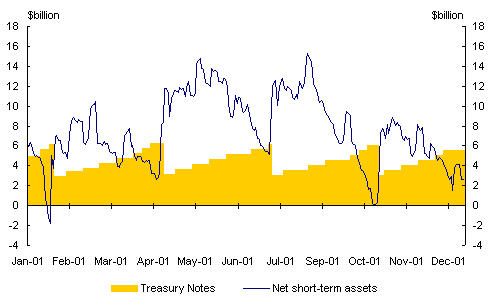 Chart 5: Net short-term assets and Treasury Notes outstanding in 2001[/caption]
Source: Australian Office of Financial Management, 2002 (unpublished).
Investors in Commonwealth Government Securities
A wide range of domestic and international investors hold CGS. The Australian market has a relatively high level of non-resident participation with holdings ranging from 30 to 40 per cent in recent years (Australian Bureau of Statistics, 2002a). This position has changed significantly in the past 20 years. Previously, the market was heavily oriented towards a domestic investor base, with explicit prohibitions on the capacity of non-residents to invest in CGS.
Banks and financial intermediaries hold around 10 per cent of outstanding CGS for purposes including meeting prudential requirements, holding an inventory of stock to assist trading, and hedging market risks associated with various transactions.
Pension funds hold around 20 per cent of outstanding CGS as a low risk long-term asset to match against their long-term liabilities. Similarly, insurance companies hold around 20 per cent to invest premiums in long-term assets to match the likely maturity of their policies.
The RBA has historically held around 15 per cent of outstanding CGS to facilitate its open market operations to implement monetary policy and contribute to financial system stability. In recent years, the RBA has reduced its reliance on outright purchases of CGS to implement monetary policy. (See Chapter 3.)
State and Territory government bonds
State and Territory government bonds account for around $48.5 billion, or 31 per cent, of total fixed coupon bonds outstanding. The dominant issuers are New South Wales, Victoria and Queensland. In each State and Territory, a central borrowing authority (CBA) borrows on behalf of relevant government public sector authorities and entities. Centralising the funding needs of these borrowers provides a more efficient source of funding than if each entity individually sourced funds.
CBAs use a range of funding instruments but fixed coupon bonds tend to be the primary security issued. The combination of all State and Territory bonds outstanding broadly matches the maturity profile of outstanding Commonwealth bonds. There is around $4 billion of State and Territory bonds that will mature in each financial year extending for a period of around ten years (Chart 6).
[caption id="attachment_40137" align="aligncenter" width="492"]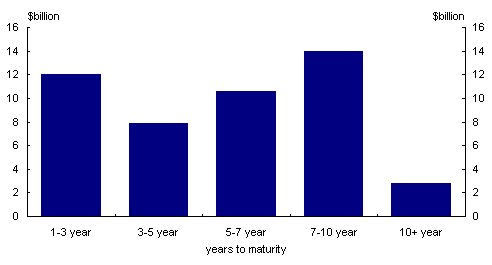 Chart 6: State and Territory bonds outstanding (June 2002)[/caption]
Source: Salomon Smith Barney, 2002.
Corporate bonds
The volume of fixed coupon corporate bonds outstanding was $55 billion, or 36 per cent, of total fixed coupon bonds outstanding at end June 2002 (Reserve Bank of Australia, 2002). Around 150 non-government securities are included in the Salomon Smith Barney Broad Investment Grade (AusBIG) Index (Salomon Smith Barney, 2002). The average amount outstanding in any particular security is around $300 million - larger securities have around $1 billion outstanding.
Financials and non-residents issued around two-thirds of corporate bonds outstanding (Chart 7).
[caption id="attachment_40138" align="aligncenter" width="496"]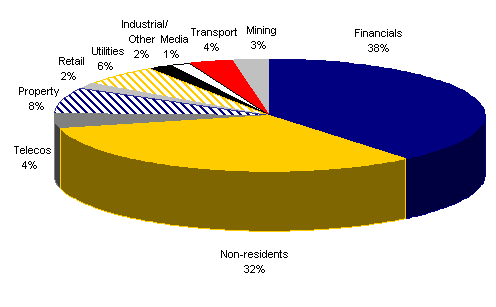 Chart 7: Corporate bonds outstanding by issuer[/caption]
Source: Reserve Bank of Australia, 2002 (unpublished).
A growing number of non-financial corporations are issuing bonds to take advantage of investors' demand for higher return debt instruments and to diversify their funding away from bank loans and short-term debt.
The maturity profile of outstanding corporate bonds tends to be heavily concentrated in bonds with less than five years to maturity (Chart 8). More recently, the maturity profile has lengthened due to increasing demand by domestic investors for these types of securities.
[caption id="attachment_40139" align="aligncenter" width="492"]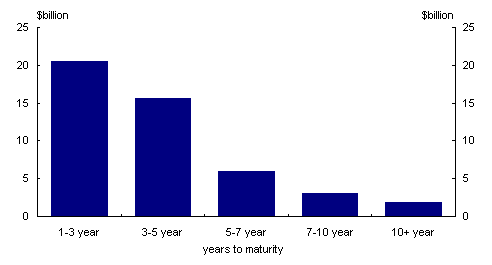 Chart 8: Maturity profile of corporate fixed coupon bonds outstanding (June 2002)[/caption]
Source: Salomon Smith Barney, 2002.
In addition to the fixed coupon bonds issued by the corporate sector, corporates also issue floating rate securitised debt. Around $42 billion of securitised debt was on issue in Australia as at June 2002 (Reserve Bank of Australia, 2002). Securitising underlying assets into a pool of assets provides a marketable security from a disparate group of assets. For example, mortgage originators pool a large number of household mortgages, and then sell a security to another financial market participant.
Debt issuance trends
In recent years, the volume of corporate debt outstanding has risen while the volume of Commonwealth debt outstanding has fallen (Chart 9).
[caption id="attachment_40140" align="aligncenter" width="492"]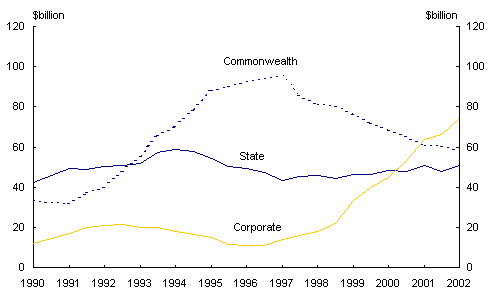 Chart 9: History of outstanding bonds[/caption]
Note: The figures for the Commonwealth include indexed bonds and exclude the Commonwealth's own holdings. Corporate estimates include floating-rate bonds but exclude asset-back securities.
Source: Reserve Bank of Australia, 2002.
Numerous factors contribute to this trend, some international and some domestic. In 1996, the Commonwealth Government committed to maintaining budget balance, on average, over the economic cycle. The Government has met this objective, and in net terms, has not borrowed since 1996.
The decline in the supply of government securities has coincided with strong growth in funds under management. Compulsory contributions to superannuation funds by employers (through the Superannuation Guarantee) and voluntary contributions by employees drive this growth.
This demand for assets combined with reduced CGS on issue has stimulated corporate borrowers to issue debt securities. Non-resident issuance into the Australian market (known as Kangaroo bonds) also has increased. Kangaroo bonds outstanding are now around $18 billion.
Turnover of fixed coupon corporate bonds is much lower than Treasury bonds. In fact, turnover of Treasury bonds is at least four times higher than for corporate bonds, despite similar amounts outstanding (Chart 10). Turnover of corporate bonds tends to be concentrated in a small subset of total outstandings. This subset tends to have greater volumes outstanding and be issued by domestic financial institutions.
[caption id="attachment_40141" align="aligncenter" width="492"]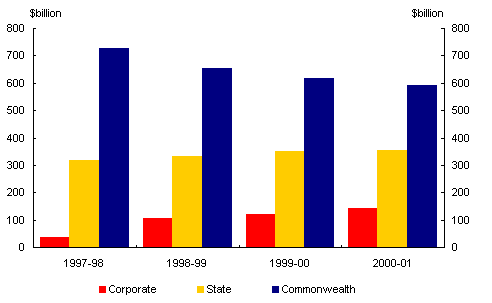 Chart 10: Turnover in Australian fixed coupon debt markets[/caption]
Source: Australian Financial Markets Association, 2001a.
The reduction in Treasury bonds outstanding has reduced turnover in recent years, and subsequent consolidation in the number of market-makers dealing in government securities. However, this segment of the domestic bond market remains the most liquid.
Associated market infrastructure
Well functioning markets require a range of supporting infrastructure, including associated markets such as derivative markets, efficient clearing/settlement systems and a sound regulatory regime.
Derivative markets
Participants in Australia's debt markets have access to some of the most liquid and sophisticated risk management tools anywhere in the world. Derivatives markets allow market participants to fix today the prices at which trades will be made in the future. Efficient derivatives markets provide a vehicle for financial market participants to manage their interest rate risk - the risk that future interest rates will differ from today's interest rates. Accordingly, the availability of these markets promotes market turnover, as intermediaries and investors are more willing to buy and sell physical bonds.
Treasury bond futures contracts
The Sydney Futures Exchange offers a range of derivative instruments relevant to the debt market and is one of the Asia-Pacific region's largest financial futures and options exchanges. The primary instruments offered for trading and hedging physical bonds are the three-year and ten-year Treasury bond futures contracts. These contracts rely on the existence of appropriate government bonds. (See `Managing financial risks'.)
Turnover of Treasury bond futures has held up well in the face of declining Treasury bonds outstanding and is substantially larger than turnover in the Treasury bond market (Chart 11).
[caption id="attachment_40142" align="aligncenter" width="492"]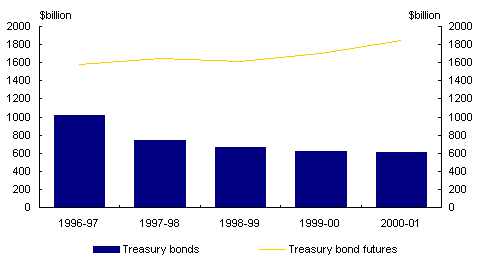 Chart 11: Turnover of Treasury bonds and Treasury bond futures contracts[/caption]
Source: Australian Financial Markets Association, 2001a.
Interest rate swaps
The interest rate swap market is an integral part of the debt market. Turnover in the swap market has grown rapidly in recent years. Turnover was around $1,000 billion, excluding the overnight indexed swap market, considerably more than CGS turnover of around $600 billion in 2000-01 (Chart 12). Swaps enabling institutions to swap between fixed and floating rate exposure account for around $650 billion of market turnover. Around 80 per cent of interest rate swaps outstanding have a maturity of five years or less (Australian Financial Markets Association, 2001a).
[caption id="attachment_40143" align="aligncenter" width="492"]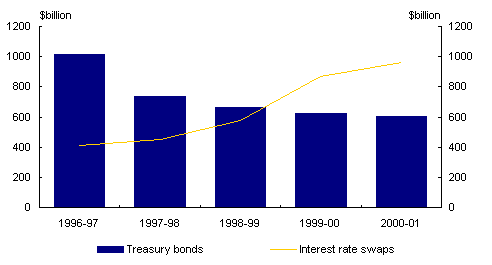 Chart 12: Turnover of Treasury bonds and interest rate swaps[/caption]
Source: Australian Financial Markets Association, 2001a.
Repurchase agreements
Australia also has highly developed and liquid markets for repurchase agreements (repos). These agreements involve the sale (purchase) of a bond with an agreement to buy (sell) it back at an agreed price at an agreed future time. Repo markets increase the attractiveness of the underlying physical bond in the hands of investors by providing them with an additional use for the bond. Repos also facilitate market efficiency by increasing participants' access to bonds. This contributes to the liquidity of the debt market and settlement process.
Repo market turnover was around $5,000 billion in 2000-01 (Chart 13). CGS were used as collateral in over half of these transactions. Turnover in repo transactions using Treasury bonds is around five times the turnover in the Treasury bond market itself.
[caption id="attachment_40144" align="aligncenter" width="492"]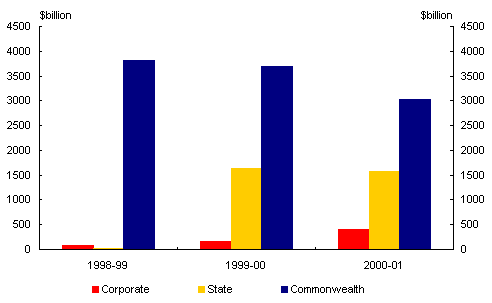 Chart 13: Turnover in the repurchase market by instrument[/caption]
Source: Australian Financial Markets Association, 2001a.
Clearing and settlement systems
Reliable and timely clearing, transfer of ownership and settlement arrangements are essential to the efficient and effective operation of financial markets. A rigorous and reliable clearing and settlement infrastructure allows market participants to undertake bond market transactions without undue risk from default, market, systemic or other broader risks. Accordingly, the effectiveness of such systems affects significantly the development of secondary market activity.
Since the mid 1980s, a move has been towards electronic clearing and settlement arrangements. More recently, a trend has been towards rationalising the number of clearing and settlement service providers, both in Australia and abroad. Since February this year, Austraclear has provided settlement services for trades in CGS, as well as trades in State government and private sector debt securities. Austraclear transactions, and cash transfers in the Reserve Bank Information and Transfer System (RITS) and the SWIFT Payment Delivery System, are settled on a real-time gross settlement basis. Consequently, around 90 per cent of the value of inter-bank obligations arising from financial market and other transactions are settled transaction by transaction across exchange settlement accounts at the RBA.
Regulatory frameworks
Well-functioning financial markets require a regulatory system that clearly defines property rights, has transparent information flows and has a capable regulatory authority. Financial sector regulatory and taxation arrangements are designed to minimise their impact on investment decisions and on market price signals. Australia's prudential framework is at the forefront of best international practice.
The Corporations law includes provisions relating to the trading of government and corporate debt. Most provisions on the obligations of market participants apply equally to the government and corporate bond markets. For example, prohibitions against engaging in misleading and deceptive conduct, false or misleading statements and dealer licensing are imposed equally on participants in both markets.
The legislative framework, in turn, is superimposed on a framework of self-regulation, coordinated by bodies such as the Australian Financial Markets Association. This industry body represents the over-the-counter financial markets on matters such as market codes of conduct and participant standards and accreditation.