The financial system plays a vital role in the Australian economy's performance. By allocating savings to borrowers, and encouraging savings, the financial system plays an important part in the investment process, which primarily determines the economy's future productive capacity (McGrath and Viney, 1997). This appendix examines the macroeconomic implications of changing the size of the Commonwealth Government Securities (CGS) market and associated investment in financial assets.
The CGS market could affect the cost of capital in Australia through two channels. The first is through impacts on the liquidity and efficiency of Australia's financial markets (see Chapter 3). The second is through changes in the supply and demand of financial assets. The following analysis assesses the possible impacts of changes in the supply and demand of financial assets, assuming no systemic change occurs in financial intermediation. Possible impacts on the cost of capital resulting from issues discussed in Chapter 3 are ignored.
The following sections outline the theoretical framework used to assess the likely macroeconomic impacts of changing the size of the CGS market. This framework is highly stylised and simplified.
The appendix then assesses the impact of winding down the CGS market. The final section considers the impact of the Government taking action to maintain the market, examining two possible alternatives. The following analysis does not attempt to quantify the effects, but simply provides guidance on the likely direction of movements in key macroeconomic variables.
Any changes in broader interest rates associated with changes in the supply of CGS are likely to be small, given the size of Australia's financial markets. As such, the broader macroeconomic impacts are likely to be modest. Given other changes in economic activity occurring at any time, the impacts of changes in the CGS market would not necessarily be discernible.
Economic framework
Australia's broad financial markets ensure a wide range of different interest rates (and associated assets). The following analysis assumes interest rates can be grouped into two separate interest rate classes with two distinct functions (see Baily and Friedman, 1991).
The first interest rate is the rate charged on short-term borrowings. Businesses need money at various times to pay for inputs. However, the timing of business revenue does not always match the timing of payments for inputs, resulting in the need to borrow money and, at other times, lend money. The interest rate on money balances will affect the amount of money that a business will hold. The higher the interest rate offered, the greater the incentive for businesses to arrange their affairs to lend funds for as long as possible.
Similarly consumers hold money to undertake transactions. For households, income can be consumed or saved. If interest rates on financial assets other than money increase, the opportunity cost of holding money will rise, so households may be more inclined to defer consumption.
This can be thought of as the demand for money.
The Reserve Bank of Australia (RBA) sets the short-term interest rate as a policy target. The RBA then adjusts the supply of money to match the demand for money to maintain a target short-term interest rate.
The second interest rate is the rate charged on long-term borrowings, determined by the supply and demand for long-term funds. The supply of long-term funds arises from individuals who wish to save to consume later. The higher the interest rate on long-term funds, the greater the incentive for savers to defer consumption as the interest rate is compensation for delaying consumption. Similarly, businesses may choose to save some of their profits (as retained earnings) to invest more in the future.
Investment decisions by businesses, households and governments will determine the demand for long-term funds. Businesses and governments assess the likely revenues generated by a new investment against the cost of undertaking the investment when deciding to undertake a new capital investment project. The cost of borrowing funds is one of the key determinants in the cost of the investment. More projects are likely to be cost effective if interest rates are lower. Households that buy capital goods (including housing) are affected by the cost of borrowing.
This framework is analogous to thinking about the ends of the yield curve - the short end reflects the demand and supply of short-term funds while the long end reflects the supply and demand for long-term funds. The overall level of interest rates can be thought of as an average of the rates in these two markets.
This approach is inconsistent with a pure expectations interest rate hypothesis which links short and long-term interest rates through arbitrage. If there were differences between the two rates, they would be traded away. This approach acknowledges that the short and long funds markets play distinct roles and are not perfect substitutes. Arbitrage will ensure some relationship between short and long-term rates, but supply and demand considerations in both markets will affect the difference between the two interest rates.
In the following analysis, the CGS market forms part of the market for long-term funds.
The demand for Commonwealth Government Securities
A number of recent policy papers10 note the demand for government bonds may be fragmented into several components, so the bond demand curve may not have a uniform downward slope, as depicted in Chart 25.
A key assumption is that two types of investors will purchase CGS. The first type purchases CGS because they play an important role in their portfolio management. Some investors, notably superannuation funds and insurance companies, buy and hold CGS because the revenue streams (coupon payments) from CGS are a very close match to their liability payment streams (see Chapter 3). For example, a life insurance company may sell annuities that require regular annual payments to the beneficiary. For that life company, purchasing CGS provides a safe, regular source of income to match against payments. Very few substitutes may be available for these investors. CGS price changes may not have much affect on these investors' demand for CGS.
The second type of investors actively trade CGS as part of their portfolio management. These investors have many substitutes for CGS, so even small increases in CGS prices will encourage these investors to sell CGS and purchase other assets.
The balance between the two investor groups will affect the overall market demand elasticity. The higher the proportion of active investors, the more elastic the curve. The demand curve for CGS will have a mild downward slope in segments where there are sufficient active investors. This assumption is not crucial to the results of the analysis, since the demand curve remains downward sloping whether passive or active investors dominate.
A horizontal demand curve, as Cooper and Scholtes (2001) suggest, would imply a perfect substitute is available so price increases would lead investors to substitute the other asset for CGS. As it is unlikely perfect substitutes for CGS exist, a downward sloping demand curve seems likely.
[caption id="attachment_40161" align="aligncenter" width="446"]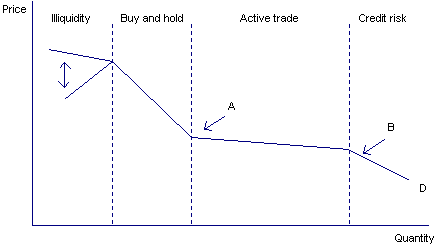 Chart 25: Demand for CGS[/caption]
However, at a point (A in Chart 25), the supply may diminish so much that the `buy and hold' investors begin to dominate the market. As these investors are much less sensitive to CGS price changes, the demand curve would steepen.
Within this framework are two further cases representing the extreme ends of the demand for CGS.
At one extreme (point B in Chart 25), the amount of bonds in the market may begin to add a credit risk premium to the price of bonds. In this case, the volume of CGS on issue may create concerns about whether the Government would default on the debt as the risk characteristics of CGS change. Hence, increases in CGS supply may affect significantly the price, as investors will require a larger fall in CGS prices to induce them to buy more.
At the other end of this curve, very limited CGS supply may generate concerns about liquidity. In this case, decreased supply may encourage bondholders to sell, as they may be concerned that reduced liquidity may reduce their ability to sell easily in the future. Thus, decreased CGS supply may lower the price of remaining CGS. This illiquidity premium may not be sufficient to invert the slope of the demand curve, particularly if 'buy and hold' investors dominate this segment, but may simply reduce the downward slope of the demand curve.
The supply of Commonwealth Government Securities
CGS supply is assumed to be exogenously determined by government policy.
Supply and demand of alternative investments
All non-CGS long-term financial investments are grouped together into one set of `private' assets, including securities other levels of government issue. Private assets are treated as debt instruments, with the standard inverse relationship between price and interest rate, although the results apply for other asset classes. For equities, the interest rate is the rate of return on the equity.
The demand curve for private assets is downward sloping, and CGS are imperfect substitutes for private assets.
The supply of private assets is assumed to be upward sloping. The supply of private assets equates to borrowing to finance the issuer's capital spending. The higher the price received, the lower the interest rate, and the more attractive new capital spending will be to the issuer.
The combination of the supply and demand for CGS, and the supply and demand for private assets determines the average interest rate in the long-term funds market.
Determination of domestic output and the current account
To assess the macroeconomic impacts of changes, these markets need to be incorporated into a macroeconomic model with changes in domestic output, interest rates, and the current account balance. The model amalgamates the IS-MP framework for money and goods market equilibrium, adjusting it for the two different interest rates described earlier, and the BP framework for determining the balance of payments. The model is comprised of the IS relationship, the MP relationship and the BP relationship (Chart 26).
The IS relationship depicts a range of goods market equilibriums for different combinations of interest rates and income (see Blanchard 1997). Domestic output comprises consumption, investment, government spending and exports minus imports. The lower the interest rate, the higher the investment, as more investment projects will be cost effective, and the higher the consumption, as consumers reduce their savings in favour of consumption. Therefore, the lower the interest rates, the higher the domestic output. Exchange rate changes will shift the IS curve, with a depreciation increasing net exports and output for a given interest rate.
The MP relationship depicts the interest rate and output combination determined by the monetary policy stance (see Romer, 2000).11 The RBA sets the interest rate in the short-term money market, taking into account the rate of inflation and domestic output. Generally, higher domestic output leads to higher inflation, and higher inflation causes the RBA to increase interest rates. As a result, the MP curve is an upward sloping relationship between the interest rate and output.
The MP relationship is augmented to include the long-term interest rate (see Baily and Friedman, 1991). While the RBA sets the short-term interest rate, supply and demand for long-term financial assets will determine the long-term interest rate. Thus, the interest rate that affects economic activity is the average of the short and long-term interest rates. This is depicted by the Augmented MP (AMP) curve. This relationship shifts when the difference between long-term and short-term interest rates changes. For example, a fall in the long-term interest rate relative to the short-term interest rate, shifts the AMP curve to the right, reducing the interest rate in the IS-AMP-BP framework for a given level of output. If both short and long-term interest rates change by the same amount (creating a parallel shift in the yield curve), this would be depicted in a move along the AMP curve.
The BP relationship depicts the external sector of the economy, for combinations of output and interest rates (see Appleyard and Field, 1992). The balance of payments comprises the current account (the balance of exports and imports of goods and services and net income flows) and the capital account (the balance of financial capital inflows and outflows). The balance of payments always must balance, so if a deficit on the current account results from higher imports than exports, the capital account must be in surplus; net capital inflow is required to finance the current account deficit.
The BP relationship is a function of the (floating) exchange rate, output and Australian interest rates compared to foreign interest rates. Changes in the exchange rate affect net exports and the balance of payments, changing output for a given interest rate. Changes in output lead to changes in imports, affecting the balance of payments. Changes in domestic interest rates relative to foreign interest rates affect the balance of payments through the capital account.
[caption id="attachment_40162" align="aligncenter" width="460"]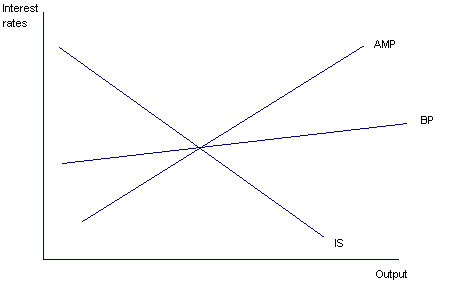 Chart 26: IS-AMP-BP Framework[/caption]
Implications of a diminishing Commonwealth Government Securities market
The following analysis considers a reduced supply of CGS resulting from government fiscal surpluses. The IS curve describes a given level of government spending and taxation, assuming the level of government spending is less than the level of taxation, so the budget is in surplus. As this is a static analysis, a budget surplus does not necessarily imply a contractionary fiscal policy (which is driven by changes in fiscal policy from one year to the next). However, if government spending or taxation change, the IS curve would shift. Budget surpluses provide the government with resources to reduce CGS supply (by repurchasing).
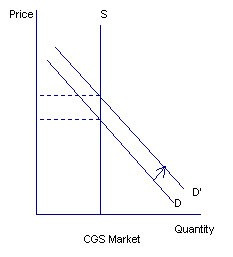
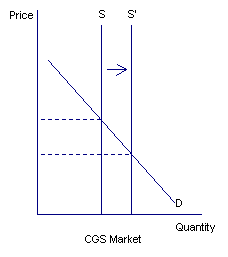
Reduced CGS supply would increase the price of remaining CGS. This shifts the supply curve left in the CGS market (Chart 27), reducing CGS interest rates. In other words, investors with a higher demand for CGS would accept a lower return to hold the scarce CGS.
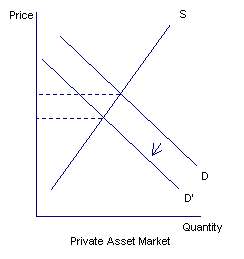
Chart 27: Reduced supply of CGS
|
[caption id="attachment_40106" align="aligncenter" width="238"] |
[caption id="attachment_40107" align="aligncenter" width="245"] |
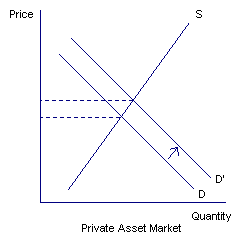
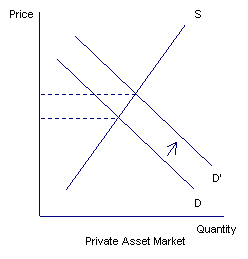
Private assets are substitutes for CGS for investors. Consequently, higher CGS prices would increase demand for private assets, shifting the private asset demand curve to the right, increasing the private assets prices and reducing yields on these assets. The net effect of reducing CGS outstanding is to lower interest rates on both the remaining CGS and private assets.
In addition, higher private assets prices would increase the demand for CGS, as the two markets are substitutes. While not depicted in Chart 27, these changes in the relative prices of CGS and private assets would continue until the marginal change was very small. That is, higher CGS prices would lead to higher demand for private assets, which increases their price, which increases the demand for CGS, which increases their price, and so on. As the two assets are imperfect substitutes, each successive increase in demand would be smaller than the last, so eventually the system would stabilise at a new, higher price for both assets. If price expectations were purely rational, the market immediately would move to the new equilibrium without iterations.
Three factors will influence the magnitude of price and interest rate changes.
- First, the size of change in private asset demand induced by a change in
CGS prices will influence the magnitude of price changes. For a given change
in CGS supply, the larger the increase in private asset demand, the larger
the fall in interest rates. The closer the two are as substitutes, the more
a given increase in the CGS price will lead investors to purchase private
assets. - Second, the sensitivity of the demand for CGS for a given change in the
price will influence the magnitude of price changes, so the steeper the slope
of the demand curve for CGS, the larger the change in CGS prices resulting
from reduced supply. That is, the less sensitive investors are to changes
in CGS prices, the more a given change in CGS supply will change the price. - Third, the sensitivity of the supply of private assets for a given change
in price will influence the magnitude of price changes. The steeper the private
asset supply curve (that is, the larger the price increase or interest rate
decrease required to induce further capital spending), the larger will be
the change in private asset prices.
While average interest rates in the long-term funds market will fall as a result of reduced CGS supply, the effect may not be the same for all private assets. Assets that are close substitutes for CGS will experience a larger fall in interest rates. Reduced CGS supply will benefit some private asset issuers more than others.
Private asset (and CGS) interest rates will fall in relation to short-term money market interest rates. Thus, the AMP curve shifts to the right and output rises while overall interest rates fall.12 In IS terms, lower interest rates increase consumption and investment by moving along the IS curve. The new IS-AMP equilibrium will be at a higher output and lower interest rate (point A in Chart 28).
[caption id="attachment_40108" align="aligncenter" width="512"]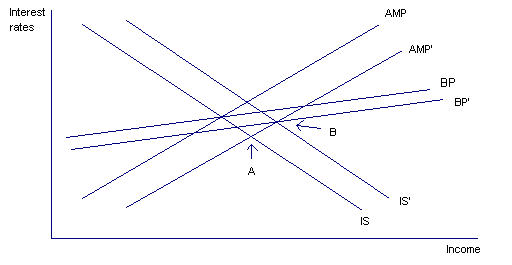 Chart 28: Effect of reduced CGS supply in the IS-AMP-BP model[/caption]
Increasing output and falling interest rates create an imbalance in the balance of payments (the sum of the current account and capital account). The exchange rate is the mechanism that resolves this imbalance. Higher income encourages higher imports and lower interest rates encourages capital outflow. Both factors push the exchange rate down: consumers sell Australian dollars to buy foreign currency to pay for imports; and investors sell Australian dollars to buy foreign assets. Thus, the exchange rate depreciates, shifting both the BP curve and the IS curve to the right. The IS curve shifts due to increasing net exports and the BP curve shifts due to the depreciation of the exchange rate.
The new equilibrium occurs at higher income and lower exchange rate than the initial position (point B in Chart 28). The increase in net exports will lead to a decrease in the current account deficit.
The size of the reduction in interest rates resulting from the reduced supply of CGS will determine the size of the shift in the AMP curve, determining the size of the exchange rate depreciation and the increase in output.
The more responsive international capital is to changes in interest rates, the flatter the BP curve. For perfectly mobile capital, lowering interest rates leads to a large volume of capital outflow, inducing a large depreciation of the exchange rate and a large expansion in net exports. The increase in net exports offsets the increase in capital outflow. The capital outflow induces a rise in interest rates back towards the original position. This reduces the demand for CGS and other domestic assets, reducing the price of these assets and so increases interest rates back to their original levels.
A net decrease in interest rates and net increase in income is consistent with imperfectly mobile capital. Perfect capital mobility requires Australian financial assets to be perfect substitutes for foreign financial assets, which is unlikely.
The fiscal position that provides the resources to repurchase government debt reduces domestic interest rates, increasing domestic output. Increased domestic output, and a depreciating exchange rate, may generate some pressure to increase prices in the economy generally. These price pressures are likely to be modest if the economy is operating below full capacity. However, if the economy is operating at full capacity, then price rises may result in little change in overall economic output. The increase in investment resulting from lower interest rates should increase the economy's productive capacity in subsequent periods. Expanded economic activity may occur before price pressures emerge.
Although changes in interest rates, exchange rates and domestic output are likely to occur, in reality the impacts are likely to be relatively small. Changes in CGS supply will occur over a relatively long time, so the macroeconomic impacts are likely be spread out.
Global bond index argument
Some investors may follow a global bond index in their investment strategy. Sovereign global bond indices, such as the Salomon Smith Barney Global Bond Index typically rank sovereign bonds by the amount on issue in each bond line. For example, $250 million on issue in a given line and US$20 billion overall outstanding by a government is sufficient to be included the index, and issuance above that would boost the country's position in the index compared to other countries (assuming issuance in other countries did not change).
This introduces a discontinuity in CGS demand. CGS demand might not be a uniform downward sloping function of the price, but might be affected by the dominance of various types of investors, or at extremes be, affected by perceptions of default risk, or lack of liquidity. A third type of investor could be introduced into the market for CGS - the foreign investor following a global bond index.
[caption id="attachment_40109" align="aligncenter" width="508"]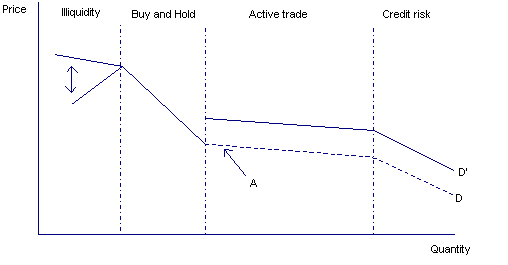 Chart 29: CGS demand with global bond index investors[/caption]
A minimum amount of CGS on issue will generate an exogenous increase in demand for CGS from global bond index investors, causing the CGS demand function to shift to the right, as more investors will want to purchase CGS at a given price. For convenience, this is assumed to occur at point A in Chart 29.
As the CGS supply decreases past point A, the demand for CGS falls as the CGS market falls off the global bond indices. At this point, CGS prices would fall and CGS interest rates rise. However, as the supply continues to diminish the price would begin to rise from the lower base. This makes the dynamics of the adjustment more complex.
Extreme illiquidity in the Commonwealth Government Securities market
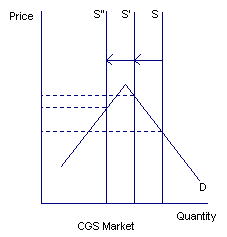
In the case of an upward sloping segment of the demand curve for CGS due to the illiquidity of the market, reduced CGS supply leads to an initial increase in CGS prices. Then, as the supply passes the peak in the demand curve, further reductions in supply would lead to falls in the price of CGS. Further falls past this point would lead to increases in CGS interest rates (Chart 30).
Chart 30: Extreme illiquidity and reduced CGS supply
|
|
|
The initial rise in CGS prices would increase demand for private assets, causing private asset prices to rise. Lower CGS prices, once supply has passed the peak, would normally lead to falling private asset prices, as investors would move from private assets into CGS. However, investors may not see private assets as substitutes once the CGS market is this small. Hence, demand for private assets may not fall; indeed demand may increase. Thus, reduced supply, past a certain point, may generate higher interest rates on CGS but not necessarily on private assets.
Falling prices and increasing interest rates associated with this effect would partially offset the macroeconomic impacts outlined previously. Final income levels would be lower than otherwise and final interest rates higher. The exchange rate would not fall as much, and the current account contraction would be smaller.
Implications of maintaining the Commonwealth Government Securities market
The previous section assumed that the government had a budget surplus, and therefore the resources to reduce CGS supply, resulting in lower domestic interest rates and higher domestic income. However, if the absence of the CGS market reduced the efficiency of financial market infrastructure, the government could decide to maintain the CGS market. Instead of using budget surpluses to repurchase CGS, the government could invest in private financial assets. The macroeconomic implications would depend on whether the government invested in domestic or foreign assets.
Also, if the CGS market needed to increase from its current size, the government could consider increasing the supply of CGS and using the proceeds to purchase financial assets.
Government investment in domestic assets
In the first case, the government investment activity is restricted to domestic securities. The CGS market is maintained in its original form and the budget surpluses are used to purchase domestic financial assets. The supply of CGS would not change but the demand for private assets would increase, so the price of private asset would rise and interest rates fall. Higher private asset prices would increase the demand for CGS, so CGS prices also would increase. Hence, both private asset and CGS interest rates would fall.
Chart 31: Investment of budget surpluses
in domestic financial assets
|
|
|
The impact would be broadly similar to if the government repurchased CGS. Average interest rates in the economy would be lower than if the government did not have budget surpluses. Income would be higher, the exchange rate lower and current account deficit would also be lower (Chart 28).
If the government increased the CGS market from the size depicted in Chart 31, additional demand for private assets from Government purchases would match increases in CGS supply. Increased CGS supply would decrease CGS prices and increase CGS interest rates. At the same time, government purchases of private assets would increase their prices and reduce their interest rates. Further increases in CGS supply would not increase interest rates.
Any government investment in private financial assets, while reducing average interest rates on those assets, would affect some assets more than others. The government is unlikely to invest in all private financial assets. Government purchases of some assets and not others may create distortions in the private asset market. If the Government purchased equities in one company, that would increase their market price and reduce the future cost of capital raising for that company. However, any companies whose equities were not purchased by the government would not get the same benefit.
To summarise, government purchases of private assets with budget surpluses would reduce domestic interest rates, but at the risk of creating distortions in the private financial asset market.
Government investment in foreign assets
In the second case, the government investment portfolio is restricted to foreign assets. The CGS market remains unchanged, and as the government's budget surpluses are invested in foreign assets, demand for domestic private assets is unchanged. Domestic average interest rates do not change so there is no change in consumption and investment.
However, the government's investment of budget surpluses in foreign assets could push the exchange rate down. At the margin, this would stimulate exports, improving the current account deficit.
If the government decides to increase CGS supply above the existing level, the price of CGS would fall and CGS interest rates would rise (Chart 32). This would cause lower demand for private assets, as they would be relatively more expensive than CGS. In this case, no offsetting increase in demand for private assets would result from Government investment of issuance proceeds. The overall impact is that average interest rates would increase.
Chart 32: Increased CGS supply and
foreign investment of proceeds
|
|
|
The AMP curve will shift to the left as long-term interest rates increase, reducing consumption, investment and domestic output (Chart 33). This shift creates an imbalance in the balance of payments, due to lower imports and capital inflow associated with higher interest rates. However, capital outflow would occur as the government invested bond proceeds in foreign assets.
Higher interest rates and lower imports would put upward pressure on the exchange rate, but the government investing overseas would partly offset this. The BP curve would shift to the left due to the exchange rate appreciation and IS curve would shift to the left as the exchange rate appreciation reduced net exports. The new equilibrium would be reached at a lower level domestic output and higher current account deficit.
[caption id="attachment_40116" align="aligncenter" width="513"]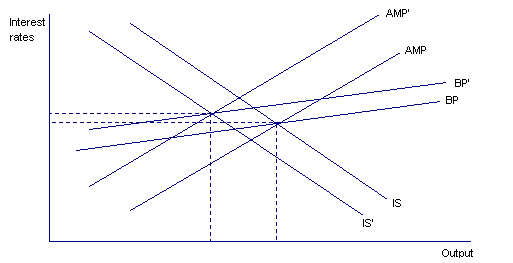 Chart 33: Effect of increased CGS supply in the IS-AMP-BP model when government invests in foreign assets[/caption]
Effect of hedging foreign exchange exposure
When the government invests in foreign assets, it creates an exposure to exchange rate risk. The government could hedge to remove this risk. To agree to entering a hedging arrangement with the government, the counterparty would have an opposite risk exposure to the government. For example, a US investor buys Australian dollar-denominated assets, but wants certainty in the US dollar value of the investment, while the government buys US dollar investments but wants certainty in Australian dollar returns.
If the government used budget surpluses to purchase foreign assets and hedged the exchange rate risk, the effect would be similar to the government investing in domestic securities. The government's foreign investment would match a domestic investment in private assets (the US investor buying Australian dollar-denominated assets). Hence, domestic private assets prices rise and interest rates fall. The macroeconomic effects of lower interest rates would apply.
If CGS supply increases and the proceeds are invested in foreign assets with exchange rate hedging arrangements, domestic average interest rates would not change. Increase CGS supply would raise interest rates, while increased demand for domestic private assets due to the hedge counterparty's domestic investment would reduce interest rates. No broader macroeconomic implications would arise.
If no hedge counterparty has an opposite risk exposure to the government, another counterparty could be willing to bear the risk in exchange for some compensation. This would create the same net economic impacts as the unhedged case, but would involve a transaction cost. The hedging arrangement may be a mix of `natural' counterparties and counterparties that require compensation, so the net interest rate effect may be somewhere in between the two cases.
Longer-term stability issues
The above analysis considers the short-term implications of the government's fiscal position. This section outlines some longer-term implications for the path of interest rates, government finances and economic output.
The IS curve in the analysis is based on a government fiscal surplus. This fiscal surplus provides the government with resources to repurchase CGS or purchase private financial assets, pushing domestic interest rates down and increasing domestic output. With no policy change, higher domestic output leads to a higher surplus, through the income tax and social welfare systems.
The higher surplus provides the government with more capacity to repurchase CGS or purchase private financial assets in the next period, further reducing interest rates and further increasing domestic output.
If everything else were equal, this would imply that maintaining ongoing fiscal surpluses would lead to ongoing reductions in interest rates. In the model, the opposite also would be true. Ongoing fiscal deficits would lead to ongoing increases in interest rates. This may appear to produce an unstable result. However, a number of factors may mitigate the likelihood or extent of this instability. The constraining factors will be different for budget surpluses and deficits.
In the case of budget surpluses, Chart 34 indicates how ongoing budget surpluses would lead to reductions in the supply of CGS (or increases in the demand for private financial assets), reducing interest rates.
As discussed previously, when CGS supply diminishes, the degree of substitutability of CGS for private assets diminishes, so increases in CGS prices will not have as large an impact on demand for private assets. In addition, when the Government begins investing budget surpluses in private financial assets, it will initially only purchase small volumes of private assets, so the initial impacts on private asset prices will be small. However, growth in private asset markets due to economic growth will increase CGS demand and so mitigate the price impacts of Government purchases of private assets.
[caption id="attachment_40117" align="aligncenter" width="405"]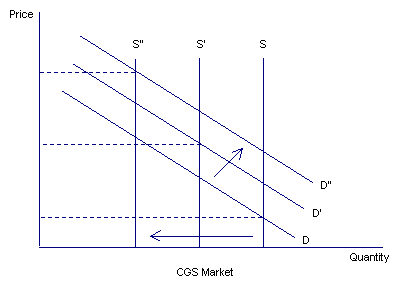 Chart 34: Ongoing budget surpluses[/caption]
There are several factors that would reduce or prevent the instability implied in the model.
- First, Australia is a small open economy with a close relationship between
domestic interest rates and interest rates in international markets. The more
responsive international capital flows are to changes in interest rates, the
smaller the net change in domestic interest rates for a given budget surplus.
International capital mobility would constrain downward pressure on interest
rates, constraining the investment, consumption and output effects. - Second, as mentioned previously, increased domestic output due to lower
interest rates may lead to price pressures as the economy approaches potential
output. Higher prices would offset the increased output, leading to a diminished
feedback to the budget. The economy's potential output would constrain a budget
surplus from leading to perpetual decreases in interest rates.
- That said, budget surpluses that lead to lower interest rates (either
by repurchasing CGS or by directly purchasing private assets) would increase
investment, increasing productive capacity in subsequent periods. Through
this channel, budget surpluses can contribute to growth in potential output.
This allows greater increases in domestic output to accumulate before
the potential output constraint begins to offset the effects of budget
surpluses.
- Third, a budget surplus may have less impact on domestic output if the private
sector does not expect the policy to be sustained. If the private sector views
the surplus as temporary with deficits to follow, then they may not increase
their spending as much. Then decreases in interest rates associated with current
budget surpluses may not generate as large an increase in domestic output,
reducing the future surpluses and mitigating against the ongoing decline in
interest rates.
In the case of budget deficits, the analysis needs to be considered in the context of a growing economy. Ongoing deficits would increase the supply of CGS in each period, pushing interest rates up. However, this ignores changes to CGS demand. Growth in the economy would lead to increased demand for all assets, including CGS. This would shift the demand curve for CGS, to the right, pushing interest rates down. The net effect on interest rates depends on the balance of these two considerations. If the deficit in each period causes CGS supply to grow faster than increased CGS demand, then interest rates will increase on an ongoing basis. In contrast, if CGS supply grows more slowly than CGS demand, then interest rates will fall. If the growth in CGS supply is matched by growth in demand for CGS, interest rates will be unchanged (Chart 35).
[caption id="attachment_40118" align="aligncenter" width="403"]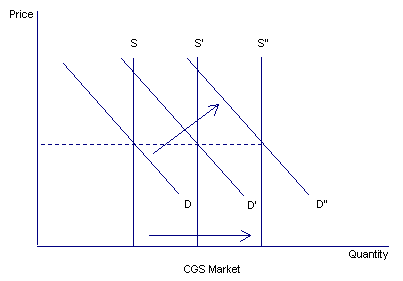 Chart 35: Ongoing budget deficits[/caption]
Empirical evidence on the change in CGS demand for a change in domestic output is unclear. However, one assumption may be useful. If the elasticity of demand of the CGS market with respect to GDP were one, then changes in the debt to GDP ratio would lead to changes in interest rates. If a one per cent increase in GDP led to a one per cent increase in CGS demand, then a rise in the debt to GDP ratio would increase interest rates. An elasticity of one may be a reasonable starting point as the demand for assets increases with income.
- To illustrate, if the debt to GDP ratio were 10 per cent, and the nominal
GDP growth rate were 6 per cent, then a deficit of 0.6 per cent would not
change the debt to GDP ratio or interest rates. The 0.6 per cent deficit would
mean that CGS supply would be 10.6 per cent of period one GDP in period two.
However, CGS demand also would increase to 10.6 per cent of period one GDP.
The new equilibrium would be at the same interest rate.
The sensitivity of interest rates to the income elasticity of demand for CGS also would depend on the price elasticity of demand for CGS. The more elastic the demand, the less sensitive interest rates would be to the income elasticity of demand.
In summary, the model outlined implies budget surpluses lead to lower interest rates, which lead to higher output, which leads to higher surpluses providing greater capacity to retire debt or purchase assets. This result may appear to be a potentially unstable result. However, a number of factors affect the likely magnitude of the interest rate changes. Further, the unstable result assumes that fiscal policy does not change and budget surpluses continue to increase. This is unlikely to be a relevant case in practice.
Conclusion
The analysis is highly stylised and somewhat abstractly represents Australia's financial markets and domestic output determination. It clearly does not capture the full breadth and sophistication of Australia's financial markets, nor does it fully encapsulate the interaction between financial markets and other economic activity. However, it does provide a useful economic framework for assessing the likely effects of changes in the size of the CGS market.
Given the size of Australia's financial markets, any changes in broader interest rates associated with changes in CGS supply are likely to be small. Consequently, the broader macroeconomic impacts are likely to be modest. With other changes in economic activity occurring at any time, the impacts of changes in the CGS market may not be discernible at a particular point.
If the CGS market shrinks, interest rates in the economy are likely to fall, leading to higher consumption and investment activity and, therefore, higher domestic output. At the same time, lower interest rates would likely lead to a depreciation of the exchange rate. This would reduce the current account deficit and reduce net foreign investment in Australia. These effects most likely would be modest and occur over a relatively long time.
If the government were to maintain or increase the CGS market and invest in domestic securities, average interest rates would again fall, and the broader macroeconomic implications would be the same as if the CGS market shrank. However, as the Government most likely would only buy a subset of all domestic private assets, relative price changes may create distortions in the domestic private asset market.
If the government were to maintain the CGS market and invest in foreign assets, domestic average interest rates would not change. If it hedged the foreign exchange exposure, domestic interest rates would fall.
If the government increased the supply of CGS and invested the proceeds in foreign assets, domestic average interest rates would increase and domestic output would fall. If the government hedged this foreign exchange position, domestic average interest rates would not change.
10 For example, see Cooper and Scholtes (2001) and Edey and Ellis (2002).
11 The MP relationship is a modification of the LM relationship. The key difference is that the MP relationship depicts the central bank implementing monetary policy by setting the short-term interest rate, whereas the LM curve assumes the central bank implements monetary policy by setting the money supply.
12 The analysis assumes that the RBA does not increase short-term interest rates in response to lower long-term interest rates. If this were the case, the AMP curve would shift back to the left and there would be no effect on output.
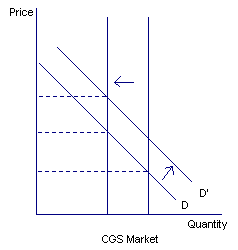 Chart 27: Reduced supply of CGS[/caption]
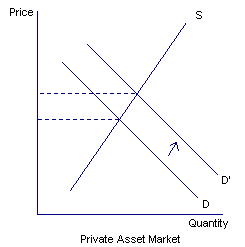 Chart 27: Reduced supply of CGS[/caption]