This chapter provides details on the trends in tax expenditure estimates. The changes in the overall level of tax expenditures since the 2003Tax Expenditures Statement largely reflect the availability of estimates for items that were previously unquantifiable and the availability of new data that allowed existing estimates to be revised.
2.1 Interpretation of trends and aggregates
Care must be taken when interpreting tax expenditure aggregates, particularly when making comparisons across time and against direct expenditures. There are several major considerations that need to be taken into account when analysing tax expenditure aggregates.
- Some of the identified tax expenditures are not costed because of a lack of suitable data or their cost may not be reported because of taxpayer confidentiality considerations. Hence, tax expenditure aggregates may underestimate the total benefit provided by tax expenditures.
- The trend in aggregates over time reflects changes in the extent to which individual tax expenditures are accessed, changes to benchmark tax rates and changes in the coverage of tax expenditures being costed.
- Changes over time in methodology and data used to calculate the cost of tax expenditures can result in large revisions to the tax expenditure estimates. Therefore, estimates that were provided in previous editions of the Tax Expenditures Statement may not be directly comparable to figures reported in this publication.
- Finally, tax expenditure aggregates are net aggregates as they include the offsetting effects of negative tax expenditures.
Further details on how to interpret tax expenditure estimates are provided in Chapter3: Measuring Tax Expenditures.
2.2 Trends in tax expenditures
Total measured tax expenditures are reported in Table2.1. Tax expenditures as a proportion of GDP are estimated to fall from around 4.4percent in 2000-01 to around 3.8percent in 2007-08.
Table 2.1: Total measured tax expenditures(a)

(a) Total measured tax expenditures are derived by summing the individual tax expenditure estimates, excluding estimates that are rounded to zero (..) or unquantifiable (*).
The projected decline largely reflects the impact of the policy decision to remove accelerated depreciation for plant and equipment (B43)1 with effect from 2001-02. The accelerated depreciation for plant and equipment is estimated to decline from a large positive tax expenditure in 2000-01 to a large negative tax expenditure in 2007-08. It becomes a negative tax expenditure because accelerated depreciation merely brings forward tax deductions, hence deductions in coming years for investments made before accelerated depreciation was removed will be lower than they would have been under the benchmark.
2.3 Large tax expenditures
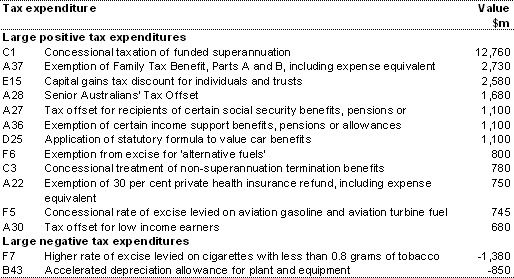
Table2.2 provides a list of the largest measured tax expenditures for 2004-05 in terms of their absolute magnitude. The twelve largest positive tax expenditures account for over 80percent of the aggregate value of tax expenditures in 2004-05.
The largest tax expenditure is the concessional treatment of funded superannuation (C1) which is estimated to provide a benefit to taxpayers of around $12.8billion in 2004-05. The next largest measured tax expenditures for 2004-05 are the income tax exemption of the Family Tax Benefit, Parts A and B (A37) and the capital gains tax discount for individuals and trusts (E15). These tax expenditures are estimated to provide a benefit to taxpayers in 2004-05 of around $2.7billion and $2.6billion respectively.
The largest negative tax expenditures in 2004-05 are the higher rate of excise levied on cigarettes (F7) and the reduced deductions allowed under the accelerated depreciation regime for plant and equipment (B43). These tax expenditures are estimated to be around -$1.4billion and -$0.9billion respectively.
Table 2.2: Large measured tax expenditures in 2004-05

2.4 Trends in tax expenditures by function
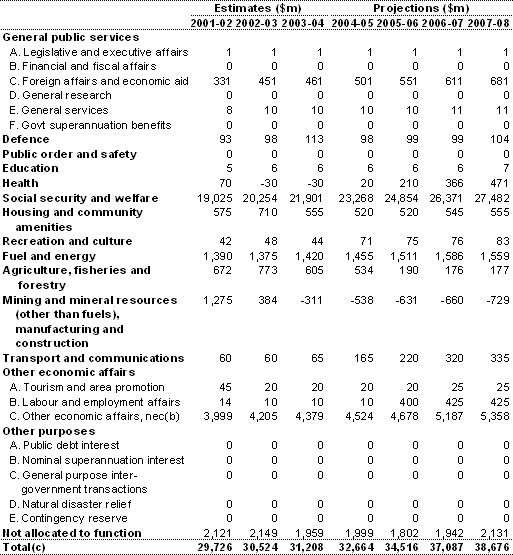
Total measured tax expenditures by functional category are reported in Table2.3 for the period 2001-02 to 2007-08. Significant movements in functional categories are listed below.
- The increase in total agriculture, fisheries and forestry tax expenditures from 2001-02 to 2002-03 reflects a significant increase in the value of tax expenditures aimed at smoothing the impact of fluctuating incomes for primary producers (B81 and B82). These tax expenditures are expected to fall in 2005-06 reflecting the impact of the drought on farm income.
- While the cost of income tax averaging rose, the main increase is due to strong growth in Farm Management Deposit Scheme contributions by primary producers. Due to the volatility of farm incomes and the uncertain impact of the drought on the level of Farm Management Deposit Scheme deposits, these tax expenditures are reported as unquantifiable beyond 2004-05, which results in a significant decline in total reported tax expenditures in 2005-06.
- The significant fall in the cost of mining, manufacturing and construction tax expenditures results from the decision to remove accelerated depreciation for plant and equipment (B43).
- The consistent growth in the social security and welfare tax expenditures reflects the growth in the tax concessions for funded superannuation (C1).
- The changes in the estimated value of health tax expenditures reflect:
- a change in the classification of the refundable tax offset for private health insurance (A21), which is classified as an expense from 2001-02;
- movements in the estimated tax concessions for registered health benefit organisations (B2), which has declined significantly since 2001-02; and
- the negative tax expenditure for high sulphur diesel (F2).
Table 2.3: Aggregate tax expenditures by function(a)

(a) Total measured tax expenditures by functional category are derived by summing individual tax expenditure estimates, excluding estimates that are rounded to zero (..) or unquantifiable (*).
(b) ‘nec’ means not elsewhere classified.
(c) Totals may not sum due to rounding.
2.5 Comparison with direct expenditure
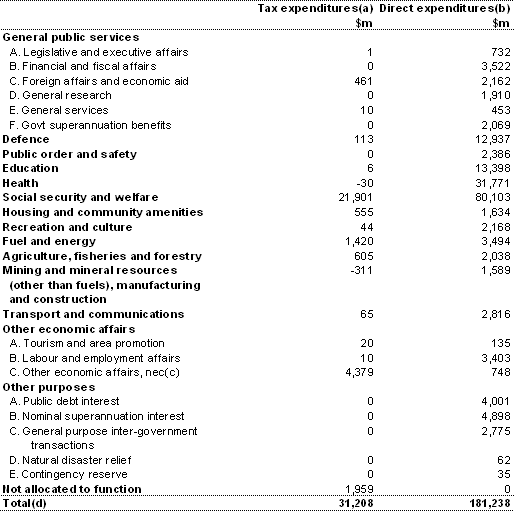
The tax expenditure estimates for 2003-04 by functional category are presented alongside direct government expenditure in Table2.4. The list of direct expenditures by function is reproduced from Table3 of the 2003-04 Final Budget Outcome.
Table 2.4: Aggregate tax expenditures and direct expenditures by function in 2003-04

(a) Total measured tax expenditures by functional category are derived by summing individual tax expenditure estimates, excluding estimates that are rounded to zero (..) or unquantifiable (*).
(b) Direct expenses by function, as reported in the 2003-04 Final Budget Outcome. Total expenses reported in the 2004-05 Mid-Year Economic and Fiscal Outlook include an additional $33 million in 2003-04 reflecting the recognition of the Dairy Structural Adjustment Fund, included as an 'other economic flow' in the 2003-04 Final Budget Outcome. The functional breakdown of total expenses has not been updated to reflect this change.
(c) ‘nec’ means not elsewhere classified.
(d) Totals may not sum due to rounding.
Comparisons between tax expenditures and direct expenditures are informative in broad terms, although the costings are not strictly comparable. For example:
- Tax expenditure estimates measure the benefit of the tax concession to the recipient, whereas direct expenditure estimates measure the impact of the expenditure on the budget in pre-tax dollars.
- A tax expenditure tends to provide a higher benefit than direct expenditure of the same magnitude. This is because direct expenditures are often taxable, whereas tax expenditures are not. Therefore, a direct expenditure will, in some circumstances, have a smaller net budgetary impact than a tax expenditure of equivalent nominal value.
- The removal of a tax expenditure or a direct expenditure of the same magnitude may have different effects on the underlying fiscal balance, due to different behavioural responses.
The addition of tax expenditures and direct expenditures will also tend to overstate the impact on the fiscal balance. For example, in the case of the exemption of certain income support benefits, pensions or allowances (A36) the direct expenditure column includes the full cost to government of the program; however there is also an associated tax expenditure for the value of the income tax exemption to the recipient.
As reported in Table2.4, total measured tax expenditures in 2003-04 are valued at around $31.2billion. Social security and welfare tax expenditures comprise around 70percent of total measured tax expenditures, which largely reflects the concessional taxation of funded superannuation (C1) and the income tax exemption of the Family Tax Benefit, Parts A and B (A37).
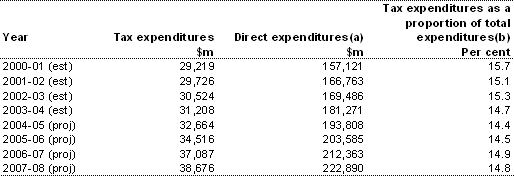
When compared to the sum of both total measured tax expenditures and total direct expenditure, total government assistance provided through tax expenditures is expected to remain at around 15percent. Table2.5 shows that this ratio has been fairly steady at around this level over recent years.
Table 2.5: Trends in tax expenditures versus direct expenditures

(a) Source: Table F5, 2004-05 Mid-Year Economic and Fiscal Outlook.
(b) Tax expenditures as a proportion of direct expenditures plus tax expenditures.
1 Throughout the remainder of this document, where a reference to a particular tax expenditure is made, the tax expenditure reference code used in Chapter6 is reported in parentheses.