The previous section briefly covered a small subset of the various measures of progress currently being promoted or developed. Even an examination of this small subset makes clear that the various measures focus on different aspects of progress. This different focus will have implications for the conclusions drawn - which in turn can have potentially different implications for public policy.
Comparing different indicators for a large sample of countries highlights the extent of the discrepancies across different measures of progress. This section of the paper compares six different measures of progress with each other and with per capita GDP.6 The measures are: the Human Development Index (HDI), Adjusted Net Savings (ANS), the Environmental Sustainability Index (ESI), the Ecological Footprint (EF), the Ecological Balance (EB) and the Happy Planet Index (HPI).7
Figure 1 presents scatter plots highlighting the relationship between all the selected indices. In most cases, the relationship between indicators appears weak.
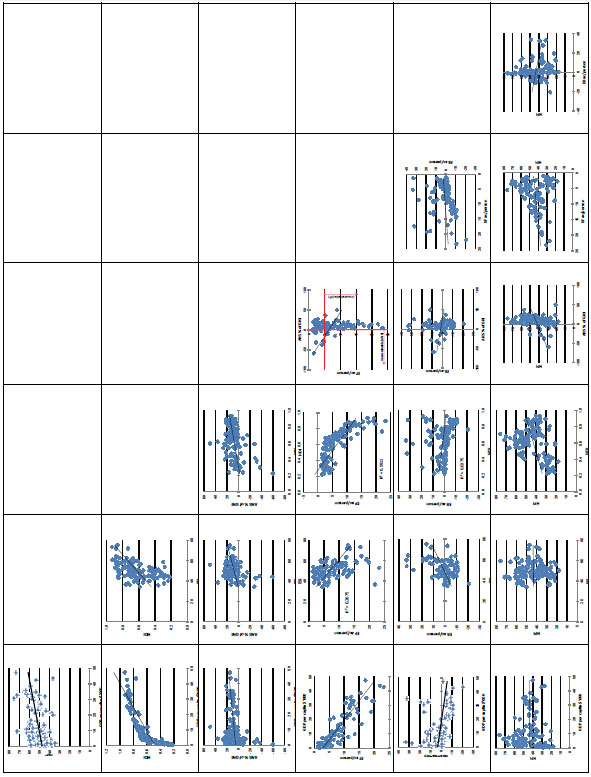
Most indicators have a positive relationship with per capita GDP, with the exception of EF and EB. The negative relationship between per capita GDP and EF (and to a lesser extent EB) reflects the inverse link between EF and consumption (and therefore income). Under the EF economies with higher levels of consumption will generally perform worse. This is not always the case for EB, as EB is also based on an economy's biocapacity. For example, Australia performs poorly against the EF, ranked 117 of the 120 countries, due to its high grazing, cropland and carbon footprints. However, Australia's biocapacity is significantly larger than its footprint and therefore has an ecological surplus unlike many advanced economies, and is ranked 6 on EB.
Interestingly the ESI, another environmentally based measure, typically has a positive relationship with most other measures. This is likely due to the inclusion of institutional factors in the index, with developed countries performing better on environmental policies, quality of institutions and global interaction. The positive relationship between per capita GDP and ANS is likely to reflect the greater capacity for developed economies to accumulate human and physical capital. The relationship between per capita GDP and the HPI is the weakest.
The scatter plots also highlight the conflicting conclusions that can be drawn from the various measures. For example, comparing ANS and EF (which are considered measures of sustainability), all points below 5.1 acres per person on the horizontal axis would be deemed unsustainable from an EF perspective, and all points below zero on the vertical axis would be considered unsustainable under the ANS. This divides the plot into quadrants reflecting: sustainable under both measures, unsustainable under both measures, sustainable under the ANS only, and sustainable under the EF only. There are 62 countries deemed unsustainable under the EF but sustainable under the ANS (mostly developed economies) and 11 countries deemed unsustainable under the ANS but sustainable under the EF (mostly low income countries).
The variation in conclusions across the various measures is highlighted further in Figures 2 and 3 which present the rankings of the indicators for selected developed and developing economies. Developed economies perform worse on environmentally based measures such as the EF and EB, but perform better on the broader based measures, such as ANS, HDI and ESI. The opposite is the case for developing economies which typically have lower life expectancy and education, reducing their performance against the HDI (and the ANS); they don't have strong institutions reducing their relative performance against the ESI; and they have less capacity to invest in human capital and physical assets reducing their performance against the ANS.
Figure 2: variation across measures for selected developed economies
Figure 3: variation across measures for selected developing countries
Note: Charts show rankings for different countries across measures of Gross Domestic Product (GDP); Gross National Income (GNI); Environmental Sustainability Index (ESI); Human Development Index (HDI); Adjusted Net Savings (ANS); Ecological Footprint (EF); Ecological Balance (EB); Happy Planet Index (HPI).
One of the reasons for the different outcomes from the different measures is, of course, their focus on different aspects of progress. Some focus on material aspects (GDP), some on socio economic aspects (HDI) while others are environmentally focused (EF, EB and ESI). Another key difference is that some attempt to measure current wellbeing (HDI), while others focus on whether current levels of wellbeing can be maintained, or sustainability (ANS, EF and EB).
The distinction between current wellbeing and sustainability is important, and was highlighted by Stiglitz et al (2009) who made a case for the separate measurement of current wellbeing and sustainability. The two concepts are closely linked, as the wellbeing of the current generation may be affected by intergenerational considerations, although clearly future generations cannot care for the wellbeing of generations that came before them. Put another way, current wellbeing is affected by the way in which current resources are used, while sustainability is only affected if the stock of resources itself is affected (Neumayer 2004).
While most sustainability measures are focused on intergenerational equity, measures such as the Index of Sustainable Economic Welfare and the Genuine Progress Indicator attempt to combine measures of current wellbeing and intergenerational issues together. Other measures of sustainability, where the focus is solely on intergenerational issues can be divided into two distinct approaches: those where various forms of capital are assumed to be substitutable, at least to some extent (weak sustainability), and those where substitutability is rejected (strong sustainability), which has typically been the focus of environmental sustainability.