The forecasts for the domestic economy are underpinned by several technical assumptions. The exchange rate is assumed to remain around levels observed at the time of writing (a trade-weighted index of around 66 and a $US exchange rate of around 84c). Interest rates are assumed to remain unchanged at their current levels. World oil prices (Tapis) are assumed to remain at around $US 106 per barrel. The farm sector forecasts are based on an assumed return to average seasonal conditions in the remainder of the forecasting period, but take into account the effects of sustained drought conditions in the preceding period.
Household consumption
The outlook for household consumption has deteriorated significantly since the June round, with the continued impact of increased borrowing costs combined with a weaker outlook for household wealth expected to curb household consumption over the forecast horizon.
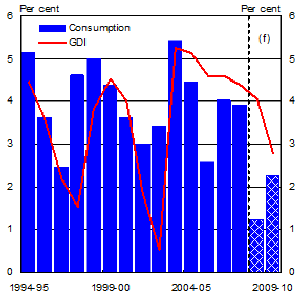
Consumption is forecast to grow by 1¼ per cent in 2008-09 (Chart 1), down from 2¾ per cent at the June round. This follows a weaker than expected outcome in the June quarter which saw the first quarterly fall since 1993.
Despite some positive news for the sector, most notably softer fuel prices and the 25 basis point cut in interest rates in September 2008, negative effects are expected to dominate the outlook over 2008-09. This includes a weaker and more uncertain outlook for wealth, driven by recent developments in global financial markets and subdued growth in house prices. The continuing effects of high interest rates and lower confidence are also likely to continue to weigh on growth. Despite some recent improvement, the consumer sentiment index has remained below 100 for the longest period since the early 1990s recession.
Consumption is forecast to experience a modest recovery in 2009-10. This reflects the fundamentals of solid growth in household income - supported by the 2008-09 and 2009-10 personal income tax cuts - and the assumption of no further increases in borrowing costs. Consumption growth in 2009-10 has been revised to 2¼ per cent, down from 2¾ per cent in June, with the extent of the recovery limited by a rising unemployment rate and lower expectations for wealth.
Chart 1: Household consumption and gross disposable income (real)
Source: ABS Cat. No. 5206.0 and Treasury.
Household disposable income is expected to grow significantly more than consumption in 2008-09 (Chart 1), reflecting weak consumer confidence and an expectation that households will seek to repair balance sheets following falls in the financial markets.
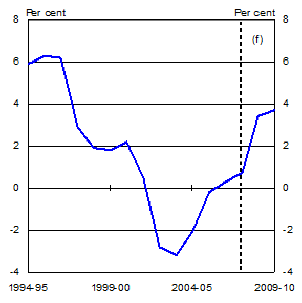
As a result the household saving ratio is expected to continue its recovery of recent years (Chart 2).
Chart 2: Household Saving Ratio
Source: ABS Cat. No. 5206.0 and Treasury.
Dwelling investment
The outlook for the residential construction sector has weakened since the June round. The impact of higher interest rates continues to weigh on the sector, with recent partial data around housing finance and building approvals supporting this view.
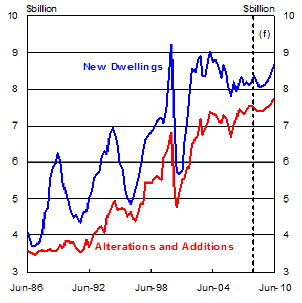
The outlook for both new dwelling investment and alterations and additions has weakened and both components are now expected to decline by 1 per cent in 2008-09. (Chart 3).
Chart 3: Dwelling investment (real)
Source: ABS Cat. No. 5206.0 and Treasury.
Despite the weak outlook for dwelling investment in the medium term, fundamental forces in the housing market suggest stronger activity in the longer term. With the population growing at the fastest rate in almost 20 years driven by record levels of migration, underlying demand for housing remains strong.
New dwelling investment is expected to grow by 3½ per cent in 2009-10, reflecting strong underlying demand, as well as more attractive rental yields for investors as rents continue their rapid growth. Investment in alterations and additions is also expected to pick up in 2009-10, growing by 2½ per cent.
Business investment
New business investment is expected to increase by 9 per cent in 2008-09 and 5 per cent in 2009-10, up slightly from the June round. Record prices for key non-rural commodities and momentum from projects (both mining and non-mining) that have already commenced are expected to support growth. However, the soft domestic outlook and tighter credit conditions are expected to temper investment in the non-mining sectors over the forecast period, particularly in non-residential building. In contrast, larger mining and ancillary firms are expected to be largely insulated from higher funding costs because of their more robust profit outlooks and lower gearing ratios. However, tight credit conditions are a key downside risk to business investment.
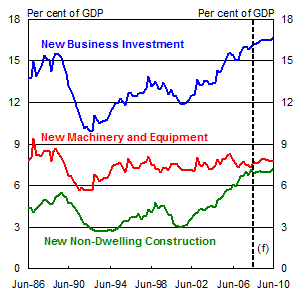
Investment growth is expected to slow in 2009-10 but will remain at a high proportion of GDP over the forecast period (Chart 5).
Total non-dwelling construction investment is expected to grow by 3½ per cent in 2008-09 and 1 per cent in 2009-10.
New engineering construction investment is expected to increase by 5½ per cent in 2008-09 and 4 per cent in 2009-10. Investment is expected to be supported by mining-related activity, spurred by high non-rural commodity prices and a record amount of projects in the investment pipeline. However, materials and labour shortages and increased input costs remain risks to scheduled project commencements.
Chart 4: Business investment to GDP ratio (nominal)
Source: ABS Cat. No. 5206.0 and Treasury.
There are significant risks around non-residential building investment. Investment is expected to pick up in the near term as current projects, especially in office construction, feed activity. However, the softer consumption outlook is expected to slow growth in the retail component, and tightening credit conditions paired with softer jobs growth are expected to weaken activity in the office market. As a result, investment is expected to fall by 1½ per cent in 2009-10.
Investment in new machinery and equipment is expected to grow by 13 per cent in 2008-09 and 6½ per cent in 2009-10. The third estimate of CAPEX investment intentions for 2008-09 implies very strong investment growth, particularly in the mining sector. However, these investment intentions have been discounted, to some extent with the recent deterioration in business conditions, particularly for the non-mining sectors expected to weigh on investment.
Public final demand
In real terms, new public final demand in 2008-09 is forecast to grow by 3½ per cent, unchanged from June.
Growth is expected to ease to 2¾ per cent in 2009-10, ½ of a percentage point lower than at the June round, reflecting lower growth in new public investment particularly at the state and local level.
Table 3: Real new public expenditure

Source: Treasury
Commonwealth and State and local consumption are expected to ease over the forecast horizon.
Public investment is expected to remain strong but with growth moderating over the forecasting period. New public investment is expected to grow by 6½ per cent in 2008-09 and 3½ per cent in 2009-10, following strong growth of 10¼ per cent in 2007-08.
Strong State and local investment is still expected to drive public investment over the forecast horizon. Compared to June, the forecast for both years is weaker, mostly reflecting an expected moderation in new investment growth from Queensland and New South Wales. Further project delays and tighter global credit conditions remain a risk to the investment profile, given existing capacity constraints.
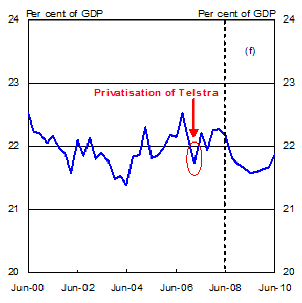
Nominal public demand has grown broadly in line with nominal GDP in recent times but is expected to fall as a proportion of the economy over the forecast horizon (Chart 6).
Chart 5: Nominal public expenditure
Source: ABS Cat. No. 5206.0 and Treasury.
Exports, imports and the current account deficit
Uncertainty around the global outlook will continue to present risks for the external sector. Stronger commodity export volumes and prices, together with weaker imports in a slowing economy, are expected to produce a trade surplus and reduce the current account deficit.
Net exports are expected to subtract ½ a percentage point from GDP growth in 2008-09, ¾ of a percentage point lower than at the June round. Net exports are expected to subtract ¼ of a percentage point in 2009-10. The changes reflect an improved outlook for non-rural commodity exports and slower import growth associated with weakness in household consumption.
Total export volumes are expected to grow by 6 per cent in 2008-09 and 5½ per cent in 2009-10, with commodity exports expected to account for over 80 per cent of total export growth.
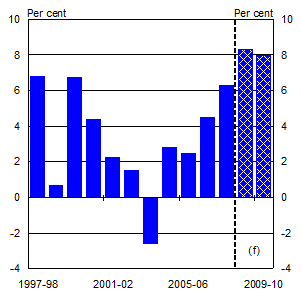
Following the significant amount of investment in recent years, mining projects are expected to come online throughout the forecast horizon, supporting a significant boost in non-rural commodity exports. Volumes are expected to increase by 8½ per cent in 2008-09 and by 8 per cent in 2009-10, the fastest rates of growth in over a decade (Chart 7).
Chart 6: Non-rural commodity exports (year average)
Source: ABS Cat. No. 5302.0 and Treasury.
By component, growth in iron ore exports is expected to contribute significantly to non-rural commodity export growth over the forecast period, as new entrants join existing producers to ramp up production. Mineral fuels and coal are also expected to contribute strongly in 2008-09 as oil and gas projects come online, and infrastructure upgrades and the arrival of key machinery and equipment improve coal chain performance.
Farm production is expected to rebound by 15 per cent in 2008-09, the same as at June. However, lower than expected rainfall during August means that ongoing rainfall during the spring crop growing season will be critical. Contingent on average seasonal conditions continuing, farm production is forecast to increase by a further 7 per cent in 2009-10.
The recovery in farm production, coupled with high international food prices is expected to see a boost to rural exports which are forecast to grow by 12 per cent in 2008-09 and 9 ½ per cent in 2009-10.
The negative influence of slowing world growth is expected to offset the boost from a weaker exchange rate for elaborately transformed manufactures (ETM) and service exports. ETM exports growth is expected to slow substantially to just 1 per cent in 2008-09 before rising to 1½ per cent in 2009-10. Growth in services exports is also expected to ease to 4½ per cent in 2008-09 and 2 per cent in 2009-10.
Imports of goods and services are expected to grow by 7½ per cent in 2008-09, before easing to 5½ per cent growth in 2009-10, as domestic demand continues to moderate. Compared with June, the current forecasts are 2 percentage points lower for 2008-09, reflecting a weaker outlook for domestic consumption.
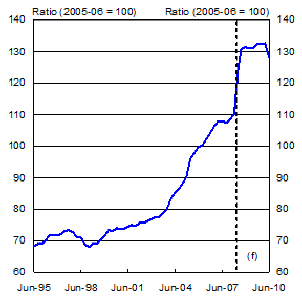
The terms of trade are forecast to increase by 16¼ per cent in 2008-09, remaining flat in 2009-10. This is broadly consistent with June, with a weaker Australian dollar assumption translating to both stronger export prices and stronger import prices. The significant improvement in the terms of trade in 2008-09 is driven by high contract prices for Australia's bulk commodity exports - iron ore (up by around 85 per cent), metallurgical coal (up more than 200 per cent), and thermal coal (up by 125 per cent).
Current strong demand for commodities and constrained global supply should continue to support a high level of prices. However, there is considerable uncertainty regarding the future path of commodity prices.
Chart 7: Terms of trade
Source: ABS Cat. No. 5302.0 and Treasury.
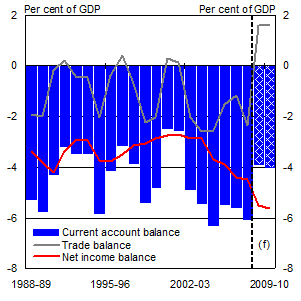
The trade balance is expected to register a surplus of 1½ per cent of GDP in 2008-09 and 2009-10, 1¼ percentage points stronger than the June forecasts, largely reflecting substantial increases in bulk commodity prices and to a lesser extent, the weaker $AUS, which boosts the value of non-rural commodity prices denominated in $US.
The net income deficit (NID) as a per cent of GDP is expected to widen to 5½ per cent in 2008-09 and 5¾ per cent in 2009-10. The widening largely reflects strong growth in mining profits, and rising net interest payments from a higher stock of net foreign debt.
The current account deficit (CAD) is expected to narrow to 4 per cent of GDP in 2008-09, and remain largely unchanged in 2009-10. This is a greater narrowing of the CAD than was forecast at June JEFG, primarily due to the stronger forecasts for the trade surplus over the forecast period (Chart 9).
Chart 8: Current account balance
Source: ABS Cat. No. 5302.0, 5206.0 and Treasury.
Employment, wages and inflation
Labour market
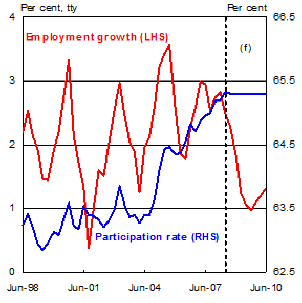
Employment growth is forecast to ease further, compared to the June round, in line with the weaker economic outlook. Employment is now expected to grow by 1 per cent through the year to June 2009, before rising to 1¼ per cent by June 2010.
Chart 9: Labour market
Source: ABS Cat. No. 6202.0 and Treasury.
The participation rate is expected to remain at around current record levels of 65¼ per cent over the forecast horizon, despite an easing in labour demand. High rates of participation from skilled migrants are expected to support the overall participation rate.
With the labour force already expected to grow more strongly than employment, the unemployment rate is now expected to increase to 5 per cent by June 2009, rising to 5¼ per cent by June 2010.
The expectatio
n that immigration levels will remain high, despite an easing labour market, reflects the dichotomy between mining-related and other sectors of the economy. High commodity prices are likely to support continued strong demand for labour from mining-related sectors, particularly for skills that are in short supply in Australia. At the same time, relatively weak growth in demand from households is expected to dampen general labour market conditions. The net effect is that overall employment growth is not expected to be sufficient to absorb new labour force entrants.
Prices and Wages
Wages
The outlook for wages growth remains unchanged from June with growth expected to remain elevated in the near term but not to accelerate. Some of the pressure in the labour market is expected to ease due to the weaker outlook for the economy, lowering the risk of excessive wage increases in 2008-09. The easing in GDP growth over the estimates period is expected to result in slower wage growth by 2009-10.
The WPI is expected to grow by 4¼ per cent through the year to the June quarter 2009 and by 4 per cent through the year to the June quarter 2010.
Although wage pressure has been strong since 2005, WPI outcomes have remained contained at or below 4¼ per cent annual growth. Well anchored inflation expectations linked to highly credible monetary policy are likely to have played a role in containing wage growth through this period. Survey based measures of inflation expectations are now starting to decline.
Other measures of wage growth are forecast to grow in line with the WPI, with Average Weekly Earnings and earnings on a National Accounts basis forecast to grow by 4¼ per cent in the year to June 2009 and by 4 per cent to June 2010.
Prices
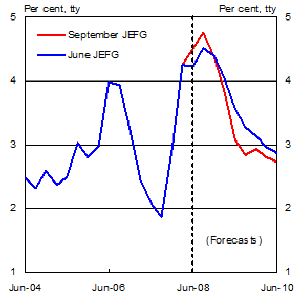
Forecasts of underlying inflation are broadly unchanged from the June round, with the effects of a weaker economy offset by higher import prices and higher nominal unit labour costs. Underlying inflation is expected to grow by 3½ per cent through the year to June 2009 and by 2¾ per cent through the year to June 2010.
Headline inflation is forecast to be lower due to lower expected oil prices. Headline consumer prices are forecast to grow by 3 per cent through the year to the June quarter 2009 and 2¾ per cent through the year to the June quarter 2010.
Nominal unit labour costs are expected to be slightly higher compared to the June round forecasts, driven mostly by a decline in productivity growth as GDP growth slows. Higher import prices are also expected to contribute to inflation as will rents.
Australian dollar oil prices are assumed to be lower over the forecast period compared to the June round, with a fall in the USD oil price outweighing the decline in the exchange rate.
The inflation forecasts are sensitive to changes in assumptions about the exchange rate and oil prices. As such, volatility in these variables presents a degree of uncertainty around these forecasts.
Chart 10: Consumer price inflation
Source: ABS Cat. No. 6401.0 and Treasury.
1 This spending was included as expenditure by States and local authorities in the UEFO forecasts but has been subsequently reclassified as renovation spending by households.