Real and Nominal GDP Forecasts
This section presents 70 and 90 per cent confidence intervals around key GDP forecasts from the 2013–14 Budget. For GDP forecasts, confidence intervals could be presented around forecasts of annual growth rates, average annualised growth rates or cumulative growth rates. While all three measures have merit, a key role of the GDP forecasts is as an input for producing revenue and expenses forecasts for the Budget. In this context, the forecast of the level of nominal GDP is particularly important. For this purpose, the average annualised GDP growth rate or the cumulative GDP growth rate is the more relevant summary statistic, since the level of GDP depends on cumulative growth over time. To get a good forecast of the level of GDP in 2013–14, the quality of the individual GDP growth forecasts in 2012–13 and 2013–14 is not in itself important, but rather the quality of the forecast of cumulative growth over the two years to 2013–14. (It is possible that a forecaster could incorrectly predict growth in both 2012–13 and 2013–14 but these errors may be offsetting such that the prediction of cumulative growth over the two years is accurate.) We have opted to report the average annualised growth rate (Charts 1 and 2) as it captures the effects of cumulative growth, while still giving a sense of what the annual growth rate would be. For Chart 3, we use the cumulative growth rate to calculate confidence intervals around the level of nominal GDP.9
Chart 1 presents point estimates and confidence intervals for the Budget forecast for average annualised real GDP growth. In the 2013–14 Budget, real GDP was expected to grow by 3 per cent in 2012–13 while average annualised growth over the three years to 2014-15 was also expected to be 3 per cent.10 The observed outcome for 2012-13, which was not known when the 2013-14 Budget was delivered, is also noted on this and the following charts. The observed outcome for real GDP was close to the central forecast in the Budget.
Chart 1 suggests that, at the time when the 2013-14 Budget forecasts were published, there was a 70 per cent probability that the average annualised growth rate over the two years from 2011-12 to 2013-14 would lie between around 2 and 3¾ per cent.11
It is noticeable that the confidence intervals shrink in width for the 2014-15 year forecast. This occurs because reporting the average annualised growth rate moderates the impact of errors over longer horizons. By contrast, if confidence intervals were reported around the cumulative growth rates they would continue to widen.
Chart 1 suggests that there is significant uncertainty around the Budget point estimate forecasts for real GDP growth. While not directly comparable (because the RBA confidence intervals are based on year-ended growth rates rather than year-average growth rates, as here), this is consistent with findings of Tulip and Wallace (2012) who conclude that there is a high level of uncertainty around RBA real GDP forecasts.
Chart 1: Real GDP growth rate
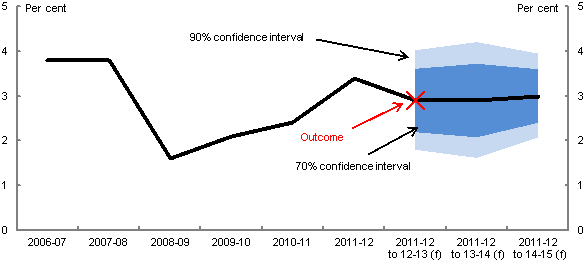
Note: The central line shows the outcomes and point estimate forecasts in the 2013-14 Budget. Annual growth is reported to 2011-12. Annualised average growth rates (from 2011-12) are reported from 2012-13 onwards. Confidence intervals are based on the root mean square errors of Budget percentage growth rate forecasts from the 1998-99 Budget onwards. (f) are forecasts. Before the 2009-10 Budget, a projection rather than a forecast was made for the year after the budget year. The chart reports seasonally adjusted financial year outcomes.
Source: ABS cat. No. 5206.0, Budget papers and Treasury.
In the 2013-14 Budget, nominal GDP growth was expected to weaken in 2012-13, with growth of around 3¼ per cent, before picking up in subsequent years, with annualised average growth of 4½ per cent in the three years to 2014-15 (Chart 2). As shown, the subsequently released outcome for 2012-13 was weaker than the Budget forecast, though it fell within the 70 per cent confidence interval.
At the time of the Budget, there was a 70 per cent probability that the average annualised growth rate over the two years from 2011-12 to 2013-14 would lie between 2¾ and 5½ per cent. The confidence intervals around the annualised average nominal GDP growth rate are significantly larger than those around the real GDP growth rate forecasts. This reflects the compounding nature of two sources of uncertainty; the uncertainty associated with the outlook for real GDP and the uncertainty associated with the outlook for prices or the GDP deflator. The forecasting of the GDP deflator was discussed in the Treasury Forecasting Review.
Chart 2: Nominal GDP growth rate
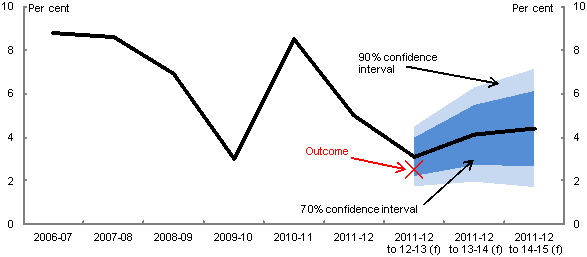
Note: See note to Chart 1.
Source: ABS cat. No. 5206.0, Budget papers and Treasury.
The level of nominal GDP is expected to continue to grow over the forecast period (Chart 3). The confidence intervals get wider over time, with a 70 per cent confidence interval of roughly $170 billion in 2014‑15. This compares to a central forecast of nominal GDP of almost $1.7 trillion. The confidence interval gets wider because the root mean square error of the cumulative growth rate increases when predictions are made further into the future (that is, forecast errors tend to accumulate).
It is difficult to make comparisons between the confidence intervals reported here and those reported by other institutions, in part because different institutions often report somewhat different variables. However Table 3.5 of the Treasury Forecasting Review suggests that the Reserve Bank of Australia's forecast accuracy for real GDP is similar to that of Treasury, implying that the uncertainty around its forecasts is similar to Treasury's. Also the UK Office for Budget Responsibility's estimates of uncertainty for annual real GDP growth, as reported in its March 2013 Economic and Fiscal Outlook, seem no smaller than those of Treasury (treating their current year forecast, made early in the year, as roughly equivalent to the Treasury's budget year forecast).
Chart 3: Nominal GDP
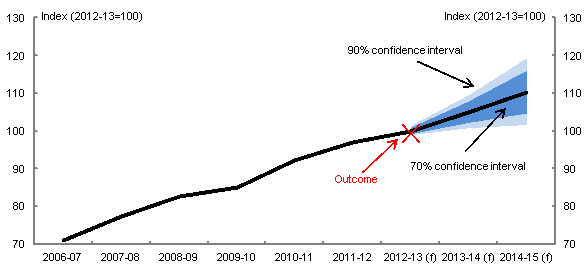
Note: The central line shows the outcomes and point estimate forecasts in the 2013-14 Budget. Confidence interv
als for the levels are derived from the root mean square errors of Budget forecast errors of the cumulative growth rate from the 1998‑99 Budget onwards (i.e. using the cumulative growth rate approach). (f) are forecasts. Before the 2009-10 Budget, a projection rather than a forecast was made for the year after the budget year. The chart reports seasonally adjusted financial year outcomes.
Source: ABS cat. No. 5206.0, Budget papers and Treasury.
Fiscal Forecasts
We now turn to confidence intervals around key fiscal forecasts from the 2013–14 Budget. The charts show confidence intervals around forecasts of fiscal variables as shares of GDP. Showing the fiscal variables relative to the size of the overall economy is in many ways more informative and easier to understand than the level of the fiscal variables over time.
We present confidence intervals in two different ways. First, we present confidence intervals based on the errors in the forecasts of the fiscal variables as a share of GDP. As discussed above, this captures uncertainty in both the fiscal variable and GDP. However, if the key variables of interest are the levels (or dollar values) of receipts, payments and the underlying cash balance, then it is more informative to focus on confidence intervals that abstract from uncertainty about GDP, which are also presented below.
Confidence intervals incorporating both fiscal and GDP uncertainty
Charts 4, 5 and 6 report the Budget forecasts for receipts (excluding GST and including Future Fund earnings), payments (excluding GST) and the underlying cash balance (excluding Future Fund earnings). For these three charts, the confidence intervals have been calculated comparing the forecasts of the relevant fiscal variable as a share of GDP with the outcome.12
Chart 4: Receipts (excluding GST) as a percentage of GDP

Note: The central line shows the outcomes and point estimate forecasts in the 2013-14 Budget. Confidence intervals use root mean squared errors (RMSE) for Budget forecasts from the 1998-99 Budget onwards. RMSE do not reflect forecast errors caused by policy decisions taken after the relevant Budget. (f) are forecasts. Before the 2009-10 Budget, a projection rather than a forecast was made for the year after the budget year. The outcome is based on information available at the time of the Final Budget Outcome.
Source: Budget papers and Treasury.
Chart 5: Payments (excluding GST) as a percentage of GDP
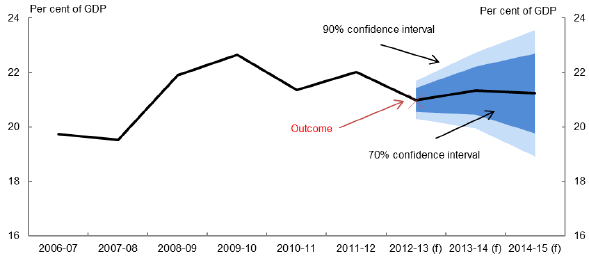
Note: See note to Chart 4.
Source: Budget papers and Treasury.
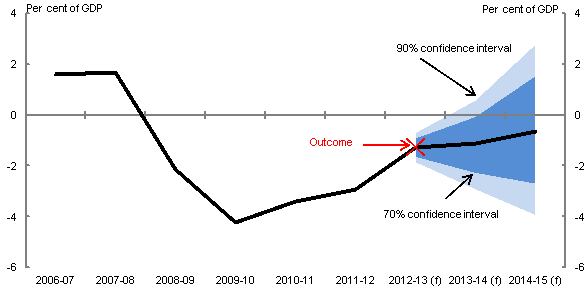
Chart 6: Underlying cash balance as a percentage of GDP
Note: See note to Chart 4.
Source: Budget Papers and Treasury.
The confidence intervals are substantial and widen over time. They suggest that, at the time of the 2013-14 Budget, there was a 70 per cent probability that receipts would lie between 19.7 and 21.1 per cent of GDP, payments between 20.5 and 22.2 per cent of GDP and the underlying cash balance between -2.2 and 0.0 per cent of GDP in 2013-14 (Charts 4, 5 and 6).
As previously discussed, these confidence intervals reflect uncertainty about both the level of the fiscal variable (the numerator of the share) and nominal GDP (the denominator of the share). The above charts may suggest that the historical errors around forecasts of the level of payments are greater than for receipts. In reality, however, historical errors around payment forecasts (in level terms) are substantially smaller than those of receipts.
This potential misconception arises because the confidence intervals shown above are strongly influenced by the correlation between the forecast errors of the fiscal variables and nominal GDP (as highlighted in equation (2) above). This issue is discussed further below and results are presented that do not reflect this correlation.
Confidence intervals incorporating fiscal uncertainty only
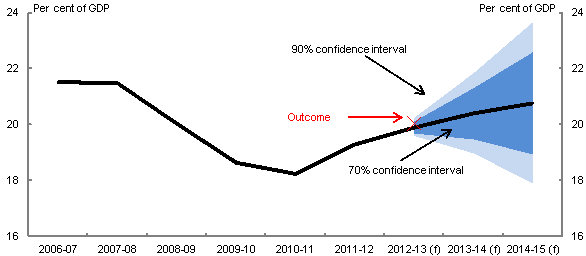
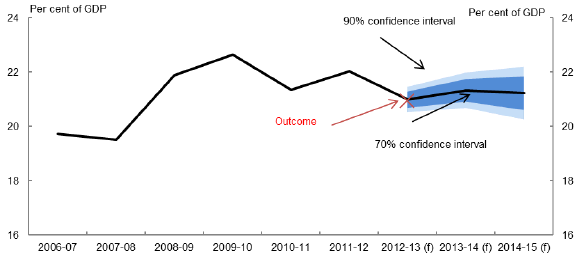
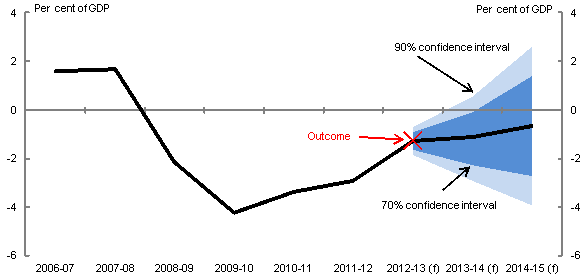
As discussed in section 2, an alternative approach, which takes account of uncertainty only in the fiscal variable, is the no-GDP-error approach. Charts 7, 8 and 9 report receipts, payments and the underlying cash balance as shares of GDP but with confidence intervals based on the no-GDP-error approach (see equation (1) above).
Charts 7-9 suggest that there is substantial uncertainty around the fiscal forecasts and this uncertainty grows over time. They suggest that, at the time of the 2013-14 Budget, the widths of 70 per cent confidence intervals for forecasts in 2014-15 were roughly $60 billion for receipts, $20 billion for payments and $70 billion for the underlying cash balance. (We get similar results when using an alternative approach described in Appendix B.)
The 70 per cent confidence intervals for the underlying cash balance are wider than for both receipts and payments (see Charts 7-9) reflecting the forecast errors for receipts and payments tend to be negatively correlated. (The correlation coefficients between the forecast errors for the cumulative growth rates for receipts and payments are around -0.2 for the 2013-14 forecast year and -0.3 for 2014-15.) To understand this point, suppose the underlying cash balance was initially forecast to be zero and then there were forecast errors for both receipts and payments equal to ½ a per cent of GDP. If these errors were in the same direction, they would cancel each other out, with no impact on the underlying cash balance. However, if the forecast errors were in opposite directions, the forecast error for the underlying cash balance would be 1 per cent of GDP (around $17 billion in 2014-15).
Chart 7: Receipts (excluding GST) as a percentage of GDP
(no-GDP-error approach)
Note: The central line shows the outcomes and point estimate forecasts in the 2013-14 Budget. Confidence intervals use root mean squared errors (RMSE) for Budget forecasts from the 1998-99 Budget onwards. RMSE do not reflect forecast errors caused by policy decisions taken after the relevant Budget. Confidence intervals do not reflect uncer
tainty about nominal GDP. (f) are forecasts. Before the 2009-10 Budget, a projection rather than a forecast was made for the year after the budget year. The outcome is based on information available at the time of the Final Budget Outcome.
Source: Budget papers and Treasury.
It is worth noting that the different ways of characterising uncertainty around the fiscal variables lead to significantly different measures of uncertainty. For example, the reported confidence intervals for receipts as a share of GDP in 2013-14 and 2014-15 are wider in Chart 7 (based on the no-GDP-error approach) than Chart 4 (based on share of GDP forecasts). This is because forecast errors in GDP are strongly positively correlated with forecast errors in receipts, with a correlation coefficient between the forecast errors for the cumulative growth rates for receipts and nominal GDP of 0.6 for both the 2013-14 and 2014-15 forecast horizons. As a consequence, the impact on the forecast error of the ratio of receipts to GDP from these two sources is offsetting.
Chart 8: Payments (excluding GST) as a percentage of GDP
(no-GDP-error approach)
Note: See note to Chart 7.
Source: Budget papers and Treasury.
The confidence intervals for payments are smaller in Chart 8 (based on the no-GDP-error approach) than Chart 5 (based on share of GDP forecasts). This reflects a negative correlation between the forecast errors of payments and nominal GDP, with a correlation coefficient between the cumulative growth rate forecast errors of payments and nominal GDP of roughly -0.5 for both the 2013-14 and 2014-15 forecast horizons. As a consequence, the impact on forecast errors of payments as a share of GDP from these two sources is not offsetting as was the case for receipts.
Chart 9: Underlying cash balance as a percentage of GDP
(no-GDP-error approach)
Note: See note to Chart 7.
Source: Budget papers and Treasury.
The confidence intervals around the underlying cash balance as a share of GDP are similar based on either the share of GDP forecast errors (Chart 6) or no-GDP-error approach (Chart 9).
We have seen that the different ways of estimating uncertainty around the fiscal variables sometimes leads to significantly different measures of uncertainty. When the variable of interest is the level (or dollar value) of receipts, payments or the underlying cash balance, it is more appropriate to focus on confidence intervals that reflect uncertainty around these levels. The no-GDP-error approach provides a way of doing this.
Measures of uncertainty around fiscal variables are not common. However the CBO, when calculating confidence intervals around the primary surplus, uses a procedure based on normalised forecast errors (in the spirit of our no-GDP-error approach), though they normalise relative to revenue rather than GDP (CBO, 2007b).
For the underlying cash balance (as a share of GDP) in Charts 6 and 9, the width of Treasury's 70 per cent confidence interval for the budget year is around 2.2 percentage points. This compares to the US Congressional Budget Office's equivalent confidence interval around the budget balance of about 1.7 percentage points for the current year (although the forecast horizon is different with the CBO often forecasting for the year that has already begun rather than the year about to begin). For the subsequent year, the width of the Treasury confidence interval is a little over 4 percentage points compared to the CBO estimate of around 3 percentage points (CBO, 2007b). The UK Office for Budget Responsibility reports confidence intervals for the cyclically-adjusted budget balance which is appropriate for their purposes (as the UK Charter for Budget Responsibility defines the fiscal mandate in terms of this measure), though this makes it difficult to compare to Australia's underlying cash balance measure.
9 Confidence intervals based on the average annual growth rate and cumulative growth yield very similar results for the level of nominal GDP, as would be expected.
10 In the Budget, point estimates of these forecasts are reported rounded to the nearest quarter of a percentage point. Charts similar to Charts 1 and 2 were publishing in the 2013 PEFO, though they reported the PEFO forecasts of the Treasury and the Department of Finance and Deregulation.
11 The confidence intervals around the 2012–13 forecasts in this and subsequent charts are based on forecasts from the 1998–99 Budget to the 2013–14 Budget (16 observations), with the forecast from the 1998–99 Budget being for the financial year 1997–98. The confidence intervals for the 2013–14 forecasts are based on forecasts from the 1998–99 to 2012–13 Budgets (15 observations). Similarly, the 2014–15 confidence intervals are based on 14 observations. The sample periods reflect the availability of data on outcomes. The confidence intervals in this and the other graphs are broadly similar if they are calculated excluding 2008–09 and subsequent financial years which could have been effected by the global financial crisis.
12 To calculate the forecast errors for the shares, an adjustment has been made to allow for historical revisions to GDP. This is particularly relevant because the September 2009 National Accounts moved to the new international standard (SNA08) which made several significant revisions to the GDP historical data. For example, GDP was revised to consider research and development as capital formation rather than as a business expense. The effects of the revisions were to increase the historical level of nominal GDP by between 1.5 and 3 per cent. Hence a ratio to GDP forecast on the previous basis cannot be compared to an outcome on the current basis. Growth rates were largely unaffected by the revision. Therefore, forecasts of nominal GDP growth have been applied to the historical GDP series (as at the June quarter national accounts release) to generate forecast shares that allow comparisons between forecasts and outcomes on a more comparable basis.