Treasury submission to House of Representatives Economics, Finance and Public Administration Committee public inquiry
August 2006
Exports of services have slowed recently, partly reflecting the adverse effects of the exchange rate appreciation in 2002-2004. Tourism-related service exporters suffered from the blows to the confidence of travellers from terrorist attacks and SARS, and are currently being challenged by lower costs of travelling to competing destinations and an emerging preference for shorter journeys. Education exporters are facing a more competitive market.
Australia’s exporters of services receive government support through the provision of direct financial assistance and the promotion of Australia as a destination, as well as the supply of market intelligence and representation in international forums.
Introduction
Australia exported services worth around $37 billion in 2005, which contributed around 4 per cent to GDP. Australia’s service exports are larger than rural exports, and of a similar size to manufactures exports. The main service exports are services to tourists in Australia (around $11 billion in 2005), passenger transport ($7billion), education ($7 billion), and financial and insurance services ($1 billion). A variety of other business services are also collectively significant ($4 billion). Our main markets have long been the United States, Japan and the United Kingdom, but China has been growing in importance and is now the fifth largest market (with New Zealand fourth) for Australia’s service exports.
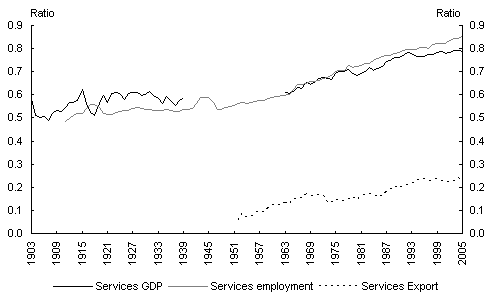
Over the longer term, services have been comprising an increasing share of Australian exports, just as they are an increasing share of total domestic production and employment (Chart 1). However, as many services such as haircuts and restaurant meals are not traded, the share of services in exports is lower than their overall importance in the economy. This is consistent with the pattern seen in other advanced economies. Service exports increased their share of OECD exports from under 20percent to almost 22 per cent between 1983 and 2003 (Pain and van Welsum 2004).
Chart 1: Australia’s services sector; proportion of total

Source: Australian Bureau of Statistics; Butlin (1962).
It should be noted that the statistics used in this submission only cover services ‘exported’ from Australia. They therefore exclude an important mode by which Australian firms and individuals provide services to foreigners, which is through Australian firms establishing subsidiary commercial presences (or franchises) in foreign countries (McLachlan, Clark and Monday 2002).1 Furthermore, the statistics on exports of services do not include domestic services embedded in the value of exported goods (perhaps accounting for one-fifth of their value).
What are the recent trends in services exports?
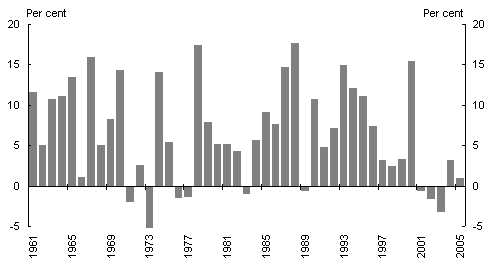
Growth in Australia’s exports of services has slowed over the past decade, abstracting from the spike and subsequent unwind associated with the 2000 Sydney Olympics and September 11 terrorist attacks (Charts 2 and 3). This has occurred despite improved technology and communications, and deregulation of markets, making many services increasingly tradeable (McLachlan, Clark and Monday 2002).
Chart 2: Australia’s exports of services
(Chain volume measure; annual percentage change)

Source: Australian Bureau of Statistics.
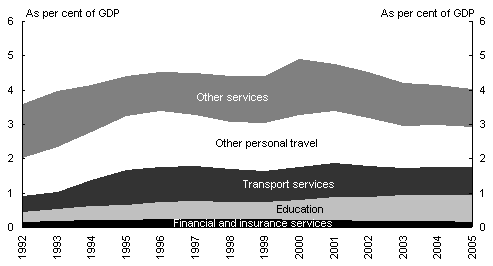
Services provided to travellers are the largest component of Australia’s exports of services but education has been the fastest growing (Chart 3).2
Chart 3: Australia’s exports of services (nominal)

Source: Australian Bureau of Statistics cat. no. 5302.0.
Tourism
There were around 5 million short-term visitor arrivals in Australia in 2004-05 (up from just over a million twenty years ago, and under 100,000 before the 1960s).3 Just over half stated the main reason for coming as a holiday, a fifth were visiting friends or relatives and a tenth were on business.4 The majority were destined for New South Wales or Queensland. The top source countries were the well-established markets of New Zealand, Japan, the United Kingdom and the United States. But the fifth-ranked source was the fast-growing China.
Education
A success story in the Australian economy over the past twenty years has been the sale of education to the rest of the world (Chart 3). From under 5,000 international students in 1986, the first year public institutions were permitted to enrol them and charge fees, numbers rose to around 50,000 by 1992 (out of a global market of around 1 million students5). Some surveys suggested Australia appealed due to its proximity to Asia, pleasant lifestyle and safety, and the possibility of later migration, more than the quality of its education (IAC 1991a and Mazzarol 1994). A study concluded that Australia was cheaper than Canada, the United Kingdom and the United States but more expensive than New Zealand as a destination for foreign students, taking into account both tuition fees and living expenses (IDP 2001). The emergence of a larger middle class in countries in east Asia which have long placed a high value on education provided a ready source of students. International student numbers fluctuated with changes in visa regimes (IAC1991a).
While there was a short-lived dip following the 1997 Asian crisis, demand continued to grow once those economies recovered. International students studying in Australia now number around 200,000. This places Australia behind only the United States, United Kingdom and Germany as a destination (Wooldridge 2005). Almost a third of the overseas students in Australia come from China and Hong Kong, with India, Malaysia and Indonesia the other main sources.
It has also been estimated that foreign students attract an average of 1.3 friends and relatives to visit during their study here (Davidson and Spearritt 2000).
Passenger transport
Australia’s service exports include fares for foreign travellers on Australian airlines. As these customers are mostly flying to, within or from Australia, export receipts tend to fluctuate with tourist arrivals.
Business services
Australia has gradually developed more expertise in business services and is increasingly exporting them. DFAT (2001) notes that there ‘continues to be a strong demand for Australian lawyers, accountants, engineers and architects, particularly in our region, and many environmental services firms are seeking to exploit new and emerging market opportunities overseas’. Australia’s expertise in mining operations provides some potential for exporting services here, although at present mining experts are in very strong demand for domestic projects.
Sydney (as well as, to a lesser extent, other Australian cities) competes with Hong Kong and Singapore to be an Asia-Pacific regional headquarters for global firms. It is disadvantaged by its more peripheral location but can offer a less hectic and ‘greener’ lifestyle and lower costs.
Other government services
Some services, such as technical advice and training by government agencies, are exported as part of aid packages or cooperative defence arrangements. There have also been a number of consultancies provided by government agencies on a commercial basis (Industry Commission 1997). Some government-owned corporations such as Australia Post are also involved in exports of services, as is the partly-owned Telstra.
What are the main determinants of service exports?
The demand for services rises more than proportionately as incomes increase. Demand for international services probably expands more than demand for domestic services. This explains why over recent decades international trade in services has been growing faster than world GDP. This is consistent with econometric studies finding income elasticities of demand above one (Pain and van Welsum 2004). It suggests there is scope for strong growth in Australia’s service exports. Another indicator of potential is the finding by LEK (1994) that only 1 per cent of Australian service companies were involved in exporting in the early 1990s. LEK expressed the view this could grow to 10per cent.
Visitor numbers
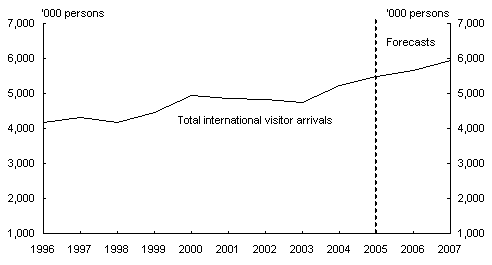
From the mid-1980s to the mid-1990s there were large increases in tourist numbers (Chart 4). Travel to Australia had become cheaper and offered greater potential to attract international visitors, although there seemed to be a delay in responding to these possibilities.
Chart 4: Overseas visitor arrivals

Source: Tourism Australia (2006).
During the 1980s and 1990s most capital cities opened convention centres and casinos to attract more than the traditional tourists (Davidson and Spearritt 2000). They also competed to attract major sporting events such as the Formula 1 Grand Prix. Glamorous island resorts were built in Queensland. All this innovation, some of it ahead of demand, sustained growth in international visitor arrivals. In 1983 Australia’s share of global visitor arrivals was 0.3 per cent; by 2003 it had reached 0.7 per cent.
There was a surge in overseas visitors associated with the 2000 Olympics, but a subsequent flat period as the September 11 terrorist attacks discouraged international travel. This global slump in tourism lasted until 2004. More recently visitor numbers to Australia have slowed again. While surveys suggest Australia retains appeal as a holiday destination, it may have lost some of its ‘novelty value’. Furthermore, there is a global trend towards shorter flights, partly attributed to busier lifestyles. In Europe and Asia, this trend has been encouraged by the advent of new airlines which offer cheap flights within the region but not across the world. Furthermore, concerns about terrorist attacks and SARS may have discouraged some American tourists from taking the long flight to this region. Nonetheless Tourism Australia is optimistic that tourism numbers will keep growing. A possible threat would be avian flu mutating into a form that leads to a human pandemic (Beutre et al 2006). The effect of higher oil prices on international airfares has also hurt Australia as a destination, given our remoteness and consequently high fuel costs.
As well as the numbers of arrivals, the composition also matters. For example, independent wealthy visitors are likely to spend more on Australian goods and services. By contrast, tour groups may be more frugal and be accommodated in foreign-owned hotels. Backpackers spend much less per day than other visitors, but stay for longer periods and travel to more remote destinations.
Education
Competition is intensifying in the Asia-Pacific education market as Asian universities are offering modern facilities. Some Australian universities are responding to this competition by offering courses in Asia rather than requiring students to come to Australia.6 This allows them to offer part-time as well as full-time courses, which may be more attractive to students who do not wish to interrupt their careers.
Relative price effects
The notable appreciation of the Australian dollar from late 2002 to early 2004 had a significant impact on service exports. Its more recent quiescence may well support a recovery in the growth of service exports in 2006-07. (One cause of the recent (real) appreciation was the strong prospects for the resources sector. This ‘Gregory thesis’ effect is discussed in Treasury’s submission to the inquiry into manufactures exports; see page 80 of this issue of Economic Roundup .)
The impact of relative price movements on exports of services depends on the size of the price elasticity. There has been much less modelling of services than goods exports. There are some estimates for Australia’s ‘non-commodity’ exports, which are about half services and half manufactures. A recent IMF (2004) study concluded that the price elasticity for these exports was insignificantly different from zero over 1984-2002. The price elasticity is also estimated as very low in the short run in Treasury’s economy-wide model, TRYM, but reaches almost -2 in the long run. International studies typically conclude that price elasticities for services are smaller than those found for merchandise trade. The overall price elasticity for services exports is typically around -0.2 to -0.4, with travel-related services being more elastic and business services relatively inelastic (Pain and van Welsum 2004).
The IAC (1989) review of the tourism industry highlighted the cost and availability of transport as crucial to attracting international tourists. At that time, airfares to and from Australia could typically account for half the cost of a holiday and once in Australia, domestic transport for a fifth of their spending.
Government support for service exporters
The Government and its agencies continue to advocate freer global markets for services, but reducing barriers is more complex than it is for trade in goods. McLachlan, Clark and Monday (2002) comment that ‘typical government related barriers encountered by Australian service exporters include foreign equity limitations, lack of recognition of qualifications, restrictions on the issue of licences, various restrictions on commercial presence such as the number and location of branches and restrictions on the forms of commercial presence’. WTO members (including Australia) signed the first agreement covering international trade in services (known as GATS) in 1995. The Doha summit in 2001 launched a round of talks aiming to reduce barriers to trade in services (among other areas). McLachlan, Clark and Monday (2002) cite studies suggesting eliminating such barriers would raise Australia’s annual income by around A$3 billion, and the world’s income by around US$130 billion.
The Productivity Commission (2005) estimates total government assistance to tourism (both domestic and international, and both directed and incidental) as around $1billion a year, after taking account of around $0.1 billion in tariffs imposed on inputs used by it. They comment that ‘tourism receives relatively less assistance from the Australian government than do manufacturing and primary production industries on average but relatively more assistance than many other services’. Tourism Australia promotes Australia as a holiday destination overseas. It also provides market intelligence and forecasts.
Of course, service exporters benefit from general economic policy. Sound macroeconomic policy has led to low and steady inflation and low interest rates. Microeconomic reforms have enhanced domestic competition, and removed unnecessary impediments to business activity such as inefficient government processes or excessive regulation, thereby providing
business a sound basis on which to plan. Good government helps attract tourist and business visitors by making Australia a safe and environmentally attractive destination.
As described more fully in Treasury’s submission to the inquiry into manufactures exports, the resources boom is leading to other exports growing more slowly than they otherwise would. But this is not undesirable: it is in the national interest for resources to be allocated to their most efficient use. Furthermore, Australia’s pursuit of liberalisation of trade in services, which forms part of the Doha round, is directed at achieving improved markets for Australian service exporters.
References
Brown, L, Hawkins, J and Kiang, T 2006, ‘Trade in services’, work in progress.
Buetre, B Kim, Y, Tran, Q, Thomson, J and Gunasekera, D 2006, ‘Avian influenza: potential economic impact of a pandemic on Australia’, Australian Commodities, vol 13, no 2, June quarter, pp 351-9.
Butlin, N 1962, Australian Domestic Product, Investment and Foreign Borrowing 1861-1938/39, Cambridge University Press.
Davidson, J and Spearritt, P 2000, Holiday Business: Tourism in Australia since 1870, Miegunyah Press, Melbourne.
Department of Foreign Affairs and Trade 2001, ‘Australia and the WTO negotiations on trade in services: challenges and opportunities for the Australian services sector’.
Harris, J and Hawkins, J 2006, ‘How international investment income flows affect Australia’s balance of payments’, Economic Roundup, Winter, Treasury, pp 59-72.
IDP Education 2001, Comparative Costs of Higher Education Courses for International Students in Australia, New Zealand, United Kingdom, Canada and the United States. Sydney.
Industries Assistance Commission 1989, Travel and Tourism, IAC report no 423, September.
Industries Assistance Commission 1991a, Exports of Education Services, IAC report no 12, August.
Industries Assistance Commission 1991b, Exports of Health Services, IAC report no 16, December.
Industry Commission 1997, Export of Government Services, December. Canberra.
International Monetary Fund 2004, ‘Australia: selected issues’, IMF country report, no.04/354, November.
LEK Partnership 1994, Intelligent Exports and the Silent Revolution in Services, AusTrade, Sydney.
Mazzarol, T 1994, ‘A model of sustainable competitive advantage for services exports: the example of Australian education’, Institute for Research into International Competitiveness working papers, no. 94:11, Curtin University, Perth.
McLachlan, R, Clark, C and Monday, I 2002, Australia’s Service Sector: a Study in Diversity (especially Chapter 5), Productivity Commission Staff Research paper, March, AusInfo, Canberra.
Pain, N and van Welsum, D 2004, ‘International production relocation and exports of services’, OECD Economic Studies, no. 38, Paris.
Productivity Commission 2005, ‘Assistance to tourism: exploratory estimates’, Productivity Commission Research Paper, April.
Tourism Australia 2006, ‘Forecast Summary’, April.
Wooldridge, A 2005, ‘The brains business: a survey of higher education’, The Economist, 10 September.
1 In this case, the income accrued will appear in the income account of the balance of payments. See Harris and Hawkins (2006) -- pages 59-72 of this issue of Economic Roundup -- for a description of Australia’s international income flows.
2 The category ‘other personal travel’ in Chart 3 includes spending on hotel rooms, entertainment and souvenirs, even though some of these are ‘goods’ rather than ‘services’.
3 Short-term visitors are those who report their intended length of stay as less than 12 months.
4 One growing category is ‘health tourism’ whereby people combine a holiday with medical treatment (IAC 1991b). The other major source of ‘exports’ of health services is medical treatment for foreign students in Australia.
5 Most of the increase in Australia’s market share was at the expense of the United Kingdom, although Japan’s restrictions on their intake of Chinese students from 1986 also helped.
6 Depending on how this is structured, the tuition fees may show in the net income balance of the balance of payments rather than as a service export.