Treasury has published annual estimates of Australian net private sector wealth since the Summer 1990 Economic Roundup. This article updates previous estimates, and provides preliminary estimates for net private sector wealth as at June 2002.
The market value of Australian net private sector wealth grew by 12.6 per cent in the year to 30 June 2002. In real terms (that is, after allowing for inflation1), wealth grew by 10.9 per cent. Real wealth per Australian grew by 9.6 per cent.
Wealth definitions and uses
From an economic perspective, wealth can be defined as 'a store of spending power that can be carried into the future' (Jones and Perkins 1986, p. 150). Therefore, wealth includes a wide variety of assets, both financial assets, such as cash, shares and bonds, and non-financial assets, such as dwellings, factories and other business assets that can be used to generate future income.
Measurements of the store (or `stock') of spending power, such as wealth, complement measurements of the production (or `flow') of income, such as gross domestic product (GDP). Wealth thus provides a useful additional measure of living standards as well as a benchmark for examining trends in such aggregates as external liabilities and private sector debt. In addition, wealth appears to be a significant determinant of current and future aggregate private consumption.
Wealth can also include a variety of other less tangible assets that are sometimes referred to as 'human wealth'. Human wealth includes, for example, the skills, education and social structures that contribute to capacity to generate income in the future.
In addition, a broader definition of wealth might include such assets as natural resources or even leisure time or aesthetic qualities.
Measuring wealth
From a practical perspective, some components of wealth can be extremely difficult to quantify. In particular, it is difficult to value those assets that are not readily tradeable and hence for which there are no readily observable prices. This is often the case for the various components of human wealth and some natural resources. As a result, the estimates in this article relate only to financial assets and non-financial (or physical) assets in those cases where there are well-developed markets and observable prices.
The scope of the estimates presented in this article is the Australian private sector. This consolidation of the private household and business sectors greatly simplifies the calculation of private sector wealth.2 However, this consolidation does result in loss of detail on the liabilities of these two sectors. Consequently, the data on asset types contained in the attached tables and charts should not be used to infer relative ownership by either the household or business sectors, or the level of personal wealth.3
A number of assumptions and approximations are required to construct these estimates, particularly for the latest year where much of the data remain provisional. Together with inevitable revisions to historical data, these limitations imply that the estimates should be interpreted as indicative of trends and broad orders of magnitude, rather than precise estimates.
The Australian Bureau of Statistics (ABS) also publishes estimates of wealth. The Appendix has a discussion of the relationship between these estimates and the Treasury estimates.
Methodology - How is wealth measured?
The wealth estimates presented in this article are a measure of the value of net domestic and foreign assets owned by the Australian private sector. These estimates are constructed using the inventory approach4, largely following the methodology of Callen (1991). This approach involves aggregating across different asset types and adjusting for the public and/or foreign ownership5 of assets. The estimates are largely based on ABS estimates of the dwelling stock, business capital stock, stock of consumer durables and Australia's international investment position. Reserve Bank of Australia (RBA) data are used for holdings of public securities and RBA liabilities. Some private sector data and estimates from previous studies also enter the estimates.
Treasury estimates of net private sector wealth are calculated on both a market value and replacement cost basis. The market value of an asset represents the value that would be obtained if assets were to be sold in current market conditions. The replacement cost of an asset is the cost of reproducing that asset.6 Detailed wealth estimates since 1960 are presented in the attached tables.
Private saving and wealth
The pure economic definition of saving is the change in the real net wealth of households from one period to the next.7 Therefore, the annual change in real private sector wealth can be interpreted as the annual economic saving of the private sector.
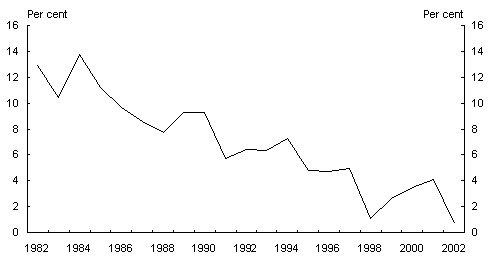
As a measure of private saving, the change in private wealth has advantages to the commonly quoted net household saving measure published by the ABS (see Chart 1). The main advantage is that it captures the effect of changes in the value of the stock of private wealth through changing asset values. However, these valuation effects can mean that it is more volatile than measures that exclude them.
A further advantage is that it has a broader scope. Household saving as measured by the ABS refers only to saving by the household sector, including unincorporated enterprises. It does not include changes in the value of the household sector's interest in private corporations. As private corporations are ultimately owned by households, saving by private corporations is conceptually also household saving.
Chart 1: ABS net household saving ratio
Source: ABS 5206.0.
Movements in Australian private sector wealth in 2002
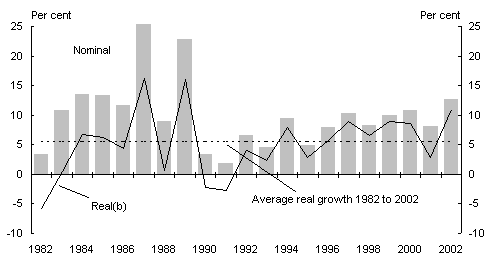
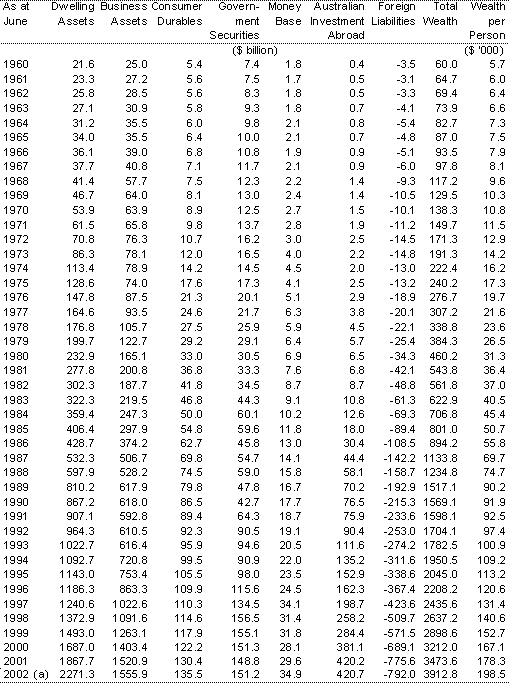
Through the year to 30 June 2002, Australian net private sector wealth at market value grew by 12.6 per cent in nominal terms, 10.9 per cent in real terms and 9.6 per cent in real per capita terms. The growth rate in real net private sector wealth during the year to June 2002 was the highest for more than a decade (Chart 2). The tables in the Appendix provide further details.
Chart 2: Growth in Australian net private sector wealth
at market value(a)
(a) As at June 30.
(b) Real wealth is determined using the consumption deflator. This includes the transitional impacts of the New Tax System.
Source: Treasury.
In current prices, Australian net private sector wealth was approximately $3,913 billion at market value and $2,682 billion at replacement cost on 30 June 2002. This represents around:
- $198,500 per Australian ($136,100 on a replacement cost basis); and
- 5.5 times the value of the annual nominal gross domestic product of the economy (3.8 times on a replacement cost basis).
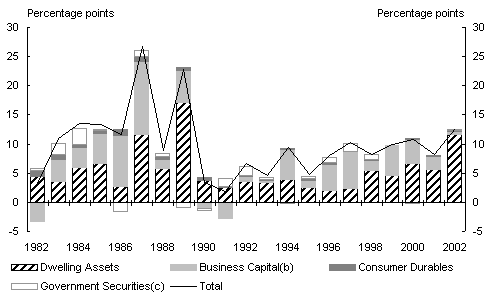
In the year to June 2002, growth in the market value of dwelling assets dominated growth in all other forms of assets, contributing 11.6 percentage points to the growth in private wealth, more than double the long-term average contribution to growth of 5.6 percentage points (see Chart 3). The other m
ain contribution to growth in wealth over the period was from business assets (net of net foreign liabilities), which contributed 1.0 percentage points. This contribution, the lowest since 1993, was well below the long-term average contribution to growth of 4.1 percentage points.
Chart 3: Contributions to growth in nominal
Australian net private sector wealth at market value(a)
(a) As at June 30.
(b) Includes Australian investment abroad and excludes foreign liabilities.
(c) Includes money base.
Source: Treasury.
Valuation ratios for Australian net private wealth
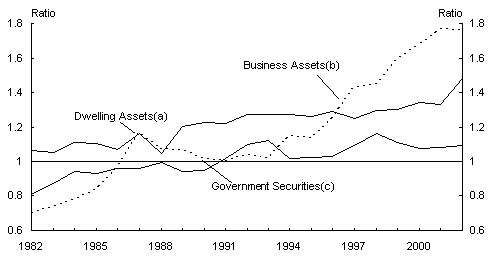
Valuation ratios for individual components of wealth (Appendix Table A3) provide a measure of the relationship between the market value and the replacement cost for that component. For dwelling assets, the valuation ratio represents the ratio between the price of established houses and the cost of building new dwellings (inclusive of land). The valuation ratio for business assets is the ratio between the price of existing business assets (as valued by the stock market) and the price of new business investment. The valuation ratio for government securities is determined by current interest rates relative to the interest rates at the time the securities were issued. If there is an unanticipated fall in interest rates relative to the interest rate at the time of issue then the value of the security rises and vice versa.
Changes in market conditions for particular components of wealth (for example, dwellings) will affect the valuation ratio for that component. Changes in market sentiment and business confidence will lead to changes in individual valuation ratios and fluctuations in the total market value of private sector wealth. The value of wealth at replacement cost is not directly affected by these changes in sentiment or confidence, and hence is more stable.
Over time, the valuation ratios of the different components have performed differently (Chart 4).
Chart 4: Valuation ratios for selected components of wealth
(a) Established house prices divided by the deflator for dwelling investment.
(b) Equity prices divided by the deflator for business fixed investment.
Market price divided by face value.
Source: Treasury.
During the year to 30 June 2002:
- The valuation ratio for dwelling assets increased by 11.5 per cent. This increase, the largest since 1989, is a direct result of substantial house price increases throughout the country. The ABS House Price index reported a broad-based rise in house prices of 18.9 per cent in the year to June 2002, with the Sydney (up 21.7 per cent) and Melbourne (up 19.0 per cent) markets particularly strong.
- The valuation ratio for business assets fell slightly for the first time in seven years, reflecting a fall in stock market prices.
- The valuation ratio for government securities rose slightly, commensurate with movements in interest rates in 2001-2002.
Composition of Australian net private wealth by type of asset
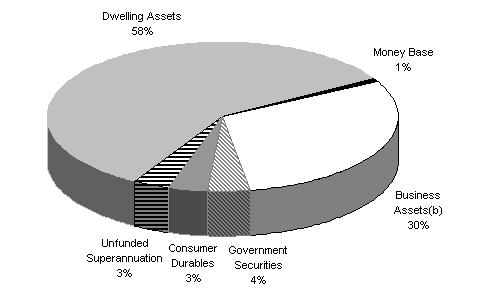
The composition of wealth at market value by asset type shifted slightly during the year to 30 June 2002 (Chart 5). Dwelling assets comprised a greater proportion of Australian net private sector wealth while the share of business assets declined.
Chart 5: Composition of Australian net private sector wealth
by asset type(a)
(a) The components do not necessarily sum to 100% due to rounding.
(b) Includes Australian investment abroad and excludes foreign liabilities.
Source: Treasury.
An international comparison of wealth
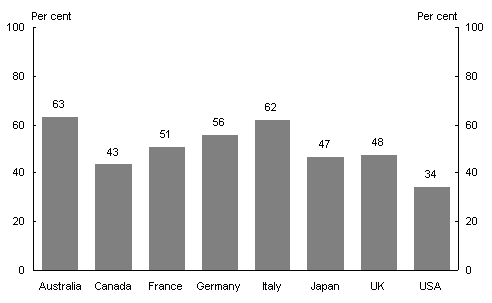
Australian households hold a greater share of their wealth in dwelling assets than households in most G-7 nations (Chart 6). The high concentration of Australia's population in the largest cities, where house prices tend to be highest, is likely to contribute to average house prices being higher and the share of wealth in dwelling assets being higher than in other countries.8 This difference cannot be fully explained by policies that affect the relative attractiveness of dwellings or home ownership rates.
Chart 6: Share of dwelling assets in total assets
Source: OECD Economic Outlook, ABS 5206.0 and 5232.0, Treasury.
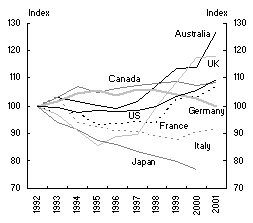
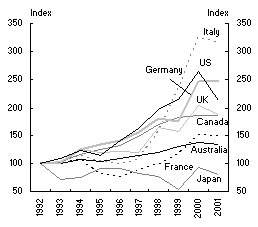
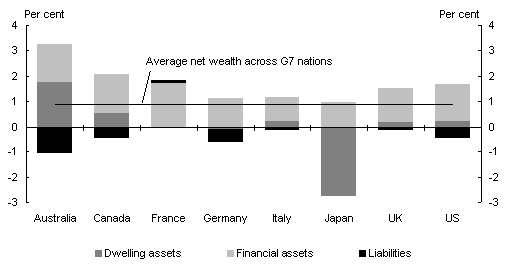
Recent rates of growth in Australian net wealth compare favourably to the G-7 nations.9 Over the last decade10, growth in Australian net household wealth has averaged 2.4 per cent, higher than the G-7 average of 0.9 per cent (Chart 7).
Chart 7: Composition of net household wealth
as a percentage of income
(average annual growth 1991-2001)(a)
(a) Data for Japan are only available for 1991-2000, and data for Australia are only available for 1992-2001.
Source: OECD Economic Outlook, ABS 5206.0 and 5232.0, Treasury.
Movements in house prices and equity prices varied widely across countries over the decade (Charts 8 and 9).11 These price movements, together with the difference in wealth composition across countries, helps to explain net wealth growth over the period. For instance, dwelling assets contributed more to net household wealth growth in Australia than any of the G-7 countries, reflecting substantial house price growth and the large share of wealth held in dwellings.
|
Chart 8: Dwelling assets(a) |
Chart 9: Equity assets(a) |
|
|
|
|
(a) Dwelling assets as a per cent of disposable income. |
(a) Equity assets as a per cent of disposable income. This only includes direct equity holdings, with the exception of Australia where total financial assets are used. |
References
Australian Bureau of Statistics Australian System of National Accounts (ABS Cat. 5204.0).
Australian Bureau of Statistics Australian National Accounts: National Income, Expenditure and Product (ABS Cat. 5206.0).
Australian Bureau of Statistics Australian National Accounts: Financial Accounts (ABS Cat. 5232.0).
Australian Bureau of Statistics Australian National Accounts: National Balance Sheet
(ABS Cat. 5241.0.40.001).
Bacon, B.R. 1998, Household Wealth and The Aged: An Income Distribution Survey Analysis, Sixth Colloquium of Superannuation Researchers, University of Melbourne, July 198, Conference Paper No. 3.
Callen, T. 1991, Estimates of Private Sector Wealth, Reserve Bank of Australia, Research Discussion Paper 9109.
Department of the Treasury 1990, `Private Sector Wealth Estimates in Australia' Economic Roundup, Summer 1990, Australian Government Publishing Service, Canberra.
Department of the Treasury 1996, `Documentation of the Treasury Macroeconomic (TRYM) Model of the Australian Economy', Treasury, Canberra.
Department of the Treasury 1999, `The Measurement of Saving in Australia' Economic Roundup, Spring 1999, Australian Government Publishing Service, Canberra.
Ellis, L. and D. Andrews 2001, City Sizes, Housing Costs, and Wealth, Reserve Bank of Australia, Research Discussion Paper 2001-08.
International Monetary Fund, April 2002 World Economic Outlook.
Jones, R.S. and J.O.N. Perkins 1986, Contemporary Macroeconomics, 2nd edn, Prentice-Hall, Sydney.
OECD Economic Outlook, Volume 2002/03, No. 72 December.
Piggott, J. 1987, The Nation's Private Wealth - Some New Calculations for Australia, The Economic Record, March.
Appendix
Relationship with the ABS national balance sheets
The Treasury net wealth estimates presented in this article are broadly consistent with those published in the ABS publication, Australian National Accounts: National Balance Sheet (ABS Cat. 5241.0.40.001). The main differences are that the scope of the Treasury estimates is the aggregate private sector and that the Treasury estimates are prepared using a consistent basis for valuing the assets. In addition, the Treasury estimates are available for a much longer time period, thus allowing longer-term analysis of past changes in wealth.
In terms of scope, the Treasury estimates cover the total private sector in Australia. In contrast, the ABS balance sheets are prepared for a range of institutional sectors and for Australia as a whole, but not for the private sector as such. In terms of the ABS institutional sector classifications, the private sector is the sum of the ABS household and unincorporated enterprise sector and the private sector components of each of the non-financial corporation and financial corporation sectors.
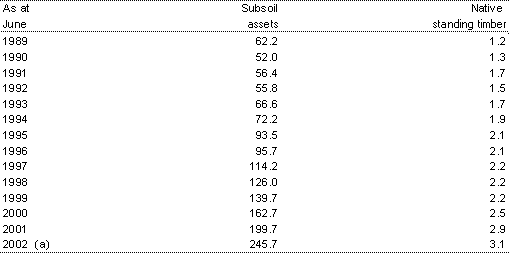
In terms of scope, the major difference is that the ABS estimates include the value of demonstrated sub-soil assets and timber in native forests. These assets are not included within the Treasury estimates for two reasons. First, the ABS estimates for these assets typically only go back to 1989; the Treasury wealth estimates are calculated for each year back to 1960. Second, the valuation of these assets is difficult. The ABS valuations involve `calculating the expected future net income flow generated by the asset, and then discounting at some interest rate for the life of the asset'. These figures cannot easily be added to the Tables below, since it is unclear to what extent these assets are already included in the valuations of businesses. In addition, comparisons with pre-1989 data will obviously not be possible.
Another important difference between the ABS and Treasury estimates is the valuation basis that is used. As noted earlier in this article, the Treasury estimates are compiled on both a market value and replacement cost basis. In contrast, the ABS uses a replacement cost basis for produced assets and a market value basis for financial assets and liabilities. As a result, the ABS estimates of 'net worth' (or wealth) are actually based on a mix of these two valuation methodologies.
Table A: ABS valuations of sub-soil and native timber assets
(a) Preliminary figures.
Source: ABS 5204.0
It is possible to reconcile the main components of the Treasury estimates of wealth at replacement cost with the estimates of produced assets in the ABS balance sheets, although allowance needs to be made for the differences in scope and coverage. While it is not generally possible to derive estimates of wealth at market value from the ABS balance sheets, it is possible to infer an estimate of the valuation ratio (the ratio of the market value of an asset to its replacement cost) for business assets. This is because the net financial assets held by the combined household and unincorporated, general government and foreign sectors (valued at market prices) should represent claims over the net physical assets held by the financial and non-financial corporation sectors (valued at replacement cost). The ratio so derived is reasonably similar to the valuation ratio for business assets presented in this article, thus confirming that, apart from the scope and coverage issues noted above, the Treasury wealth estimates are broadly consistent with the ABS estimates in the national balance sheets.
Table A1(a): Nominal private sector wealth at market value
(a) Preliminary figures.
Table A1(b): Real private sector wealth at market value(a)
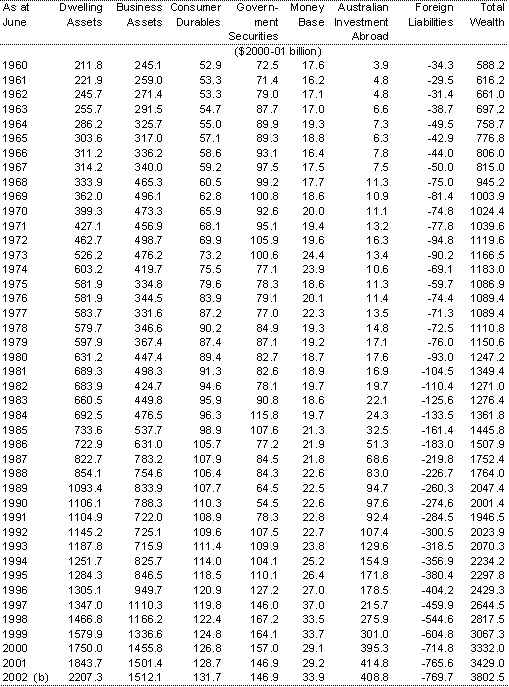
(a) Real wealth is calculated by dividing nominal wealth by the private consumption deflator.
(b) Preliminary figures.
Table A1(c): Real private sector wealth per person at market value(a)
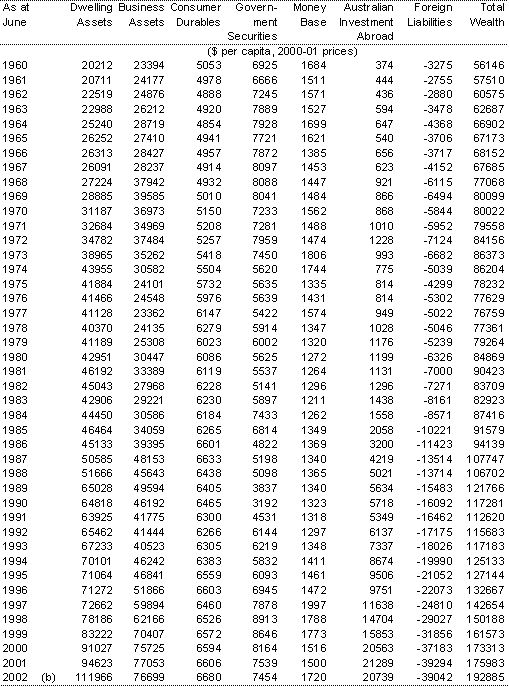
(a) Real wealth is calculated by dividing nominal wealth by the private consumption deflator.
(b) Preliminary figures.
Table A2: Nominal private sector wealth at replacement cost
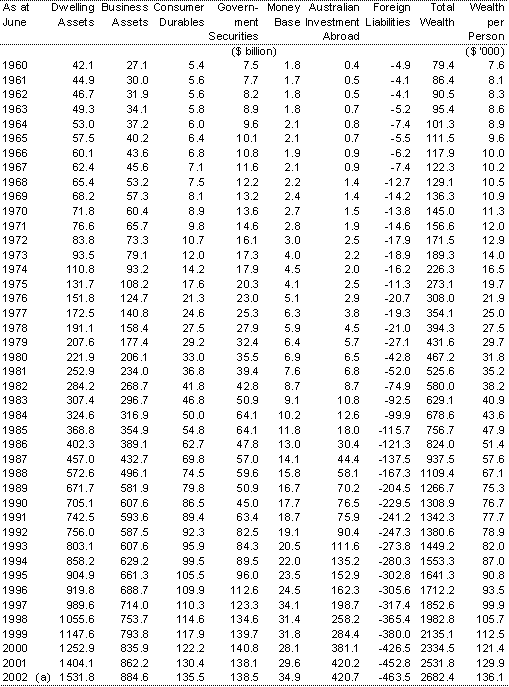
(a) Preliminary figures.
Table A3: Valuation ratios for selected wealth components
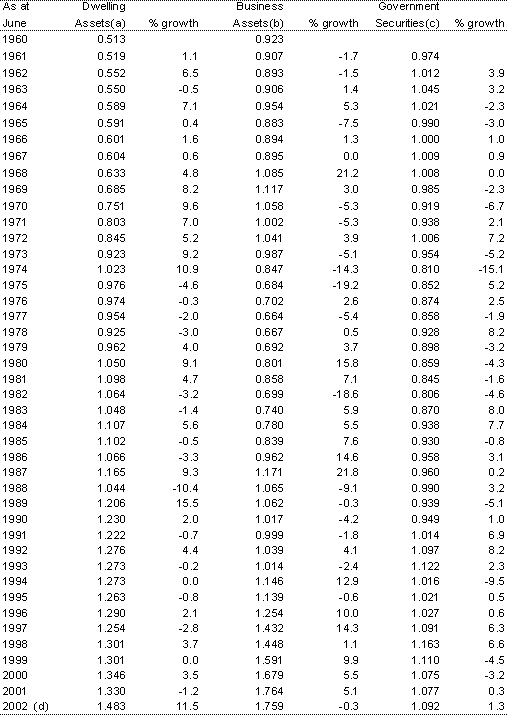
(a) Established house prices divided by the deflator for dwelling investment.
(b) Equity prices divided by the deflator for business fixed investment.
(c) Market price divided by face value.
(d) Preliminary figures.
1 The consumption deflator is used for this purpose.
2 Consolidating the private household and business sectors implies that the bulk of financial instruments held by households (such as bank deposits, debt instruments and superannuation) are netted out in the analysis.
3 Details on assets by sector are available in the ABS publication Australian National Accounts: National Balance Sheet (ABS Catalogue No. 5241.0), and Bacon (1998) discusses household wealth estimates in detail.
4 Other approaches for constructing estimates of wealth include the portfolio and estate methods. Piggott (1987) provides a useful summary of these approaches.
5 The wealth estimates presented in this article measure wealth owned by Australians, regardless of where that wealth is located. For example, an Australian-owned factory located overseas contributes to Australian net private wealth, while an overseas-owned factory located in Australia does not.
6 The (depreciated) replacement
cost is the price which would have to be paid for an identical asset which is in the same condition and expected to yield the same flow of services as the original asset. It is the relevant concept for physical assets such as consumer durables, the stock of dwellings and the business capital stock. The equivalent concept is the face value, which in the case of debt, for example, represents the price (excluding any accrued interest or dividends) which the borrower promises to repay the lender on expiry of the loan.
7 See the article, `The Measurement of Saving in Australia', in the Spring 1999 Economic Roundup.
8 See Ellis and Andrews (2001).
9 Comparisons are based on net household wealth as a percentage of disposable income. Data limitations do not enable a comparison to take place using net private wealth. Data for the G-7 nations is sourced from OECD Economic Outlook, Volume 2002/03, No. 72 December. A comparable household measure for Australia is sourced from ABS National Accounts (5206.0),ABS Financial Accounts (5232.0) and Treasury.
10 The decade ends in 2001 as this is the latest available international data.
11 Dwelling assets as a per cent of disposable income can be used as a proxy for house prices. Similarly, equity assets as a per cent of disposable income can be used as a proxy for equity prices. See Ellis and Andrews (2001).
