James Bond1
Housing plays an important role in Australia’s economic growth and in the welfare of Australians. This article examines developments in the Australian housing market over recent years. It argues that investors have played an increasingly important role in the housing market for both detached houses and apartments.
Housing activity
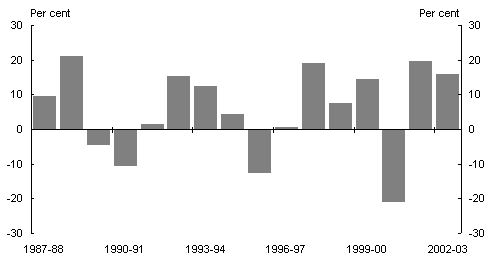
The residential property cycle in recent years has played a significant role in Australia’s overall economic performance. In the past two years, dwelling investment rose by 20percent, and 16percent respectively (see Chart 1) contributing around 1percentage point to GDP growth in each of these years.
Chart 1: Investment in dwellings(a)
(volumes, year average growth)
(a) Includes construction of new dwellings and alterations and additions.
Source: ABS Cat. No. 5206.0.
In terms of the number of dwellings constructed around, 170,000dwellings (or 2.2percent) were added to Australia’s total housing stock of 7.8million in the past year. Of those dwellings built, around 66percent were detached houses and 34percent were medium density dwellings (semi-detached, terrace houses, town houses, flats, units and apartments).
The housing industry is a major employer and has made a significant contribution to Australia’s employment growth over the past five years. Around 390,000 people are directly employed in residential construction, an 8percent increase on two years ago.2 A further 130,000 people were also employed indirectly as real estate agents, architects and other property professionals.
Overall, housing construction has in recent years contributed significantly to economic growth and incomes, with the current cycle now appearing relatively mature compared with past cycles.
Recent trends in house prices3
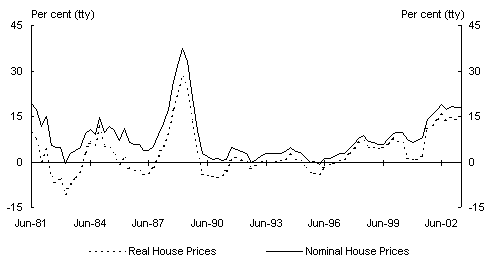
Over the past decade, established dwelling prices have increased by around 110percent in nominal terms. Much of this growth occurred in the second half of the decade, with prices growing by 76percent over the past five years (Chart 2).4 The median price of an established detached dwelling has risen from $148,000 in June 1993 to $358,000 in June2003.5 Similar increases have been recorded in the prices of medium density dwellings, which have risen from $115,000 to $278,000.
Despite considerable variation in house prices across states and territories (see Box 1 State Comparisons), there has been strong growth in prices generally across most of Australia. The significant rise in prices across states and territories reflects broad economic and demographic drivers of demand, with some of the variation in prices partly reflecting geography and location.
Chart 2: Established house prices
Source: ABS Cat. No. 6416.0 and REIA Housing Market Facts.
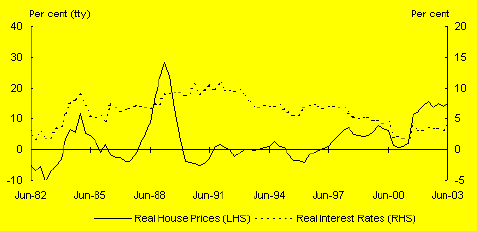
As seen in the above chart, large increases in house prices are not unprecedented in history and, in part, reflect the cyclical nature of the housing market. Australia’s established house prices increased by 56percent over the two years between June1987 and June1989. However, there were some notable differences between the rise in house prices then and the increases witnessed in recent years (Box2 The Tale of Two Housing Cycles).
Despite the general perception that house prices can only go up, Australia has actually experienced falls in house prices, especially in real terms. Between March1989 and December1990, real house prices fell by 8percent and did not recover to the same levels until a decade later. Some individual markets in Australian cities recorded greater falls in the early 1990s. Dwelling prices in Melbourne fell by 22percent in real terms between March1989 and March1996. This is similar to international experience. In the late 1980s and early 1990s, the United Kingdom, Finland, Norway, and Sweden experienced peak to trough falls in prices of greater than 25percent.6 Sharper falls have been observed in some South and East Asian economies over the 1990s, particularly in Hong Kong and Japan.
|
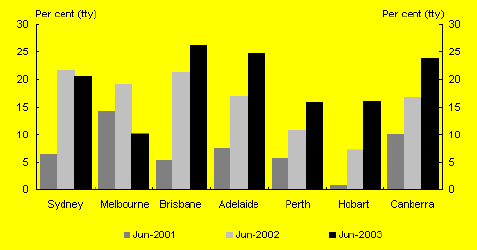
Box 1: State comparisons There is considerable variation in house prices and investor participation in the market across states and territories. Median house prices range from $180,000 in Hobart to $465,000 in Sydney, whilst the median price of a medium density dwelling ranges from $127,500 in Hobart to $364,600 in SydneyTableA (at June2003). Table A: Prices of houses and medium density dwellings by state (nominal) Source: REIA: Market Facts. While house price growth in Melbourne and Sydney slowed in 2003, prices in other state capitals increased (Chart A). Price growth in Brisbane increased from 21percent through the year to June 2002 to 26percent through the year to June2003. Notably, Melbourne is the only city to show a noticeable slowing in year on year price growth. Growth in prices in Melbourne slowed from 19percent in June 2002, to 10per cent in June 2003 (Source: ABS Cat. No. 6416.0). Chart A: House price growth Source: ABS Cat. No. 6416.0. |
|
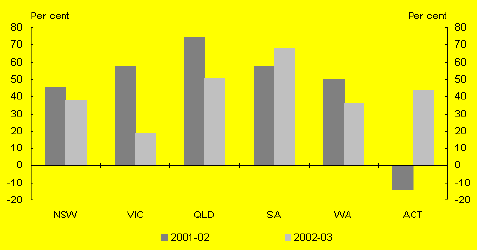
Box 1: State comparisons (continued) The states and territories recording the strongest growth in prices the past two years also recorded the strongest growth in investor finance: Queensland, South Australia and the ACT (Chart B). Chart B: Growth in investor finance by state Source: ABS unpublished data. |
Land prices
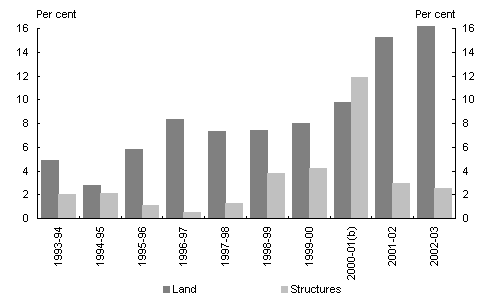
One of the major factors contributing to the increase in established house prices in recent years has been the notable increase in the price of the land component. The real price of land has risen by around 12percent per annum since 1992 (Chart 3), while the price of constructing a dwelling has increased by around 3percent per annum (2.0percent excluding the impact of The New Tax System), around the annual rate of inflation.7
Chart 3: Growth in land and house prices(a)
(a) The spike in growth in prices of structures in 2001 reflects the one-off impact of the GST on housing related materials and services. However, the increase in the purchase price was offset by the introduction of the First Home Owners Grant (for further information see the accompanying article First Home Buyers in Aus
tralia.)
(b) 2000/01 includes the impact of the new tax system.
Source: ABS Cat. No. 5204.0.
According to the Annual National Accounts, the price of an established dwelling has increased 65percent over the past decade, with land contributing 52percentage points to that increase and the cost of constructing a dwelling contributing only 13percentage points.8 That is, the land component has contributed around 80percent to the increase in the price of an established dwelling.
This would therefore suggest the demand for land, and hence the available supply or release of land, may be an important factor behind the recent rise in house prices. Higher costs associated with greenfield developments and urban infill may have also played a role. Determining this would require detailed investigation of housing and land supply, which is not the focus of this paper.
|
Box 2: The tale of two housing price cycles Australia experienced a sharp run-up in housing prices in the late 1980s following a seven-year period of relatively flat growth. In line with inflation, house prices grew at around 8percent per annum in nominal terms in the seven years prior to 1987, before increasing sharply by 56percent over the following two years to June 1989. The current boom differs to the experience of the 1980s. During the current cycle, steady growth in house prices has been recorded over the past seven years. As such, the 1980s cycle appears to have been a relatively short lived phenomenon compared with the prolonged growth in house prices since 1996 (see ChartA). Although some of the circumstances and economic events behind these two cycles are similar, there are notable differences. In particular, inflation in the late 1980s was considerably higher than today and as such the real increase in house prices in the 1980s was significantly less than the nominal price increases. Between June 1987 and June 1989, real house prices rose by 35percent, somewhat comparable to the 33percent rise in the two years to June 2003. However, the lead up to the 1980s episode saw real prices decline by 5.6percent between June 1985 and June 1987. This is significantly different from the strong sustained growth witnessed over the past seven years, which has contributed to one of the longest periods of continuous real house price growth on record. A common theme to both periods was a surge in investor activity following a collapse of share market values. In October 1987 the share market fell by over 40percent. In the following two years, the investor share of total housing finance rose sharply from 13percent to a peak of 34percent in January 1989. Looking at the current cycle, between June2001 and February 2003, the share market lost around 20percent in its value, one of the longest bear markets of recent times. Coinciding with the decline in share prices, investor activity as a share of total housing finance has also increased significantly, averaging around 45percent of total financing in the past year. Some policy factors may have also played a role in the 1980s boom. The 1985 tax reform package included a measure that was aimed at limiting the negative gearing of rental property investments made after 17July1985. Under this measure, the deduction allowable each year for interest on borrowings was limited to the net rental income derived in that year. These restrictions were removed on 15September 1987 just prior the stock market crash and the boom in housing investment. Prior to the significant rise in house prices in the late 1980s, there was a cyclical decline in interest rates, with the standard variable rate falling from 15.5per cent in July 1987 to 13.5 per cent by February 1988. The decline in interest rates was quickly |
|
Box 2: The tale of two housing cycles (continued) reversed, rising from 13.5per cent in June 1988 to 17.0percent by June 1989, and as such may have played a significant role in the abrupt decline in the growth in house prices (Chart A) — where house prices fell by over 8percent in real terms between 1989 and 1991. The structural decline in real interest rates over the past 5 years has been an important driver of house prices, as lower interest rates enabled households to service higher debt levels. As such, an increase in interest rates would reduce the ability of households to service high debt levels (assuming no change to incomes) and possibly lead to a decline in demand for housing and the growth in house prices, as was the case in the 1980s. The extent of decline, in real or nominal terms, is however dependent on a multitude of variables as highlighted in this article. Chart A: Real house prices and interest rates Source: ABS Cat. 6416.0 and RBA Bulletin Data Base. Finally, another important economic variable affecting housing is the unemployment rate. In the lead up to the strong growth in house prices of the late 1980s, the unemployment rate was steadily declining. From its peak of 10.4percent in September 1983, the unemployment rate fell to 7.8percent by June 1987 and continued to fall to a trough of 5.6 per cent by December 1989. As a result, more households were in a better financial position to invest in housing in the late 1980s. However, coinciding with a sharp reversal in house prices, the unemployment rate then nearly doubled from 5.6percent in December 1989 to 10.9percent in December 1992. Since 1994, the unemployment rate has fallen steadily from this peak of 10.9percent. In fact, the unemployment rate over the past two years has fallen by over 1percentage point to below 6percent — its lowest level in over a decade. This decline in the unemployment rate coincides with the long expansion in house prices. |
Housing demand
As highlighted so far, the supply of new housing has been rising strongly over the past two years, a period that has coincided with exceptional growth in house prices, indicating that housing demand continued to outpace supply. Housing demand can be attributed to many economic and demographic factors, although the importance of these factors depends on the reasons for purchasing a home. In essence, there are three reasons why people purchase homes; that is, they are either upgraders, first home buyers or investors.
Upgraders
Upgraders — classified as those households that already own or are paying off a house or apartment and are looking to upgrade the quality or location of their home account for around 44percent of total housing loans. Upgrading might be driven by factors such as household size (for example, having children), changes in employment, income, or economic circumstances (for example, wealth gains).
It is important to note that housing demand originating from upgrades will have a corresponding response in housing supply, as those upgrading to higher quality homes are by definition selling their current property (usually only with a short lag). Nevertheless, the activity of upgraders will have an important influence on housing demand and house prices. For simplicity, downgraders, those looking for cheaper or smaller accommodation (for example, retirees) are also included in this category.
First home buyers
First home buyers typically originate from either changes in household formation (children leaving home, divorce etc.), from immigration or from those leaving the rental market. Unlike upgraders, first home buyers create additional demand for dwellings without a corresponding property sale. First home buyers currently account for around 10percent of total loans for housing, although their share reached a peak of 20percent follow
ing the introduction of the First Home Owners Grant in July 2000. While the proportion of first home buyer activity relative to the rest of the market has fallen from record high levels in recent years, this reflects a significant increase in turnover and refinancing in the total housing market. The current actual level of first home buyers (8000 in September 2003) is only slightly below the long-run average level of around 8900 loans per month.
Investors
The final category contributing to housing demand is investors who are those households or corporations that own dwellings for the purposes other than owner occupation. Investors purchase properties for either an income stream (rents) and/or expected capital gains, and as such their demand is notably influenced by interest rates or the performance of other asset classes. This is unlike first home buyers who are primarily driven by demographic or social factors (although some factors will undoubtedly overlap).
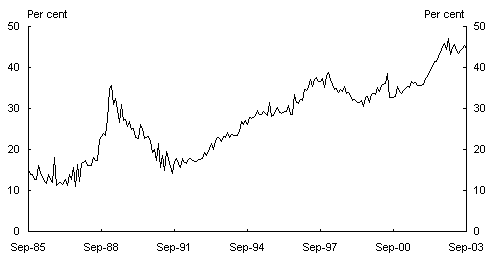
Investors have grown in importance in the housing market over the past 20years. Investors’ share of total housing finance increased from around 20per cent in the 1980s to average 37percent over the past five years (Chart4). Growth in investors’ role in the market has been particularly strong over the past two years, increasing from 35percent in 2000-01 to 45percent in the three months to September 2003.
Given investors’ large and growing share of the Australian housing market the second part of this article focuses on investors and the key drivers of investor activity. (First home buyer activity is discussed in the accompanying article First Home Buyers in Australia.)
Investors contribute strongly to housing demand
As stated earlier, investors currently account for a significant proportion of total housing finance. Investors are either households, or companies, trusts and corporations.
Chart 4: Investor loan approvals
as a proportion of total housing finance(a)
(a) Excludes refinancing of existing homes and alterations and additions.
Source: ABS Cat. No. 5671.0
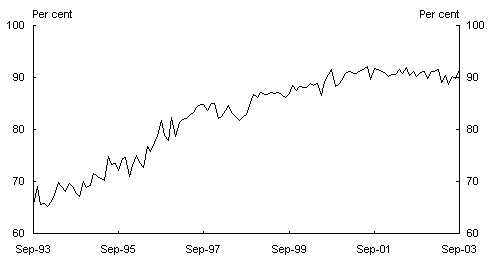
An important development over the past decade has been the growing importance of households, rather than corporations, as investors. At the beginning of the 1990s, households accounted for around 65percent of lending for the purchase of established dwellings for investment. This has grown to around 90percent in 2002-03 (Chart 5).
Chart 5: Individual investors
as a proportion of total investors(a)
(a) Excludes construction of dwellings for rent or resale.
Source: Treasury derived from ABS Cat. No. 5671.0.
However, that is not to say corporations are moving away from housing as an investment class. Over the past two years, the value of investment by corporations in residential property has nearly doubled.
Despite the popular perception that investors are typically only interested in medium density dwellings, investors own 50percent detached houses and 50percent medium density dwellings. However, of the total number of medium density dwellings constructed each year, investors on average are estimated to approximately account for 70 per cent.
Fundamental drivers of investor demand
Investor demand for housing is largely driven by the current economic circumstances of individuals and a series of other economic factors relating to them, such as interest rates, incomes (rent and personal) and the performance of equity markets.
Before examining some of the economic factors which are important drivers of investor demand, it is worth first reflecting on the key driver of the housing market as a whole ie. population growth. Population growth and household formation will directly or indirectly influence investors’ decisions, be it through higher demand for rental properties or the future sale of the property.
Population
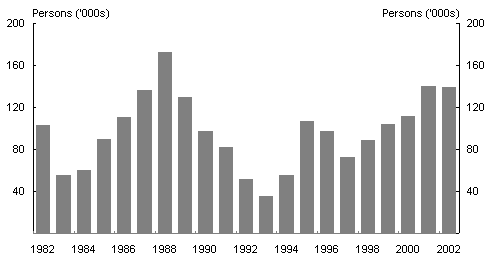
Population growth is the key driver of demand for housing. In Australia, the total estimated resident population has increased, on average, by 240,000persons perannum over the past five years. The housing requirements of this ongoing increase in population must be met through the construction of new dwellings.
Australia’s natural population increase, that is the number of births over deaths, has averaged 120,000 persons per annum over the past five years. This has been broadly matched by net migration, which has averaged around 117,000 people per annum over the past five years, with the intake increasing over this period (Chart6).9 Migrant households typically rent in the first few years in Australia and new migrant households have a direct impact on demand for rental properties.
Chart 6: Net overseas migration
Source ABS Cat. No. 3101.01.
Long-run social and demographic changes are also increasing demand for dwellings. Between 1991 and 2001, Australia’s population increased by 12percent while the number of private occupied dwellings increased by 21percent. The average size of a household decreased from around 2.8 persons to around 2.6 persons over this period. There are a number of factors contributing to smaller households including, declining marriage rates, an increasing number of divorces and fewer group houses. Between 1991 and 2001 there was a 43percent increase in the number of lone person households and a 37percent increase in the number of lone-parent households leading to an increase in demand for houses.10 In general, the smaller the size of an average household, for a given level of population, the greater is the number of dwellings required to house them.
Income
Rental income is one of the key long run determinants of investor demand for housing. Rental income allows investors to service higher levels of debt, and provides a large proportion of those investors with a strong second income. That said, it is not necessary that investors enter the housing market solely for an income stream. As is the case with many types of shares, an investor may trade off high income (yield) against capital growth, depending on the particular financial situation of the investor. Cash flow analysis that ignores the capital growth component of an investment can therefore be misleading.
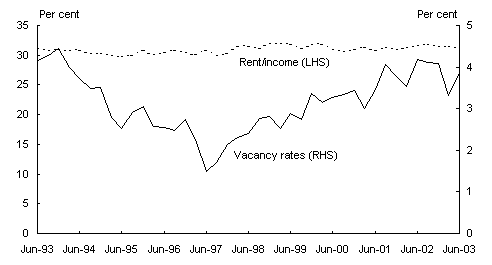
Rents over the past seven years have increased in-line with incomes rather than house prices. This may reflect the rise in vacancy rates over the past six years, thereby limiting the ability of landlords to increase rents (Chart 7). However, the budget constraint of households are likely to be a constraining determinant on rent, and this combined with the lags in the rental market and price stickiness of rents, suggests that rents are likely to adjust slowly to vacancy rates or may not adjust at all to temporary movements.
Chart 7: Detached house rent as a proportion of
income and vacancy rates
Source: REIA Market Facts and ABS 6302.0
The ability of investors to service their housing investment debt de
pends also on their personal income levels. Personal incomes have risen strongly in recent years (up 34percent over the past five years) principally due to strong employment growth. Employment has grown at an annual average rate of around 2percent since 1997-98 and the unemployment rate has fallen to below 6percent (October2003). The sustained improvement in the unemployment rate has contributed to the higher confidence and willingness of investors to hold higher levels of debt, as they feel more secure about their financial future and more able to withstand any temporary shock to their rental income stream.
The relative strength of the property market appears to be particularly important to Australia’s aging population. People without substantial superannuation, or those wishing to top up their savings for retirement, appear to have been attracted by the strong capital gains available from investment in property.
Low interest rates
Interest rates play an important role in investor demand for housing by influencing the cost of capital. The standard variable mortgage interest rate has fallen from a high of 17.0percent in the late 1980s to average around 6.8percent over the past five years.
Financial deregulation of the 1980s has increased competition between lenders and reduced lending margins of financial intermediaries leading to further reductions of interest rates faced by borrowers. Of the 8percentage point reduction in the average mortgage rate between the late 1980s and the past five years, about 2percentage points can be attributed to the lower lending margins.11
As mortgage interest rates halved, households’ ability to service their borrowing nearly doubled. However, since mortgages are held for a considerable period of time (up to 30years in some cases), borrowers need to consider a longer time horizon with respect to interest rates. Although expectations about the level of interest rates have been considerably lowered — through the effective control of inflation and the impact of financial deregulation over the past decade — investors need to consider that mortgage interest rates are currently at very low levels by historical standards and as such may not stay at these low levels over the life of the investment.
Alternative investments
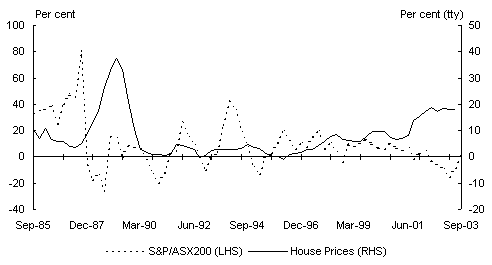
The poor performance of the stock market in recent years also provided an impetus to invest in housing. Low yields, high volatility, and capital losses in recent years appear to have made the stock market a less attractive option in which to invest for average households. Over 2002-03 the ASX200 fell significantly (19per cent between January2002 and February2003) (Chart8). The perceived higher risk of investing in the stock market, be it capital losses or price movements volatility, also means households may have become less willing to borrow to invest in the stock market. Dwelling investment is typically perceived as a safe haven investment (bricks and mortar) and recent strong capital gains have reinforced this perception.
When choosing between alternatives, investors are influenced by comparisons of the overall after-tax rate of return. In this context, taxes from all levels of government, as well as income and asset tests through the social security system, can influence the choice of investments. For instance, Australia has a long tradition of providing concessionary taxation treatment to owner-occupied housing.
Key taxation factors that can influence the choice of investments include the overall personal income tax scales (including tax thresholds and marginal tax rates), the timing of assessing income and deductions, the treatment of inflation, the capital gains tax, the general tax principle that allows losses from one area of income to be offset against other forms of income (including negative gearing on borrowings) and depreciation arrangements. Many of these longstanding taxation treatments apply equally between investment options, such as that between an individual investor in housing or the stock market, and it is therefore difficult to state that they have favoured any particular asset class or that it has contributed to any excessive activity in any particular market.
Chart 8: Share market and house prices
Source: RBA Bulletin.
Financial deregulation
In addition to lowering interest rates as a result of greater competition over the past decade, financial deregulation of the 1980s has led to greater availability of finance for investment in houses.
Within this new regulatory framework12, lenders became more willing to provide finance for housing investment over the course of the 1990s. Prior to 1996, banks put more onerous conditions on investors than owner occupiers, charging around 1percentage point above the usual lending interest rate.13 Specialist mortgage originators, lacking a customer base when they entered the market, competed aggressively with established lenders — a number charging the same interest rates for investors as they did for owner occupiers.14 Established lenders followed suit and the interest rate surcharge for investors was reduced.
The development of the mortgage broker business further added to competition by making it easier for borrowers to compare prices and products and increased demand for investment in housing generally through advertising campaigns.15 Increased competition has lead to the development of lending products with investors in mind including: home equity loans, split purpose loans, deposit bonds, zero deposit loans and redraw facilities.
Conclusion
There are many participants in the housing market — first home buyers, investors and those upgrading their home. All play an important role in the housing market and have contributed to the current housing boom. However, investors have come to play an increasingly significant role over the past decade.
Investor demand has been driven by a variety of factors in recent years and it is unlikely that any one of these factors alone can explain the strength in investor demand.
1 Domestic Economy Division, Australian Treasury. I would like to thank Damien Dunn for detailed comments and Michael Harvey and Dan Smith for valuable assistance. The views in this article are those of the author and are not necessarily those of the Australian Treasury.
2 Australia’s total employment grew by around 3.8percent over the same period. Excluding construction it grew by 3.0 per cent. Source: ABS Cat. No. 6291.0.55 electronic publication and unpublished industry data.
3 Per cent changes in dwelling prices are calculated from ABS House Prices Indexes (ABS Cat. No. 6416.0). Data on median house prices are taken from the Real Estate Institute of Australia (REIA) publication; Market Facts.
4 A number of problems exist when measuring price changes for established dwellings. First, the physical characteristics of dwellings such as the number and size of rooms, the quality of materials and fittings and the age of dwellings are likely to differ. Similarly, the quality and size of homes tends to increase over time. Second, the geographical location of dwellings has a significant influence on prices. This may reflect a combination of local amenities such as views, transport or proximity of work places and access to services such as scho
ols. Lastly, some quarterly estimates of dwelling prices only reflect the value of dwellings sold in each quarter. The result is that the average price of dwellings sold in each quarter is affected by these compositional issues and a rise or fall in prices may relate to changing composition of houses and not to actual house price inflation.
5 REIA Market Facts.
6 According to the Bank of International Settlements, peak to trough falls in real prices recorded in the late 1980s and early 1990’s include: Finland 50 per cent, Norway, 48 per cent, Sweden 30 per cent, and United Kingdom 30 per cent.
7 This analysis is based on the Annual National Accounts (ABS Cat. No. 5204.0), which publishes estimates of the value of land and dwellings (excluding land) and the ABS House Price Indexes (ABS Cat. No. 6416.0), which publishes an index for both established dwellings (including land and building), and for a project homes (building excluding land).
8 Note that these quality adjusted price deflators items are not additive.
9 The ABS has advised that due to adjustments made to category jumping, immigration estimates may be overestimated. For further information please see Demography Working Paper 2003/1 — Estimated Resident Population and Measurement of Category Jumping.
10 ABS Australian Social Trends 2003 Housing — Housing Stock: Changes in Australia’s housing.
11 Reserve Bank Bulletin March 2003, Household debt, what the data show, p. 3.
12 The major parts of the current regulatory framework that touch on mortgage lending include: the States and Territories regulate credit and consumer lending through the Uniform Consumer Credit Code; the Australian Securities and Investments Commission has some limited powers in relation to the conduct of credit providers (for example, in relation to misleading and deceptive conduct); and the Australian Prudential Regulation Authority prudentially supervises banks, building societies and credit unions.
13 Reserve Bank Bulletin December 2002, Innovations in the provision of finance for investor housing, p. 2.
14 Ibid.
15 Ibid.
