The Australian economy grew strongly in 2003-04, following solid growth in 2002-03. Growth was driven by household consumption, reflecting high levels of consumer confidence and increases in household wealth and incomes. Farm production rebounded while business investment continued to grow solidly.
In contrast, Australia’s export volumes were weak, due in part to a record rise in the exchange rate and domestic supply constraints. Nevertheless, the world economic recovery saw demand for Australia’s commodity exports rise in 2003-04, with substantial increases in commodity prices. Underpinned by these price rises, the terms of trade rose to its highest level in around 30years, underwriting some of the strong corporate profitability seen in 2003-04.
Fuelled by strong domestic demand and low prices, imports grew strongly in 2003-04. As a result, net exports registered a larger than expected subtraction from GDP growth, with the current account deficit widening.
Employment continued to grow solidly with the unemployment rate falling below 6percent.
Despite the ongoing strength of the economy, wages growth was contained, while inflation remained comfortably within the 2 to 3percent target band in 2003-04.
Overview
The Australian economy grew strongly in 2003-04, growing by 3.6percent in year average terms. This outcome was above the 2003-04 Budget forecast but broadly in line with the Mid-Year Economic and Fiscal Outlook (MYEFO) forecast.
The world also grew strongly in 2003-04, with many of Australia’s major trading partners experiencing a resurgence. Global economic activity was driven by the United States and China, although Japan and the rest of East Asia also showed unexpected strength. The recovery in world activity was supported by highly expansionary monetary and fiscal policy settings in many parts of the world and an easing of some near-term downside risks. Nevertheless, large imbalances, in both current accounts and fiscal positions, persisted throughout 2003-04.
While the outcome for Australia’s GDP growth represents a solid economic performance over 2003-04 as a whole, the composition of growth differed from initial expectations.
Household consumption grew at a 30-year record rate in 2003-04, with rising petrol prices and two increases in interest rates helping to moderate growth in the first half of 2004. Dwelling investment also demonstrated unexpected resilience, with the anticipated decline in medium-density housing activity failing to materialise.
In contrast, exports, due in part to the sharp appreciation in the exchange rate and domestic supply constraints, were unable to capitalise on the recovery in the world economy. Coupled with a boost to imports from strong domestic demand, net exports subtracted a larger than expected 2.7percentagepoints from economic growth in 2003-04.
While unable to achieve the anticipated growth in export volumes, strong world demand saw prices for Australia’s commodities rise sharply in 2003-04, with the terms of trade rising to its highest level in almost 30 years. This provided a boost to national income, while also underpinning some of the strong corporate profitability seen in 2003-04. Despite the strong growth in the terms of trade, the current account deficit (CAD) widened to 5.8percent of GDP.
Outcomes for other sectors of the economy were broadly consistent with expectations. Farm production rebounded in 2003-04 following widespread rainfall through much of Australia’s grain belt over winter while private business investment moderated from the boom conditions experienced in the previous year.
Employment grew by 1.8percent in 2003-04 following very strong growth the year before. By June 2004 the unemployment rate had declined to 5.6percent from 6.2percent a year earlier. The average unemployment rate through 2003-04 was 5.8percent, the lowest since 1976-77.
Despite the unemployment rate falling throughout 2003-04, wages remained contained. Inflation was 2.4percent in 2003-04, in line with the 2to3percent medium-term inflation target band. The inflation outcome indicates a lack of systemic price pressures in the economy, although this result was also supported by falling import prices.
The world economy
The world economy grew by 3.9percent in 2003, after expanding by 3per cent in 2002 (Chart 1). This outcome exceeded both the 2003-04 Budget forecast of 3percent and the MYEFO forecast of 3percent.
Chart 1: World growth(a)
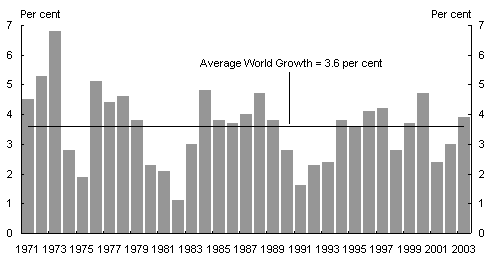
(a) World GDP growth rates are calculated using GDP weights based on purchasing power parity.
Source: International Monetary Fund.
At the time of the 2003-04 Budget global economic growth was expected to be subdued, with the world economy struggling to gain traction in a highly uncertain environment. Instead, the world experienced a strong economic recovery.
The rapid growth experienced in the September and December quarters of 2003 was driven by very supportive monetary and fiscal policy settings in large parts of the world. The United States and China were the main engines of the global recovery, but the recoveries in Japan and the rest of East Asia were also stronger than expected.
The pace of growth eased slightly in the second half of 2003-04 as the persistence of high oil prices and an easing of growth in the United States and Japan dampened global activity. The impact of high oil prices is explored in Box 1. While growth has eased slightly, global economic activity has broadened. The softening of growth in the Junequarter 2004 suggests that the peak of the upturn may have been reached and that GDP growth has started to ease towards more sustainable levels.
In the United States, GDP grew by 4.4percent in 2003-04, underpinned by private consumption and, increasingly, business investment. United States employment growth was subdued at the start of 2003-04, rising by an average of just 29,000permonth between June and December 2003 before picking up to a more healthy pace, growing at an average of 204,000 per month between January and June 2004. While monetary and fiscal policies in the United States remained expansionary over the course of 2003-04, the degree of monetary policy stimulus was reduced on 30June when interest rates were raised by of a percentage point.
One of the key risks identified in the 2003-04 Budget was the existence of large global imbalances. The imbalances in the economy, represented by the large fiscal and current account deficits, persisted throughout the year, with the United States CAD rising to a record high of 5.6percent of GDP in the June quarter of 2004.
The Japanese economic recovery was unexpectedly strong, with growth of 3.7percent in 2003-04, the highest rate of growth since 1990-91. Growth was underpinned by strong exports growth and a rebound in business investment, and more surprisingly consumption. Japanese exports to China were especially strong over 2003-04, growing by 27percent over the period.
China’s GDP grew by 9.7percent in 2003-04. Strong investment growth of 23percent in 2003 was the main component of GDP growth. Signs of overheating in a number of sectors prompted the government to impose tighter controls on credit in late 2003. By the end of 2003-04 there were signs that these measures were having some success in dampening credit and investment growth, with both easing in the June quarter 2004. Still, there remains uncertainty about the extent of the slowing.
|
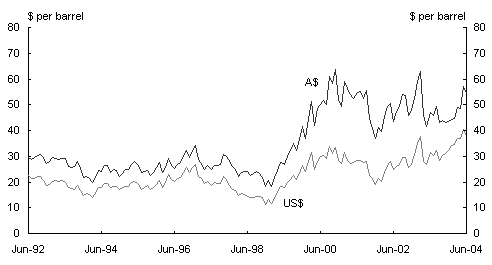
Box 1: Oil prices In 2003-04, the price of West Texas Int Chart A: United States and Australian dollar oil prices
Source: Datastream. During 2003-04, oil prices continued on the upward path that commenced in 2002, reaching a 21 year high of over US$41 per barrel in June 2004 before falling moderately towards the end of the financial year. Higher oil prices were driven by strong global demand as well as tight oil supply conditions and concerns over possible supply disruptions. Increased participation of speculators in the oil market also contributed to higher prices.
|
The rest of East Asia2 grew by 6.5percent in 2003-04. The up-tick in world demand assisted East Asia’s large export sector. As East Asia’s recovery progressed, domestic demand started to make a larger contribution to growth. The exception was Korea where the economy remained almost entirely reliant on external demand with the fallout from the end of the household credit boom suppressing consumption growth.
Euro area GDP grew by 1.1percent in 2003-04. Exports growth was the key component of euro area GDP growth, despite a 23percent appreciation of the euro against the US dollar since June 2002 (11 percent on a trade weighted index basis). High oil prices and high unemployment kept consumer confidence weak and constrained a stronger contribution from consumption. Monetary policy remained accommodative over the year with official interest rates held at 2percent since June2003.
The United Kingdom economy outperformed that of the euro area with United Kingdom GDP growing by 3percent in 2003-04. United Kingdom GDP growth was more balanced than in the euro area with both domestic demand and net exports contributing to growth. The continued strong growth and rising inflationary pressures prompted the Bank of England to raise interest rates by 100 basis points over the year, to 4.5percent by June 2004.
Domestic economy
Table 1 compares the actual outcomes for the domestic economy in 2003-04 with both the 2003-04 Budget and the MYEFO forecasts.
At the time of the 2003-04 Budget, the Australian economy was showing resilience and continuing to grow solidly in the face of a sluggish world economy and the negative influence of the drought. The 2003-04 Budget forecasts were prepared on the basis of a rebound in farm production from a return to average seasonal conditions and a gradual improvement in world growth. These were expected to more than offset a moderation in domestic demand.
Slower wealth accumulation, driven by more temperate increases in house prices and subdued equity prices, was expected to contribute to an easing in household consumption growth in 2003-04 with a concomitant slowing in import growth. Underpinned by the improving world economy and a rebound in rural exports, export growth was expected to pick up over 2003-04.
Table 1: 2003-04 Budget and MYEFO forecasts and outcomes(a)
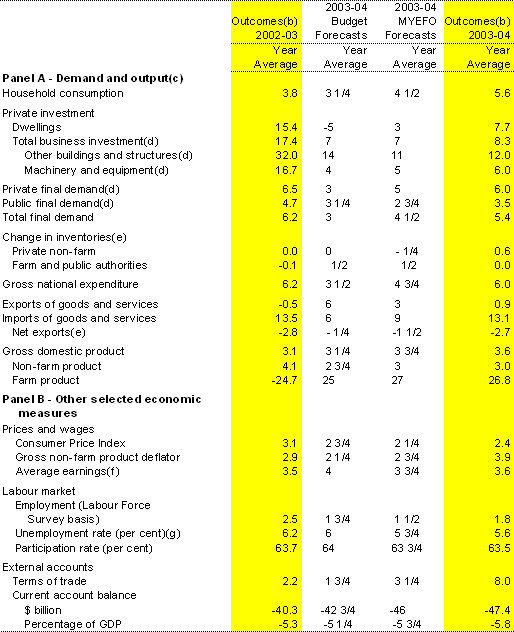
(a) Calculated using original data, except average earnings and the labour market measures which are calculated using seasonally adjusted data.
(b) Percentage change on preceding year unless otherwise indicated.
(c) Chain volume measure.
(d) Excluding transfers of second-hand asset sales from the public sector to the private sector.
(e) Percentage point contribution to growth in GDP.
(f) Average non-farm compensation of employees (national accounts basis).
(g) The rate in the June quarter of each year.
A significant improvement in the global economic outlook, buoyant consumer activity and a persistent rise in dwelling investment saw the economic growth forecast revised up at MYEFO. However, the sharp appreciation of the exchange rate prompted a downward revision in forecast export growth which, when combined with more robust import growth in response to rising consumer demand, saw a forecast deterioration in Australia’s net export position.
As it turned out, aggregate GDP growth in 2003-04 was broadly consistent with the MYEFO forecast (Chart 2). Farm production was very close to expectations, as was business investment. Net exports subtracted more from growth than forecast with slower than anticipated growth in exports and strong domestic demand, particularly in household consumption, driving imports.
Chart 2: Contributions to GDP growth in 2003-04
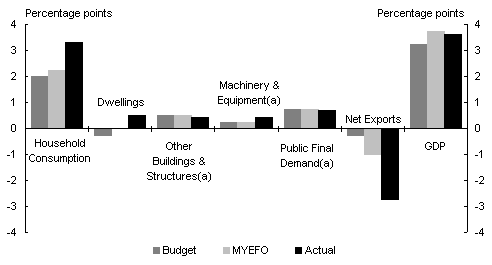
(a) Excluding transfers of second-hand asset sales from the public sector to the private sector.
Source: ABS Cat. No. 5206.0.
Domestic demand
Household consumption
Once again, household consumption was a key driver of economic growth, rising by 5.6percent in 2003-04, a 30-year record. This was substantially above both the Budget forecast of 3percent and the MYEFO forecast of 4percent.
At the time of the 2003-04 Budget, there was an expectation that the elevated levels of spending and household debt could not be sustained, with households expected to consolidate their balance sheets and increase saving. The increased financial exposure of households also raised the concern that a deterioration in labour market conditions or a sharp correction in the housing market could cause consumption to slow significantly.
While house prices eased in the first half of 2004, this was not the sharp correction feared by many, with households apparently deferring consolidation of their balance sheets. In addition, employment growth was slightly stronger than forecast. Combined with a recovery in the stock market from its 2002 slump, household incomes and wealth were higher than anticipated. These gains offset rising petrol prices and a 50 basis point increase in interest rates in late 2003 to have consumption grow much more strongly than expected.
Household consumption was also boosted by the appreciation of the exchange rate, with the price of many consumption items being lower than expected. This allowed
more goods and services to be purchased for the same income.
The strongest consumption category was recreation and culture as Australians took advantage of favourable exchange rates to travel overseas, realising several years of pent-up demand in this sector. Reflecting buoyant consumer confidence, consumption growth was also strong across a number of other consumption categories, most notably household furnishings and equipment, purchases of vehicles, and hotels, cafes and restaurants.
Consumption spending continued to grow faster than disposable income throughout 2003-04, with the household saving ratio remaining negative.
Dwelling investment
In contrast to the contraction forecast at Budget, dwelling investment continued to grow strongly in 2003-04, rising by 7.7percent. Dwelling investment contributed around 0.5 percentage points to GDP growth.
At Budget there were widely held concerns about the high levels of investor participation in the dwelling sector, whose involvement was potentially driving inflated prices. Oversupply was also a significant concern, particularly in the multi-unit sector. Combined with easing expectations of capital gains, demand for dwellings was expected to turn sharply.
However, the market appears to have behaved somewhat differently compared with previous peaks. Although dwelling investment grew strongly in 2003-04, house prices appear to have moderated, consistent with a slow correction in the market (Chart 3). In addition, sales growth appears to have softened. This slowdown is likely to have been assisted by the interest rate increases in late 2003.
Chart 3: Quarterly growth in established house prices
Source: ABS Cat. No. 6416.0.
Despite slowing in 2004, growth in alterations and additions also remained strong, outstripping the pace of activity in the new dwellings sector.
Business investment
After experiencing a boom in engineering construction in 2002-03, growth in private new business investment moderated to 8.3percent in 2003-04, down from its rapid 17.4percent expansion the year before. This was broadly in line with the 2003-04 Budget and MYEFO forecasts. Unlike some other sectors of the economy, the forecasts for private new business investment were not heavily influenced by the rapid appreciation in the exchange rate, reflecting that investment plans are often ‘locked in’ before actual purchases occur and the existence of favourable economic conditions, including low domestic interest rates, increasing corporate profitability and a strong world economy.
New investment in other buildings and structures increased by 12 per cent in 2003-04, following very strong growth the previous year. Growth was strong in both the non-residential building and engineering construction components, the latter underpinned by investment in large mining and infrastructure projects stimulated by the strong demand and rising prices for Australia’s commodity exports.
Investment in new machinery and equipment increased by 6 per cent in 2003-04, following strong growth the year before. The increase in machinery and equipment investment was led by the mining sector, while investment in civil aircraft slowed following two years of exceptionally high growth.
Public final demand
In 2003-04, public final demand grew by 3.5percent, broadly in line with the Budget forecast but above the forecast presented at MYEFO. Both government consumption and investment growth were aboverecent average rates. Consumptionwas driven by strong public sector employment growth in 2003-04, while investment by public trading enterprises continued to rebound from the lower levels experienced between 1999 and 2001.
Public final demand grew for Commonwealth and state and local governments, although growth in state and local government spending was marginally below recent average rates.
External sector
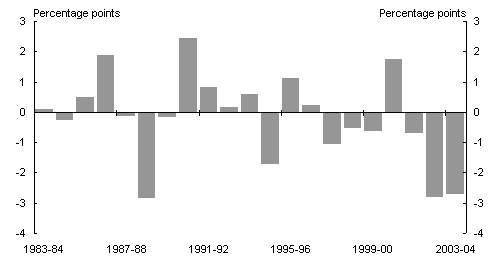
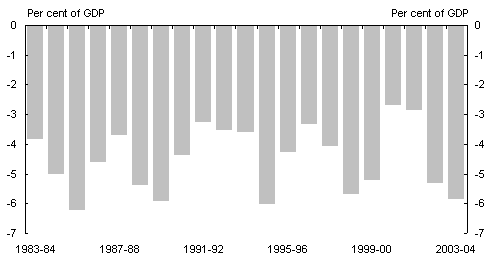
Despite the strong world economic recovery, net exports subtracted 2.7 percentage points from GDP growth in 2003-04, a much greater subtraction than expected at the 2003-04 Budget and MYEFO. Australia has now experienced two consecutive years of large net export subtractions from GDP growth (Chart 4).
Chart 4: Net exports contribution to GDP growth
(year average)
Source: ABS Cat. No. 6416.0.
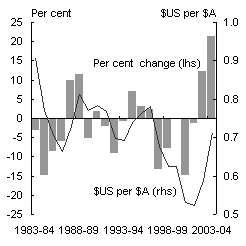
The drivers of these net export subtractions have been quite different. In 2002-03 the severe drought, a tepid world economy, geopolitical uncertainties, Severe Acute Respiratory Syndrome (SARS) and a business investment boom combined to subtract 2.8percentage points from GDP growth. In contrast, the 2003-04 subtraction was, at least partly, driven by domestic supply constraints and the sharp appreciation of the Australian dollar, which rose by a record 22percent against the US dollar and 15percent against the Trade Weighted Index in 2003-04, in year average terms (Chart5).
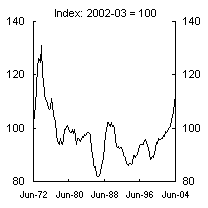
Chart 5: The Trade Weighted Index and US dollar exchange
rates — levels and percentage change
(year average)
|
|
|
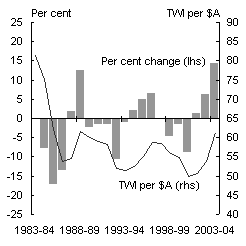
Source: RBA Bulletin.
Export volumes of goods and services grew by a modest 0.9percent in 2003-04. This outcome was well below the expected 6percent increase in exports forecast in the 2003-04 Budget and the 3percent increase forecast at MYEFO.
Non-rural commodity exports declined in 2003-04, largely due to temporary plant shut-downs in the second half of the fiscal year, coal supply-chain constraints around Newcastle and the trend decline in oil field production. Exports of elaborately transformed manufactures grew by a modest 1percent in 2003-04, as the benefits of stronger world growth were offset by the higher exchange rate and more competitive world markets.
Rural production recovered in line with expectations; however, rural exports growth was slower to rebound.
Services exports increased by 2.3percent in 2003-04, with tourism buoyed by Australia’s hosting of the Rugby World Cup. However, the potential rebound in tourism flowing from the pick-up in world growth and the waning of adverse shocks, such as the outbreak of SARS and the war in Iraq, was undermined by the appreciation in the Australian dollar.
Import volumes grew strongly in 2003-04, registering a substantial 13.1percent year-average increase. This was greater than the 6 per cent 2003-04 Budget and 9percent MYEFO forecasts. The strong growth in imports stemmed largely from stronger than expected domestic demand. The aviation industry's upgrading of its fleet of civil aircraft also contributed to this outcome, although the contribu
tion was smaller than in previous years.
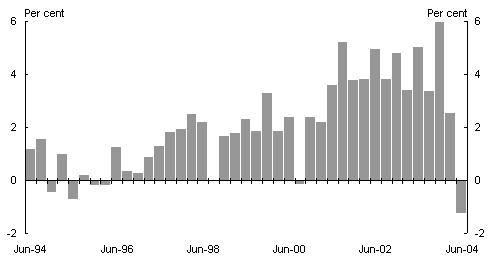
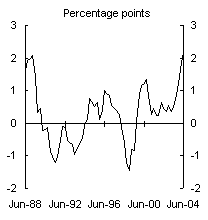
While unable to achieve the anticipated growth in export volumes, strong world demand saw prices for Australia’s commodities rise sharply. This underpinned a 8.0percent rise in the terms of trade in 2003-04, raising the terms of trade to its highest level in almost 30 years (Box 2).
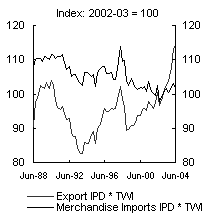
Export prices fell by 4.5percent in 2003-04, as the appreciation of the exchange rate more than offset strong rises in world commodity prices. In addition, import prices fell by 11.4percent, largely driven by the rise in the Australian dollar and the trend decline in Information and Communication Technology (ICT) import prices.
The CAD widened from 5.3percent of GDP in 2002-03 to 5.8percent of GDP in 2003-04 (Chart 6), with the increase in the terms of trade more than offset by the deterioration in net export volumes. This was larger than the CAD forecast prepared at Budget but broadly in line with the MYEFO forecast. Relatively low world interest rates helped hold the Net Income Deficit steady at 2.9percent of GDP.
Chart 6: Australia’s current account balance as a share of GDP
(year average)
Source: ABS Cat. No. 5302.0 and 5206.0.
|
Box 2: The terms of trade in 2003-04 In 2003-04, Australia’s terms of trade reached levels unseen since the mid-1970s commodities boom (ChartA). Chart A: Terms of trade
This outcome was the result of several key developments, in particular the sharp increase in commodity prices and the trend decline in manufactured goods prices (ChartB). Chart B: Foreign currency prices of exports and imports
Strong world demand drove up commodity prices in 2003-04. Through the year to June 2004 coal prices increased by 18percent, iron ore |
prices by 26percent and oil prices by 19percent, in SDR terms. Global manufacturing prices have been trending downwards over recent years, partly due to the increased production of manufactured goods by low-cost economies such as China. Notably, the fall in the global prices of ICT goods has contributed, on average, around 1.0percentage point to growth in the terms of trade over the past five years. The appreciation of the exchange rate in 2003-04 was also a major factor, as it was largely responsible for around a 15percent rise in the services terms of trade. The rise in the terms of trade has had a substantial impact on the Australian economy, which is receiving more income for the same volume of exports, and paying less for the same volume of imports, thereby improving national income and domestic living standards. Considered in isolation from other effects, the rise in the terms of trade contributed over 2percentage points to growth in national income through the year to June 2004 (ChartC). Chart C: Contribution of the terms of trade to national income(a)
(a) Real Gross Domestic Income. |
Labour market
Employment continued its solid and steady expansion. Employment grew by 1.8percent, or 165,000 persons, in 2003-04, following growth of 2.5percent in 2002-03. This result was consistent with the 2003-04 Budget forecast of 1percent but above the MYEFO forecast of 1 percent.
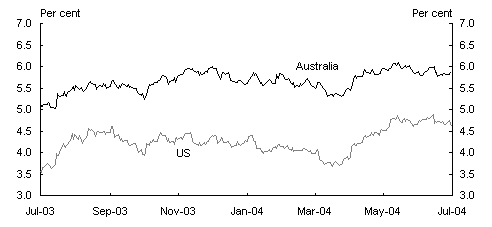
The unemployment rate declined from an average of 6.2percent in 2002-03 to an average of 5.8percent in 2003-04, the lowest average rate since 1976-77. By the June quarter 2004, the unemployment rate had reached 5.6percent, below both the 2003-04 Budget and MYEFO forecasts.
Of the major employing industries, construction, education and property and business services showed strong year average employment growth, whereas retail trade, wholesale trade and manufacturing employment declined.
Despite the rebound in farm production, rural and regional employment did not experience the sharp pick-up anticipated at MYEFO, due in part to the rebound being concentrated in capital-intensive cereal crops.
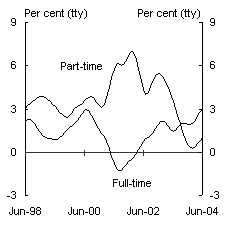
In 2003-04 the recent trend to part-time work was somewhat reversed, with full-time employment growth higher than part-time employment growth. The growth in full-time employment suggests that labour demand is being met, at least partially, by part-time workers shifting to full time employment (Box 3).
Wages and prices
Wages growth in 2003-04 was solid but remained well contained. The Wage Cost Index increased by 3.6percent in 2003-04, the highest result in the six-year history of the series, although only a slight increase on that recorded in 2002-03. The National Accounts measure of wages — average non-farm compensation of employees (AENA)— increased by 3.6percent, below the 4percent increase forecast at Budget but broadly in line with the 3percent MYEFO forecast.
Taken together, these results suggest a moderate increase in wage inflation in 2003-04, broadly in line with that forecast at MYEFO.
At the industry level, wages growth was particularly strong in the construction and government administration and defence industries. In contrast, wages growth was subdued in the hospitality and wholesale trade industries. Most notable were the wage increases in the public sector, with the Wage Cost Index increasing by 4.5percent in the public sector in 2003-04 compared with 3.4percent in the private sector (Chart 7).
|
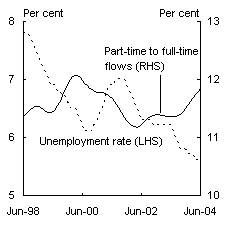
Box 3: Behaviour of the labour market The labour market has enjoyed a sustained period of strong growth in recent years. Despite the unemployment rate falling, and remaining, below 6percent, there is little evidence of emerging wage pressures. One possible explanation for this favourable employment and wage outcome is the more flexible labour market environment operating in Australia, with the majority of workers now employed under agreements negotiated at the level of the individual or the firm. A manifestation of this has been the way employment — in response to changes in labour demand — has shifted between traditional full-time employment and more flexible working arrangements, such as part-time employment. Chart A shows that part-time employment grew strongly over 2001 and 2002, significantly increasing the pool of part-time workers in the labour force. Survey data suggests that around a quarter of these part-time workers are willing to work more hours, including moving to full-time employment. As a result, aggregate measures of unemployment may underestimate the capacity of the labour force to meet increased labour demand. Over the past year, tighter labour market con |
Chart A: Full-time and part-time employment growth
Indeed, the flow of workers from part-time to full-time employment (as a share of total part-time employment) is currently at a near-record high, drawing on the large pool of available part-time workers as the unemployment rate declines (Chart B). Chart B: Flow of part-time to full-time employment
|
The public sector wage outcome largely reflected an increase in the NSW Crown employees award which covers a substantial part of the NSW public sector.
Chart 7: Year-average growth in the Wage Cost Index
private, public and total
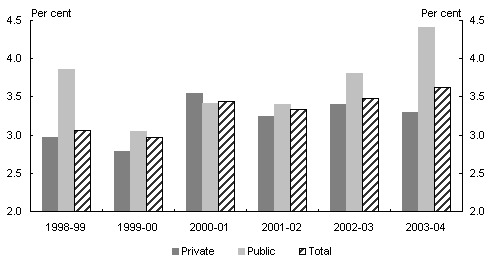
Source: ABS Cat. No. 6345.0.
The headline CPI increased by 2.4percent in 2003-04, compared with the forecasts of 2percent at Budget and 2 at MYEFO.
Increases in housing and fuel prices were the major contributors to inflation in 2003-04, reflecting ongoing rises in labour and materials costs and the impact of world oil prices. Food prices were also a significant contributor, the result of continued dry conditions and the impact of some localised severe weather events. In contrast, recreation subtracted from inflation, primarily driven by price declines for audio, visual and computing products, as well as overseas travel and accommodation.
Consistent with the appreciation in the exchange rate, tradables prices increased by only 0.2per cent in 2003-04, while non-tradables prices increased by 4.3percent.
Fiscal policy
During 2003-04, the Government continued to meet its objective of budget balance, on average, over the course of the economic cycle. The Australian general government sector recorded an underlying cash surplus in 2003-04 of $8.0billion (1.0per cent of GDP). The fiscal surplus in 2003-04 was $5.6billion (0.7 per cent of GDP). Australian general government net debt was reduced from 3.9percent of GDP in 2002-03 to 2.9per cent of GDP in 2003-04.
Monetary policy
In late 2003 the Reserve Bank of Australia (RBA) increased official interest rates on two occasions, by a total of 50 basis points, to 5.25 per cent. The move to a less accommodative monetary policy setting was made in the light of a stronger global economy and a strengthening in domestic demand. A further consideration was the risk to the economy posed by the build-up in household debt and the associated increases in house prices.
In July 2003 the Statement on the Conduct of Monetary Policy between the Treasurer and RBA Governor was reaffirmed and updated. The statement maintains the commitment by the RBA Board to hold consumer price inflation to between 2 and 3 per cent, on average, over the course of the economic cycle.
Bond market
Australian and United States 10 year bond yields moved broadly in line with each other over the course of 2003-04. Australian yields rose from around 5.0 per cent at the start of the period to around 5.9 per cent at the end of the period. United States yields rose from around 3.5per cent at the start of the period to 4.6 per cent at the end of the period (Chart8).
The spread between Australian and United States 10 year bond yields averaged around 140 basis points over 2003-04, ranging from around 100 to 180 basis points. Spreads at the lower end of this range occurred in July and August 2003 and then again from May 2004 after two episodes where bond yields rose more quickly in the United States than Australia.
Chart 8: 10 year bond yields in Australia and the United States
2003-04
Source: Reuters.
Equity prices
Australian equity prices, as measured by the ASX 200 index, rose by around 17percent over 2003-04. Major stock indices around the world also rose (Chart 9). In the US, the S&P500 index increased by around 17per cent, while Japan’s Nikkei index rose about 31per cent. In Europe, the Euro STOXX broad euro zone index added around 19per cent, while the FTSE index of United Kingdom stocks rose about 11percent.
Chart 9: Equity prices — movements in major indices
2003-04
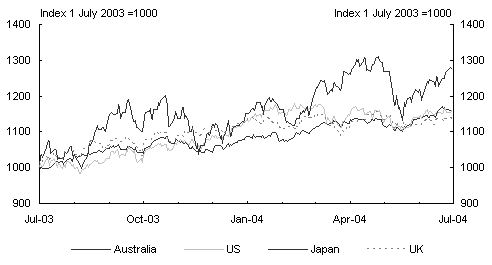
Source: Reuters.
Exchange rates
In year average terms the Australian dollar appreciated by 22percent against the USdollar and 15percent against the Trade Weighted Index in 2003-04.
The broad movements in the exchange rate over the year were an appreciation up to February 2004 followed by a depreciation to the end of the year. By the end of 2003-04 the Australian dollar was broadly unchanged in trade weighted terms, depreciating by just per cent. The Australian dollar appreciated by around 4per cent against the USdollar and depreciated against the yen and euro by about 6per cent and 2per cent respectively.
1 Based on June 2004 National Accounts data.
2 The rest of East Asia comprises Hong Kong, Indonesia, Korea, Malaysia, the Philippines, Singapore, Taiwan and Thailand.