The Australian economy grew solidly in 2002-03, despite the impact of a severe drought, a weak world economy and a number of temporary international shocks. Growth was below that forecast in the 2002-03 Budget, but broadly in line with the Mid-Year Economic and Fiscal Outlook (MYEFO) forecast, which was revised down from Budget mainly due to the expected impact of the drought on the economy.
Domestic demand grew strongly, underpinned by solid consumption growth, continued dwelling investment growth and a strong pick-up in business investment. The domestic strength more than offset the decline in net exports associated with weak world demand, reduced farm production, and the effects of the Severe Acute Respiratory Syndrome (SARS) epidemic and security concerns on tourism.
In 2002-03, employment grew strongly, with the unemployment rate declining from 6.3percent in the June quarter 2002 to 6.1percent in the June quarter 2003. Inflation remained moderate and labour costs were well contained.
Overview
The Australian economy grew by 2.7percent in year-average terms in 2002-03 after growing by 3.8percent in 2001-02. This outcome was below the 2002-03 Budget forecast but broadly in line with the MYEFO forecast. The solid outcome was against a backdrop of a weak international environment and a severe drought. Growth was driven by strong domestic demand which more than offset a large subtraction from net exports. Household consumption was solid, business investment grew very strongly, despite the gloomy international environment, and housing investment continued to hold up for longer than expected, providing a solid fillip for domestic spending.
Growth in the world economy and Australia's major trading partners (MTPs) was subdued for much of the year. In 2002, the world economy and MTPs each grew by 3percent, after weak growth in the previous year. Growth in the United States (US) and Japan picked up in the latter part of 2002-03, while Europe remained weak.
Geopolitical tensions associated with the war in Iraq, higher oil prices and the outbreak of SARS weighed heavily on the world economy in 2002-03. These events adversely affected world growth and reduced demand for Australia's exports. Services exports were badly affected with short-term visitor arrivals to Australia dropping substantially.
The worst drought on Australian record unfolded over the year. Farm production declined by around 28 per cent, subtracting around 1percentage point from GDP growth in 2002-03. The decline in farm production was driven by a decline of around 60percent in the production of cereals and grains. The impact on GDP in 2002-03 was greater than the effects on GDP of droughts in 1982-83 and 1994-95.
With an adverse external environment, the drought and strong domestic demand, the current account deficit (CAD) widened to 5.6percent of GDP.
Employment grew by 2.5 per cent in 2002-03 following subdued growth in the previous year. The largest increases in employment were primarily in retail trade and property and business services. The unemployment rate declined slightly to just over 6 per cent.
Wages growth picked up in 2002-03 in line with strengthening labour market conditions, although the level of wages growth remained well contained. Inflation was moderate, with prices increasing by 2.7 per cent through the year, consistent with the Government's medium-term inflation target.
The world economy
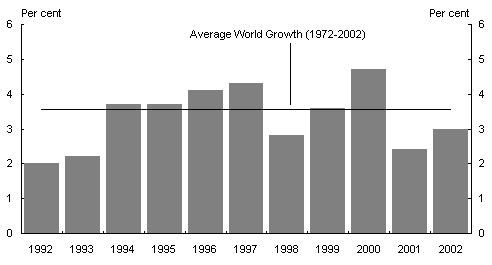
The world economy grew by 3percent in 2002 after growing by 2.4percent, the slowest rate of growth in almost a decade, in 2001 (Chart 1). This outcome was broadly consistent with the 2002-03 Budget and MYEFO forecasts for world growth of 2¾percent. Australia's MTPs grew by 3percent in 2002, after growing by 1.5percent in 2001. The MTP growth forecasts were revised up in MYEFO to 2percent for 2002, primarily reflecting the improved outlook for Japan.
Chart 1: World growth(a)
- World GDP growth rates are calculated using GDP weights based on purchasing power parity.
Source: National statistical publications, International Monetary Fund (IMF) and Treasury.
The world economy staged a modest recovery in the first half of 2002 before losing momentum on the back of sharply lower global equity prices and persistently higher oil prices (Box1). These influences persisted through the first half of 2003 and, together with heightened international political tensions, the conflict in Iraq and the outbreak of SARS, undermined consumer and business confidence.1
In the US, GDP growth was 2.7percent in 2002-03, with the pattern of recovery broadly consistent with the growth profile following the last US recession in 1990. However, employment growth out of the recession was much weaker than that coming out of previous recessions.
In 2002-03 consumer spending was an important source of support for overall USdemand, while US export performance remained lacklustre, reflecting economic weakness in its MTPs. The faster growth of imports relative to exports pushed the USCAD to a record high of 5.2percent of GDP during the year, raising concerns about its sustainability. With short-term US interest rates below those in the Euro area and continued concerns about the large US CAD, the US dollar depreciated from its early 2002 peak.
Monetary and fiscal policies in the US were very supportive of growth in 2002-03. The Federal Reserve Board reduced the federal funds target rate by 75basis points in 2002-03 to 1percent, its lowest level in 45 years. The target rate has been eased by 550basis points since 2001. The fiscal deficit widened from about 1.5percent of GDP in 2001-2002 to around 3.5percent of GDP in 2002-2003, due to increased Government spending, particularly defence and security-related expenditures, and tax cuts.
Euro area GDP growth in 2002-03 was 0.7percent, with Germany, Italy and the Netherlands entering recession. Investment spending and external trading conditions were areas of weakness, reflecting highly leveraged corporate balance sheets, weak demand among the major industrial economies and an appreciation of the Euro.
Consumption in the Euro area picked up slowly over 2002-03 and household balance sheets appeared to be in good shape. However, household confidence remained low, reflecting high and rising unemployment. The European Central Bank lowered interest rates by 50basis points in June2003 taking the official interest rate to 2percent.
Growth in the United Kingdom weakened in late 2002, as consumption growth slowed and investment remained weak. Net exports contributed to GDP growth in the first half of 2003. Annual house price inflation remained high but showed signs of moderating during 2002-03.
In 2002-03, GDP growth in Japan was 2.5percent, exceeding expectations. External demand was an important driver of growth. Profitability remained weak in the Japanese corporate sector and resulted in job losses and wage cuts. However, private consumption remained resilient. Structural problems continued to hamper the Japanese economy, particularly persistent deflation and the weak financial system.
Non-Japan East Asia recovered in the first half of 2002-03, as the influence of the global economic slowdown on investment, exports and industrial production dissipated. This recovery saw a rebound in the electronics sector, which had been in decline for almost two years. The Bali bombing on 12October2002 provided a setback to the recovery, undermining the confidence in stock markets and currencies in South East Asia.
|
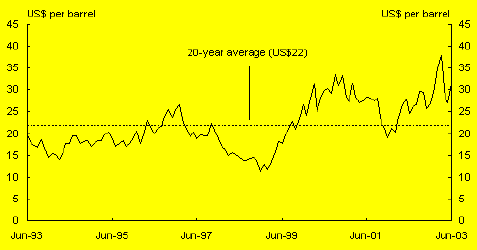
Box 1: Oil demand and supply issues Oil prices averaged around US$30 per barrel over 2002-03, well above their 20-year Chart A: West Texas intermediate oil prices Source: Datastream. In March2003, the increase in geopolitical uncertainty and possible supply disruptions associated with the war in Iraq resulted in an estimated 'premium' of over US$4per barrel. Despite oil prices falling from 12-year highs once the war in Iraq commenced, oil prices remained well above their long-run average due to unresolved oil supply constraints, ongoing high demand and uncertainty surrounding the resumption of Iraqi oil exports. Total world oil demand in 2002-03 was boosted by colder-than-normal weather in North America and Asia, a sharp increase in Chinese imports of oil and a decline in Japanese nuclear energy output. |
A slowdown in the region became evident early in 2003, mostly due to weaker domestic demand. Domestic demand slowed markedly, initially reflecting war-related uncertainties and surging oil prices, and subsequently SARS. Notwithstanding the rapid expansion of intra-regional trade, export growth slowed in early 2003 in several countries, including Korea, the Philippines and Singapore.
Hong Kong, Taiwan and Singapore were severely affected by SARS, as tourism and retail sales plummeted. This led to downward revisions to growth for most countries in the region as consumption slowed and investment moderated. Foreign direct investment to China was reduced as the full impact of SARS on the economy was assessed. With inflation contained in the region, monetary policy was eased in a number of East Asian economies and fiscal stimulus increased to offset the negative impact of SARS.
In spite of SARS and the general weakness in the global economy, China and Thailand continued to grow strongly through the first half of 2003.
Domestic economy
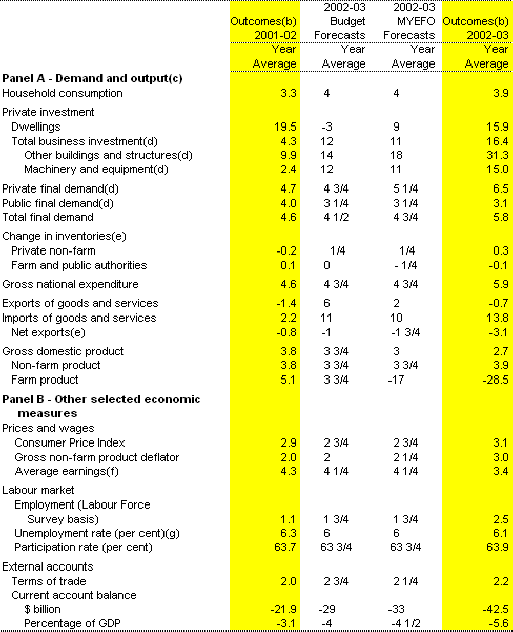
Table 1 compares the actual outcomes for the domestic economy in 2002-03 with both the 2002-03 Budget and MYEFO forecasts.
At the time of the 2002-03 Budget, the Australian economy was continuing to grow solidly, underpinned by strong domestic demand.
Household consumption and business investment were expected to contribute strongly to growth in 2002-03. However, dwelling investment was anticipated to decline moderately over the course of the year as a result of the unwinding of the bring-forward of building activity related to the First Home Owners Scheme (FHOS).
At Budget export growth was forecast to rebound in 2002-03 as the world economy recovered. Reflecting the relative strength of the Australian economy, net exports were expected to subtract from domestic growth and the CAD was expected to increase moderately.
At MYEFO, the growth forecasts for the Australian economy were revised down by ¾ of a percentage point, mainly due to the expected impact of the drought, which by then was affecting large parts of Australia. The 2002-03 Budget forecasts assumed average seasonal conditions in 2002-03. Offsetting this, the forecast for dwelling investment in MYEFO was revised up as, despite first home owner activity falling as expected, the underlying drivers of housing remained firm and building activity continued to grow strongly.
Table 1: 2002-03 Budget and MYEFO forecasts and outcomes(a)
- Percentage change on preceding year unless otherwise indicated.
- Calculated using original data, except average earnings and the labour market measures which are calculated using seasonally adjusted data.
- Chain volume measure.
- Excluding transfers of second-hand asset sales from the public sector to the private sector.
- Percentage point contribution to growth in GDP.
- Average non-farm compensation of employees (national accounts basis).
- The rate in the June quarter of each year.
Source: ABS Cat. No. 5206.0, 2002-03 Budget, 2002-03 MYEFO.
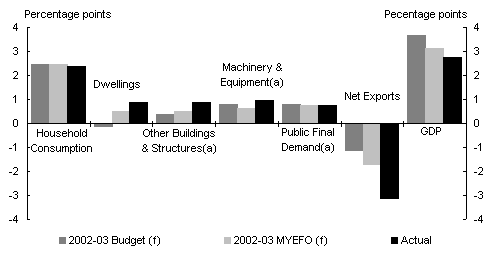
As it turned out, growth in domestic demand was higher than forecast reflecting stronger dwelling investment and non-residential construction. In contrast, net exports subtracted more from growth than forecast due to the severity of the drought, the effects of the war in Iraq and SARS on exports, and strong import growth. Overall, economic growth was slightly lower than forecast at MYEFO (Chart2).
Chart 2: Contributions to GDP growth 2002-03
- Adjusted for second hand asset sales.
Source: ABS Cat. No. 5206.0, 2002-03 Budget, 2002-03 MYEFO.
Domestic demand
Household consumption
Household consumption was again one of the key drivers of economic growth in 2002-03, rising by 3.9percent. This outcome was consistent with the forecasts in the 2002-03 Budget and MYEFO.
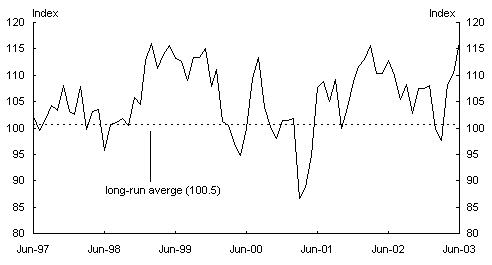
Consumer spending was supported by sustained income growth, historically low interest rates and a solid increase in household wealth, associated with rising house prices. Consumer confidence held up well, despite ongoing global uncertainty and one-off shocks, such as the Bali bombings and the war in Iraq (Chart3). Traditional retailing, such as clothing and household goods, grew strongly in 2002-03 along with sales of motor vehicles. Consumption spending continued to grow faster than disposable income, leading to a further decline in the household saving ratio, and household debt increased.
Chart 3: Consumer sentiment
Source: Westpac-Melbourne Institute Consumer Sentiment.
Dwelling investment
Dwelling investment continued to grow strongly in 2002-03, rising by 15.9percent and contributing around 0.9percentage points to GDP growth, well above the 2002-03 Budget and MYEFO forecasts.
At the time of the 2002-03 Budget, the additional FHOS grant, which had caused a short-term bring-forward of new building activity, was being phased out and the bring-forward in activity was expected to be unwound over the course of 2002-03.
There were also emerging signs of an excess supply in some segments of the housing market, particularly for medium/high density dwellings in Sydney and Melbourne, with rental vacancy rates rising to around historical highs. This was expected to deter investment in new dwellings.
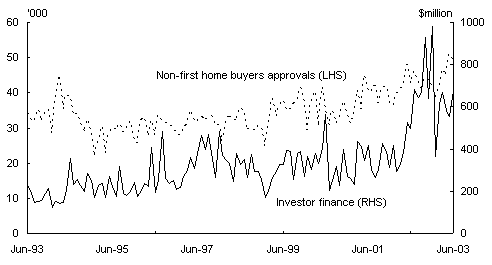
After continuing to grow in the second half of 2002, new dwelling investment fell in the first half of 2003, driven by the unwinding of FHOS. However, the rest of the market remained strong for longer than expected (Chart4). Low interest rates, easy access to finance, an expectation of large capital gains and the poor performance of alternative investments continued to make investment in residential rental property attractive. As a result, investor activity hit record levels. Between February and December 2002, the value of finance approvals for investors in residential property more than tripled (Chart4). Spending on alterations and additions also grew very strongly.
Chart 4: Housing finance
Source: ABS Cat. No. 5609.0 and 5671.0.
Business investment
Private new business investment grew by around 16percent in 2002-03. This was a little higher than the 2002-03 Budget and MYEFO forecasts. Economic conditions, such as low interest rates and high levels of corporate profitability, remained supportive for business investment. Investment intentions generally held up well despite the uncertainties surrounding the global outlook. Moreover, agriculture investment, which was expected to fall sharply in 2002-03 as drought-affected farmers deferred investment plans, did not decline as much as expected.
Investment in other buildings and structures grew by around 31percent in 2002-03 in year-average terms and contributed 0.9percentage points to GDP growth, driven by a boom in engineering construction (Box2). This outcome was well above both the 2002-03 Budget and the MYEFO forecasts. Engineering construction was underpinned by several large mining and infrastructure projects.
Investment in new machinery and equipment rose by 15percent in 2002-03, following modest growth in the previous year. The growth in new machinery and equipment was driven by the mining sector and the upgrade of the aviation industry's fleet of aircraft.
|
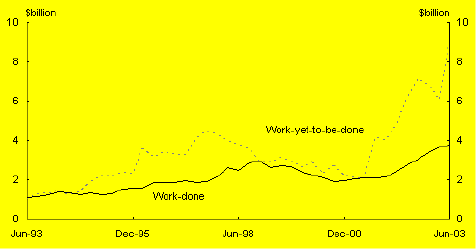
Box 2: Engineering construction boom In 2002-03, Australia experienced a boom in engineering construction. While engineering construction, which includes mines, minerals processing, transport infrastructure and utilities, only accounts for around 12percent of total business investment, it added 0.6 of a percentage point to growth in GDP in 2002-03. Engineering construction grew by 36percent through the year to the June quarter 2003. The ABS estimate of engineering construction work-yet-to-be-done was at its highest level ever in the June quarter 2003 (Chart A). Chart A: Engineering construction Source: ABS Cat. No. 8762.0 and 5206.0. Investment in mining projects was strong, including projects such as the LNG Fourth Train, the Bayu-Undan platform in the Timor Sea and Comalco's Aluminium Refinery. There were also a number of large infrastructure projects under way or nearing completion in 2002-03, including for example: the Western Sydney orbital; the Sydney cross city tunnel; and the Alice Springs to Darwin railway. |
External sector
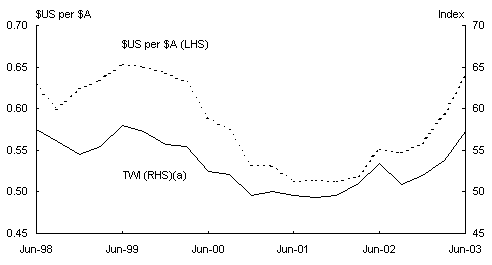
Net exports subtracted 3.1percentage points from GDP growth in 2002-03, substantially greater than the subtraction forecast at Budget and MYEFO. Part of the deterioration was due to the Australian dollar appreciating by around 16percent against the US dollar and 7percent in trade weighted terms through the year to the June quarter 2003.
In the 2002-03 Budget, exports were expected to rebound in 2002-03, although to below long-term trend growth rates, as world growth started to pick-up. Solid farm exports were also expected on the assumption of a return to average seasonal conditions. In MYEFO, the 2002-03 Budget export forecasts were revised down reflecting continued global weakness and the expected impact of the drought.
Export volumes fell by 0.7percent in 2002-03, a much weaker outcome than the forecasts in the 2002-03 Budget and MYEFO of 6percent and 2percent growth respectively. The weaker export outcome reflected a combination of the continued global weakness, the drought, an appreciation in the Australian dollar, and the temporary impact of SARS and the war in Iraq.
Weak MTP growth and a strengthening exchange rate restricted growth in exports of elaborately transformed manufactures (ETMs) to below trend levels in 2002-03. Growth in exports of ETMs was 3.7percent in 2002-03, compared with decade annual average growth of around 9percent.
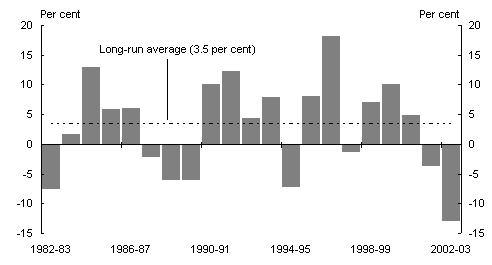
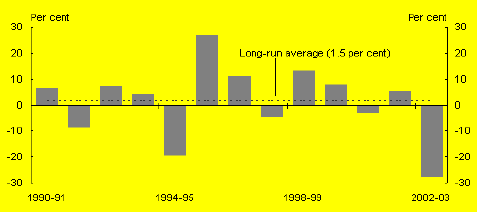
As a result of the drought rural exports fell by 12.8percent in 2002-03, in year-average terms, the largest decline on record (Chart5 and Box3).
Chart 5: Rural export growth
(year average)
Source: ABS Cat. No. 5302.0.
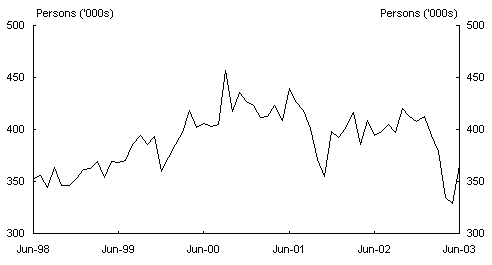
Service exports declined by 2.4percent in 2002-03. Tourism was particularly affected by the health and security concerns associated with the SARS epidemic, the Bali bombings and the war in Iraq. Short-term overseas arrivals declined 7.5percent over the year to June2003, with much of the fall occurring in early 2003 (Chart6).
Chart 6: Short-term visitor arrivals
Source: ABS Cat. No. 3401.0.
Adverse external conditions were also reflected in weaker export prices in 2002-03, exacerbated by the appreciation of the Australian dollar exchange rate. Export prices fell by 2.6percent.
Chart 7: Exchange rates
- TWI May 1970 = 100.
Source: ABS Cat. No. 5302.0.
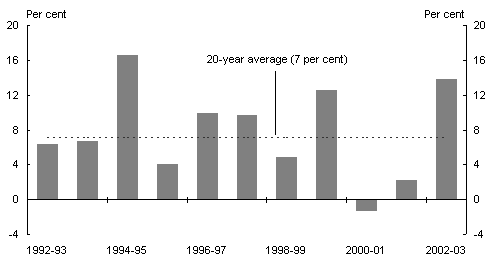
Import volumes grew strongly in 2002-03, with a substantial 13.8percent year-average increase (Chart8). This was broadly in line with the 2002-03 Budget and MYEFO forecasts.
The strong growth in imports reflected strong domestic demand, particularly import-intensive business investment, and a partial substitution of imports for domestically produced goods and services as the Australian dollar rose. The aviation industry's upgrading of its fleet of civil aircraft also contributed to the strong import growth.
Chart 8: Import growth
(year average)
Source: ABS Cat. No. 5302.0.
Import prices fell by 4.7percent in 2002-03 in year-average terms, largely driven by the rise in the Australian dollar. The decline was partially offset by an increase of around 10percent in year-average terms for the price of fuels and lubricants, which was largely driven by a rise in crude oil prices.
The terms of trade rose by 2.2percent in 2002-03, below the 2002-03 Budget forecast but in line with the MYEFO forecast. The increase in the terms of trade in recent years contrasts with the decline that has historically been experienced during the course of global economic downturns.
The CAD widened from 3.1percent in 2001-02 to 5.6percent of GDP in 2002-03 due to a deterioration in Australia's trade balance. This compared with a forecast of 4percent of GDP at Budget and 4percent at MYEFO. The net income deficit, which reflects the servicing of Australia's net foreign liabilities, increased slightly to 3percent of GDP. The proportion of exports required to pay the interest on net foreign debt, the debt servicing ratio, declined further in 2002-03, to be 8.3percent in the June quarter 2003.
|
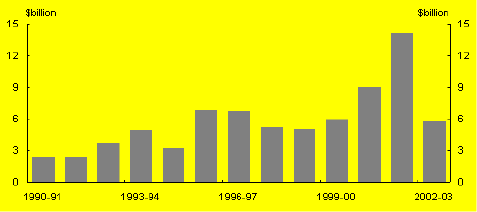
Box 3: The impact of the drought The farm sector has historically accounted for around 3.5percent of Australian GDP, but has contributed more than one-fifth of total exports. During the course of 2002-03, severe rain deficiencies across much of Australia had a substantial adverse impact on most aspects of farm activity. Farm production d Chart A: Farm GDP growth Source: ABS Cat. No. 5206.0. The decline in farm production was driven by a decline of around 60percent in the production of cereals and grains. Rural exports declined by around 13percent in year-average terms in 2002-03, subtracting around 2.5percentage points from total export growth. Cereal and grain exports declined by over 30percent in year-average terms. Farm incomes declined sharply over 2002-03, down around 60percent in year-average terms (ChartB). The drought and the appreciation in the Australian dollar over the course of the year contributed significantly to the decline. Agricultural employment declined sharply, to be around 60000 persons lower in year-average terms in 2002-03. This followed a peak in farm employment in 2001-02, after very favourable conditions in recent years. Investment in farm machinery in 2002-03 was relatively stable, as farmers prepared for an end to the drought. |
|
Box 3: The impact of the drought (continued) Chart B: Agricultural income Source: ABS Cat. No. 5206.0. |
Labour market
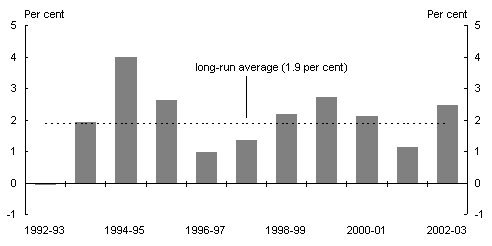
In year-average terms, employment increased by 2.5percent or 226500 persons in 2002-03, following growth of 1.1percent in 2001-02 (Chart9). The increase in employment was underpinned by solid growth in both full-time and part-time employment, consistent with the solid outcome for non-farm GDP growth and moderate wages growth.
The strong growth in employment in 2002-03 was above the 2002-03 Budget and MYEFO forecasts of employment growth of 1percent. The higher-than-expected outcome reflected very strong employment growth in the middle part of the year.
Chart 9: Employment growth
(year average)
Source: ABS Cat. No. 6202.0.
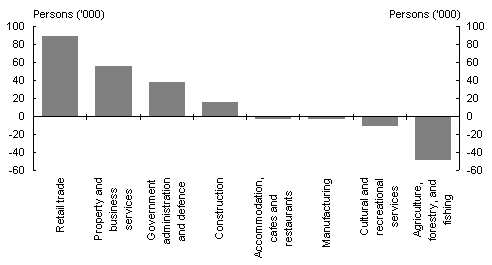
Through the year to June2003, employment growth was strongest in the retail trade, property and business services, government and construction sectors (Chart10). In contrast, employment in agriculture declined significantly in 2002-03 due to the drought.
Chart 10: Employment growth in selected industries
(level change, through the year to June 2003)
Source: ABS Electronic Publication No. 6291.0.55.001.
The unemployment rate declined from 6.3percent in the June quarter 2002 to 6.1percent in the June quarter 2003, in line with the 2002-03 Budget and MYEFO forecasts.
Wages and prices
Wages growth remained well contained in 2002-03.
The National Accounts measure of wages — average non-farm compensation of employees (AENA) — increased by 3.4percent in year-average terms in 2002-03. Other measures pointed to more solid wage outcomes over the past year. The Wage Cost Index (WCI) increased by 3.6percent in through-the-year terms in 2002-03, up from 3.1percent in 2001-02, while average weekly ordinary-time earnings of full-time adults (AWOTE) increased by 6.3percent in 2002-03, up from 5.2percent in 2001-02. Business surveys, including the National Australia Bank's measure of total labour costs, also pointed to a moderate increase in wages growth in 2002-03.
At the industry level, the education sector recorded the fastest rate of increase in the WCI in 2002-03, with growth of at 4.4percent in year-average terms. The average weekly earnings measures show that solid wage increases were also recorded in the manufacturing, construction, and health and community services industries.
Inflation remained moderate in 2002-03. The headline CPI increased by 3.1percent in year-average terms and by 2.7percent in through-the-year terms in 2002-03. This outcome was slightly above the 2002-03 Budget and MYEFO forecasts.
Increases in housing and food prices were major contributors to year-average inflation in 2002-03, each contributing 0.7percentage points. The increase in the price of housing, driven by higher house purchase costs, reflected increased material and labour costs associated with strong demand in the housing market, in addition to higher insurance costs.
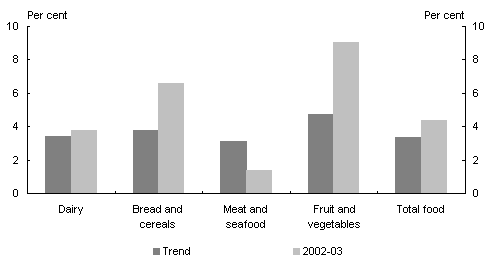
The drought is estimated to have contributed around of a percentage point to inflation in 2002-03, through higher food prices. This estimate primarily reflects higher-than-usual price increases for fruit and vegetables and bread and cereal products, partly offset by lower-than-usual prices for meat and seafood (Chart11).
Chart 11: Drought impact on food prices
(growth in selected food sub-groups(a) (b))
- Year end growth rates.
- Where trend is defined as the annual average increase in the sub-group over the past decade.
Source: ABS Cat No. 6401.0.
Notwithstanding the impact of the drought and the strength in the housing market on individual components of the CPI, general price pressures in the economy remained in check. While wages growth picked up in 2002-03, in line with the strong labour market, overall labour costs remained contained. Further, imported inflation remained subdued, reflecting weak global conditions, the ongoing fall in the prices of imported information and communication technology goods, and the appreciation of the exchange rate.
Consistent with moderate growth in the medium-term drivers of inflation, headline inflation was within the target band at June2003.
The Reserve Bank left the official cash rate unchanged at 4.75percent over the course of 2002-03. This reflected the subdued inflation outlook and a balancing of domestic factors, including relatively solid growth, against the backdrop of a weak and uncertain international economic environment. Australian 10-year bond yields fell from above 6percent at the beginning of July2002 to just over 5percent at end-June2003, while Australian equity prices, as measured by the ASX 200 index, fell by around 6percent during the course of 2002-03.
In 2002-03, the Commonwealth recorded an underlying cash surplus of around $7.5billion (1percent of GDP).
1 For a discussion of the effects of SARS see ' The economic impact of Severe Acute Respiratory Syndrome' in the Winter 2003 edition of the Economic Roundup.
