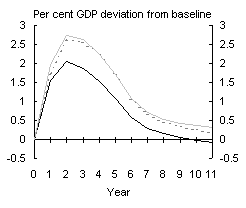
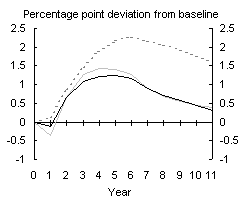
Over the last few months, risks to the global economic outlook have heightened, raising doubts about the sustainability and strength of the global recovery. These risks include higher oil prices, the continued sharp fall in equity prices and widening current account imbalances. This article assesses the potential impact on the Asia-Pacific region, if the risks are realised, using the Asia-Pacific G-cubed model.1
Introduction
The world economy grew by only 2.2 per cent in 2001, the slowest rate of growth in almost a decade. The global economy has now entered a period of recovery, with most economies recording a significantly improved real GDP growth performance in the first half of 2002.
Over the last few months, however, risks to the international economic outlook have heightened, raising doubts about the sustainability and strength of the recovery. Of particular concern are: a sustained increase in oil prices; continued sharp falls in equity prices; and widening current account imbalances.
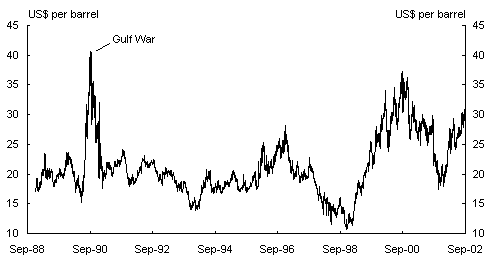
Significantly higher oil prices, if maintained for a considerable period of time (around a year or more), would increase global inflation and depress real global output. The increasing tension in the Middle East has already caused oil prices to rise. The West Texas Intermediate Oil price has risen from around US$19 per barrel in January 2002 to around US$30 per barrel in September 2002. During the Gulf War, oil prices rose from US$15 per barrel in June 1990 to US$40 per barrel in October 1990, but settled back relatively quickly to US$19 per barrel by the end of the war in February 1991 (Chart 1). The impact of higher oil prices on the global economy will depend not only on the price of oil but for how long the higher price is maintained.
Chart 1: West Texas intermediate crude oil
Source: Datastream.
Previous studies by the IMF have investigated the impact of a 20 per cent rise in oil prices, using the IMF Multimod model.2 These studies showed that a 20 per cent rise in oil prices would be accompanied by a spike in global inflation and a fall in real global GDP one year after the shock of 0.3 per cent relative to baseline. However, the IMF study noted that the results possibly underestimated the global impact, as they do not incorporate the impact of higher prices on other energy products.
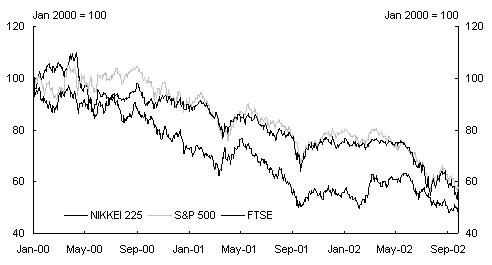
Falling equity prices represent a risk to the global economic outlook as they reduce wealth and confidence and impact negatively on consumption and investment expenditures. Equity markets weakened substantially over the September quarter 2002. Weak profit reports combined with uncertainties surrounding a potential war with Iraq led to falls in the major indices. In the US, the S&P 500 has declined by almost 50 per cent from its peak in March 2000 to the end of September 2002 (Chart 2).
Chart 2: Equity markets in the US, Japan and UK
Source: Datastream.
The sustained fall in global equity prices began with the bursting of the Information and Communications Technology (ICT) bubble and has continued with the increasingly uncertain world economic outlook. The situation has been exacerbated in the US and Europe because of a series of accounting scandals and corporate collapses, particularly in the ICT sector. Major US companies, notably Enron and Worldcom, used questionable accounting practices that have led to a decline in confidence in US corporate reporting, and the biggest corporate bankruptcies in US history.
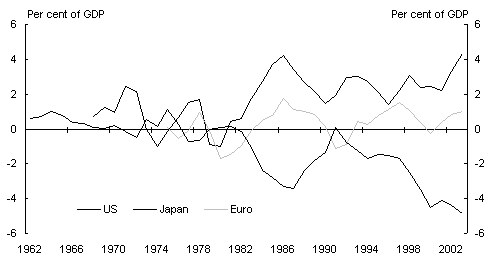
The current account deficit (CAD) in the US widened to a record US$130 billion (5.0 percent of GDP) for the June quarter 2002. This deficit is being counterbalanced by surpluses in many countries and regions, including Japan, the Euro area and emerging East Asia (Chart 3). Very large US CADs in the past have not usually been maintained for very long, as they can only be sustained while the rest of the world (ROW) is willing to fund the CAD through investment in the US.3 Concerns have been raised about the possibility of a sharp and disorderly adjustment to the size of the US CAD and the potential impact on the US and the ROW.
Chart 3: Current account balances
Source: OECD Economic Outlook Database (April 2002).
OECD forecasts for 2002.
This article explores the potential impact on the Asia-Pacific region if these risks were realised.4 The risks and their impacts are quantified through various simulations conducted using the APG-cubed model, a multi-country model developed by McKibbin and Wilcoxen (see Box 1 for a discussion of the main features of the model). While these risks are simulated independently of each other, it is possible that a combination of these risks could arise together. Under these circumstances, the potential impact would be more substantial than what the independent simulations predict. On the other hand, while the model incorporates some policy reactions to shocks, the simulations do not include the impacts of actual policy actions already in train or that could be undertaken in addition to those embedded in the model. The actual impacts could therefore be less than the simulations predict.
It should be stressed that the results generated by the Asia-Pacific G-cubed model should not be interpreted as a definitive prediction of the outcome following a shock to the system. This model, as with all models, is a simplification of a very complex set of relationships. It provides a particular theoretical path of adjustment that reflects the model structure. Models that are structured differently will give different results. The model results therefore only provide a broad indicative guide to possible outcomes.
|
Box 1: The Asia-Pacific G-cubed model The Asia-Pacific-G-cubed multi-country model was developed by McKibbin and Wilcoxen. It is a sophisticated general equilibrium macroeconomic model that recognises the important trade and financial linkages that exist between countries. The model has a detailed country coverage (including 6 sectors in each of 18 economies) and links between countries through goods and asset markets. Each economy consists of several economic agents, covering households, the government, the financial sector and 6 production sectors. The behaviour of each type of agent is modelled and includes intertemporal budget constraints and forward-looking behaviour in investment and consumption. Agents are assumed to optimise their behaviour; for example, firms choose inputs and their level of investment in order to maximise their stock market value. Flows of financial assets between countries (including investment) are driven by expected rates of return. Existing differences between rates of return in different countries are generated by various restrictions that generate a risk premium on country denominated assets. Shocks in the model induce changes in expected rates of return in different countries, and these changes generate flows of financial capital reacting to return differentials at the margin. Flows of financial assets are also linked to the real sector, so a country with a net capital inflow will also have a current account deficit. This is because each financial asset represents a claim over real resources; for example, foreign assets represent a claim over the future expor The main features of the model are:
|
The model measures the impact of shocks by estimating the movement away from a baseline. This baseline is where the particular economy is estimated to be if the shock had not occurred. For example, the model predicts that a sustained increase in energy prices would reduce real GDP in the US by 2¾ percentage points from the baseline after two years. This does not mean that there would necessarily be a recession in the US, but that the level of real GDP would be 2¾ percentage points below where it would otherwise have been in two years time.
The scenarios
Scenario 1 - Sustained increase in energy prices
Scenario 1 simulates a sustained increase in energy prices due largely to a sustained rise in oil prices. This simulation overcomes the limitation of the IMF study in that it incorporates the effects of contemporaneous shifts in the prices of other oil-related energy products.
The simulation is conducted by applying a supply shock in the energy sector for 3 years, causing the price of energy to rise by around 30 per cent. This energy price shock aims to capture the potential effects of the sustained increase in oil prices of around 60 per cent observed from January to September 2002.
Petroleum is estimated to account for over a third of total primary energy consumption. It is assumed that a 60 per cent rise in oil prices would flow through to an increase of around 23 per cent in natural gas prices and around a 3 per cent rise in the price of other energy products.5
This method of simulating an oil price shock using this model will tend to overestimate the negative impact on global real GDP, as it does not adequately capture the income gains made by energy producing countries.6
The simulation shows that a sustained negative supply shock in the energy sector that leads to increases in energy prices, would cause a worldwide spike in consumer price inflation and a decline in global real GDP from baseline.
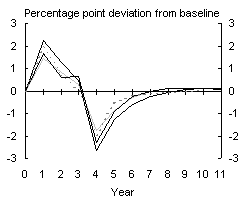
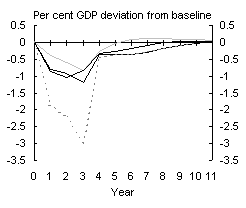
In the model, consumers seek to offset the impact of higher oil prices through higher wages and producers attempt to restore profit margins through increasing prices. These immediate wage/price responses cause a spike in consumer price inflation (Chart 4). As a result, real disposable income falls and so does private consumption (Chart 5).
|
Chart 4: CPI Inflation
|
Chart 5: Consumption
|
|
|
|
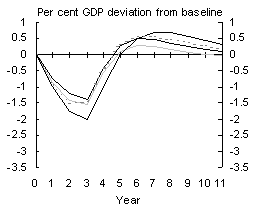
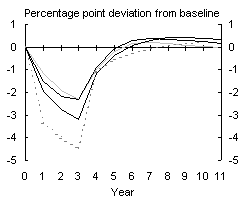
Monetary authorities in the model are assumed to counter the wage/price spiral by tightening monetary policy, causing short-term interest rates to rise. The increase in the price of energy inputs and higher interest rates lead to increases in the cost of producing goods and services in the economy, putting pressure on profit margins. Lower expected future profits result in declining equity prices and investment. The wealth effect of the decline in the value of equities has a further negative impact on consumption. The reduction in both consumption and investment (Chart 6) leads to overall declines in real GDP from baseline (Chart 7).
|
Chart 6: Investment
|
Chart 7: Real GDP
|
|
|
|
In contrast to previous studies that only investigated the impact of oil prices, the current simulation indicates that the impact on the global economy would be significantly higher if prices of other energy products also rise as the oil price increases.
Scenario 2 - Sustained fall in global equity prices
Scenario 2 simulates a sustained fall in global equity prices as investors re-assess equity risk premia.7
The rise in the equity risk premium is modelled as a 10 percentage point increase in the first year, which implies that equities require a rate of return 10 percentage points higher than baseline over riskless government bonds. It is further assumed that authorities will act to improve corporate governance and reporting requirements, and so the rise in the risk premium will be reduced to 8 percentage points in the second year, 5 percentage points in the third year and then return to baseline.
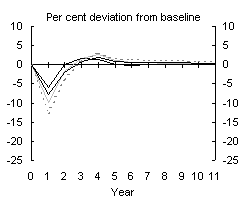
In the model, the immediate impact of a higher equity risk premium is a sharp drop in equity prices, as investment funds are diverted to other assets such as bonds and real estate. The resulting decline in the Tobin's q8 ratio (Chart 8) causes investment spending to fall (Chart 9). The Tobin's q ratio recovers relatively quickly, rising above baseline in the third year as investors become attracted to the market by underpriced shares and the potential for higher future growth.
|
Chart 8: Tobin's Q durable manufacturing
|
Chart 9: Investment
|
|
|
|
According to the model, consumption rises above baseline for a number of years. This may be explained by the positive wealth effects from increased prices of other assets, particularly real estate, which more than offset the negative wealth effects of lower equity prices. However, consumption eventually falls as household income falls.
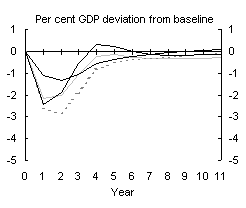
The sharp falls in investment predicted by the model cause real GDP to fall below baseline and remain there for over 10 years in most economies (Chart 10). The worldwide reduction in real GDP from baseline contracts international trade and reduces demand for exports in all countries, which further reduces real G
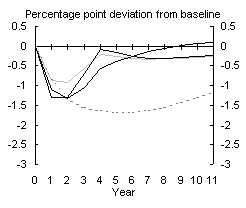
DP growth. The model also predicts some adjustment to current account imbalances with a reduction in the US current account deficit and a reduction in the current account surplus of Japan (Chart 11).
|
Chart 10: Real GDP
|
Chart 11: Current Account Balances
|
|
|
|
Scenario 3 - Sharp adjustment to current account imbalances
This scenario simulates a sharp adjustment to current account imbalances, arising from an assumed very sharp fall in investor confidence in the US. This is followed by large capital outflows from the US which would result in a rapid exchange rate adjustment.
The loss of confidence is simulated as a 5-year reduction in the exchange rate risk premium of the ROW, which increases the attractiveness of investment assets outside of the US. The exchange rate risk premium in the ROW is reduced by 15 per cent in the first 2 years and then by 10 per cent in the remaining 3 years. This size of shock is intended to show the extent of adjustment in exchange rates, investment and consumption required to force the US CAD to adjust by around 2 per cent of real GDP.
In the model, the shock causes a substantial depreciation of the US exchange rate as capital flows out of the US economy causing investment, real GDP and private consumption to fall significantly (Chart 12). The real effective exchange rate (REER) in the US falls initially by 38 per cent, tapering off to around 4 per cent at the end of the 5-year shock (Chart 13). A depreciation of this size would not be exceptional when viewed in a historical context. For example, from its peak in 1985 to the 1991 recession, the REER in the US depreciated by around 50 per cent. During this period, the current account balance in the US changed from a deficit of 3.5 per cent of GDP in 1986 to a surplus of 0.8 per cent of GDP in 1991 (Chart 14).
Chart 12: US Investment, consumption and real GDP
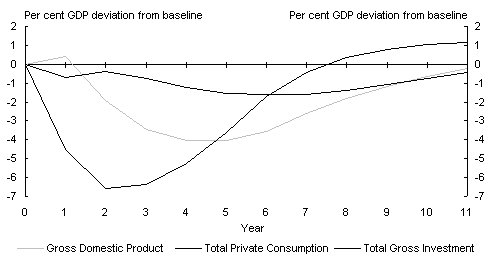
Chart 13: US REER and current account balance (simulation)
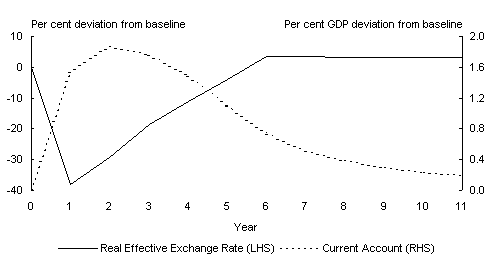
Chart 14: US REER and current account balance
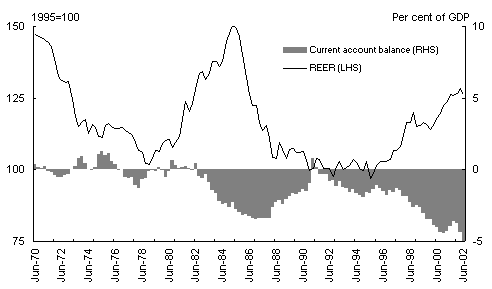
Source: US, CAD, Treasury estimates from BEA Data; REER OECD Main Economic Indicators Database.
Under the model's adjustment path, the substantial depreciation in the exchange rate improves the US trade balance, resulting in a significant reduction in the US CAD. If the current US CAD of around 5 per cent of GDP were taken to be the baseline, this would mean a reduction in the CAD to around 3 per cent of GDP two years after the initial shock. However, this improvement in the CAD erodes fairly rapidly after the shock is complete.
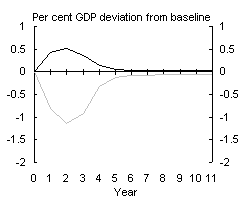
The model predicts that a very large capital outflow from the US, which forces the US CAD to adjust, would generally be beneficial for the East Asian economies.9 This arises because the positive effects on investment in East Asian economies would more than offset the negative impacts on the trade side. As capital funds previously flowing into the US are redirected to East Asian economies, interest rates in East Asia would fall below baseline for a number of years, causing investment to rise significantly (Chart 15) - this in turn causes real GDP to increase. The positive effect on real GDP in East Asia is partially offset by falls in exports, driven by reduced US demand and increased competitiveness of US exports resulting from the US dollar depreciation. In most countries, the export effect is enough to cause real GDP to fall slightly below baseline (Chart 16) initially, before being offset by higher investment.
|
Chart 15: ROW Investment
|
Chart 16: ROW Real GDP
|
|
|
|
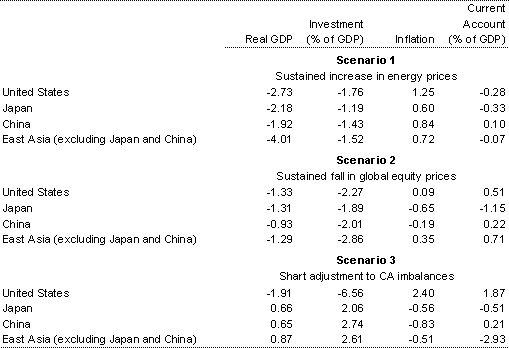
Table 1 summarises the model's results from the three shocks that have been simulated.
Table 1: Effects of various shocks after two years - per cent deviation from baseline
Conclusion
This article has examined potential effects of the risks to the global outlook. While there are identifiable risks to the global outlook, monetary and fiscal policies have been eased substantially around the globe and are supporting the real economy, which has been in recovery for a few quarters. A quick resolution or abatement of some of the major uncertainties currently facing the world could easily see the global recovery gather momentum.
It is also important to note that the theoretical results of the Asia-Pacific G cubed model should only be used as a broad indicative guide in the event of certain shocks to the global economy eventuating.
According to the model, a sustained rise in energy prices would lead to a significant fall in global real GDP growth below baseline and an increase in inflation. A sustained fall in global equity markets would also lead to a significant reduction in world real GDP growth from baseline, which also results in a reduction in current account imbalances.
The scenario modelling a sharp adjustment to current account imbalances showed that a substantial depreciation of the US exchange rate would be required to force a significant reduction in the US CAD. If this were to arise from a sudden loss of confidence in the US, leading to substantial capital outflows, real GDP in the US would fall from baseline, while the ROW and East Asia in particular would benefit from the capital reallocation and increased investment.
1 The Asia-Pacific G-cubed model was developed by McKibbin and Wilcoxen - see Box 1 for more detail on the model. Full specifications of the model can be found at www.gcubed.com.
2 IMF, 'The Impact of Higher Oil Prices on the Global Economy', December 2000 and World Economic Outlook, April and September 2002.
3 A recent IMF study (IMF, World Economic Outlook, September 2002) showed that after three years of large current account deficits, the average country experienced an improvement in the current account of 2 percentage points of GDP over the next three years. The adjustment is usually associated with a significant depreciation of the real exchange rate and a fall in output growth, both beginning a year or mo
re in advance of the current account adjustment.
4 All references to East Asia excluding Japan and China are calculated using GDP weights based on purchasing power parity.
5 Energy Price Shock = 0.60 (x) +.60![]() (y) +.03 (z) where:
(y) +.03 (z) where:
x = 0.37 is the share of oil in total primary energy consumption;
y = 0.25 is the share of natural gas in total primary energy consumption;
z = 0.38 is the share of other energy products in total primary energy consumption; and
![]() = 0.38 is the regression coefficient of the responsiveness of natural gas prices to oil prices.
= 0.38 is the regression coefficient of the responsiveness of natural gas prices to oil prices.
The assumed small price increase in other sources of energy are consistent with IMF findings that price increases in petroleum spill over into the price for natural gas - the source of energy most competitive with petroleum, but not significantly into the market for coal, the other leading source of energy (IMF, 'The Impact of Higher Oil Prices on the Global Economy', December 2000, p 45).
6 In the model, the energy produced in one country is not highly substitutable for the energy produced in another country. Therefore, a shock to the energy sector in one country alone would not necessarily drive up global energy prices. To get around this problem and achieve an increase in the price of global energy of around 30 per cent in the model, it is necessary to apply a negative shock to the energy sector in each country. This is quite different from the situation where the increase in the price of energy being simulated is solely due to a fall in OPEC's supply of oil.
The negative impact of the energy shock is therefore overestimated, because energy production would not necessarily be reduced in each country in the real world. This overestimation is significant for countries where the energy sector is an important part of the economy.
7 A similar simulation was done by McKibbin & Stoeckel using the MSG3 model with similar results. 'What could be the impact of the Worldcom and other US corporate failures,' EconomicScenarios.com, Issue 3, August 2002.
8 Tobin's q ratio is an estimate of the value the stock market places on a firm's assets relative to the cost of producing those assets. With a high ratio, firms will be encouraged to produce more assets, raising investment. Conversely, when the ratio is low investment will fall.
9 While the shock in Scenario 3 is based on a sharp fall in confidence in the US only, it would be possible that such a shock would also drag down confidence in East Asia. If that occurred, the positive GDP results for East Asia would be weaker than shown.
