Australia's strong economic performance in recent years has reflected several key influences in the supply side of the economy - including strong growth in the labour force, declining structural unemployment, and rapid growth in productivity. Demographic projections point to Australia's population growth slowing over the next 50 years and, in turn, the population ageing. Under these circumstances, it is likely that the growth in the labour force will decline, perhaps significantly, although the outcome will be influenced by future trends in labour force participation, particularly amongst older workers. These emerging trends in the labour force suggest that, for any given rate of productivity growth, Australia's trend GDP growth could be lower over future decades than during the 1990s, with some of these influences becoming apparent towards the later part of the coming decade. On the other hand, growth in GDP per capita - which is a more appropriate indicator of the growth in living standards - is not expected to decline to the same extent, if at all.
Introduction
In the year 2000, the population between the ages of 15 and 64 will grow by around 200,000 and the population aged 65 and above will grow by around 40,000. By comparison, in the year 2020, demographic projections suggest that the population between the ages of 15 and 64 will grow by around 40,000 and the population aged 65 and over will grow by around 120,000.
The rate of growth in the overall working age population - defined as the population aged 15 and above - is expected to peak in the current year and, although the number of people of working age will continue to rise, the rate of growth is anticipated to decline as of next year. The gradual shift from a relatively rapid to relatively slow population growth rate, which has occurred over the past two decades, will also contribute to an acceleration of population ageing in coming decades.
Although it will take many decades for slower population growth and the ageing process to have full effect, these trends will become an increasingly important influence on the labour force and overall economic growth rates. For example, while outcomes so far into the future are highly uncertain, it is possible that the average annual rate of growth in the labour force towards the end of the coming decade could be around 1 per cent, or 0.4 percentage points below that in the 1990s. By the middle of the century, the labour force could be declining.
For any given rate of growth of labour productivity, these trends in labour force growth could be reflected in similar trends in Australia's overall rate of economic growth. Nonetheless, based on these trends, Australia would remain amongst the top of the league growth table for developed countries because it will have one of the highest population growth rates. Further, GDP growth per capita1 - which is a more appropriate indicator of the growth in living standards than growth in total GDP - is not expected to slow to the same extent, if at all.
This article examines recent trends and the longer term outlook for each of the four major components of growth. The article concludes with a summary of longer term scenarios for growth in living standards. This article extends earlier work on the medium term outlook which was published in the Winter 1999 edition of the Economic Roundup.
Supply side influences on economic growth over the
long term
Over the longer term, economic growth rates will reflect the net impact of the following supply side influences:
1. the rate of growth in the working age population;
2. changes in workforce participation rates amongst the working age population;
3. changes in the unemployment rate; and
4. the rate of growth in productivity.
|
Box 1: The relationship between GDP and its supply side components The relationship between GDP and supply side components can be represented as follows.
|
The first two of these factors combine to form growth in the workforce, while the first three combine to form growth in employment. Projections of employment growth are of particular interest given the demographic influences of slowing population growth and the ageing of the population. The projections in this article are based on the usual Budget assumption of no policy change.
1. Growth in the working age population
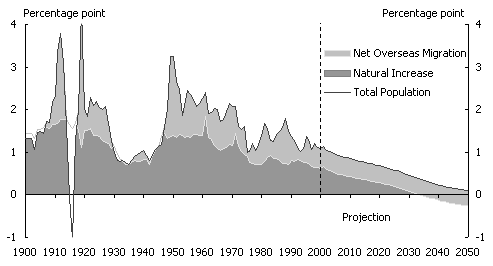
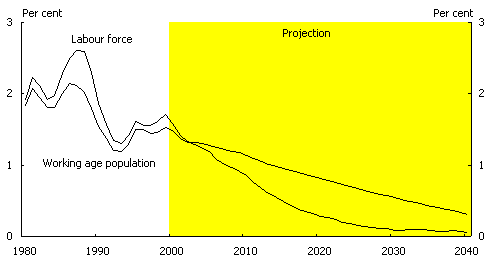
Due to a rapid decline in fertility rates, Australia is expected to experience a sharp slowing in population growth over the next half-century (Chart 1). Based on models of fertility and mortality, and in line with population projections, growth in the working age population is projected to slow from 1.5 per cent per annum in 2000, to around 1.2 per cent in 2010, and less than 0.2 per cent by 2051 (Bacon, 1999). It has been assumed for this projection that net overseas migration will average around 90,000 per annum over the period, broadly in line with the average level over the last 40 years.
Chart 1: Contributions to population growth2
Source: ABS cat. nos. 3102.0 and 3101.0 and Treasury estimates.
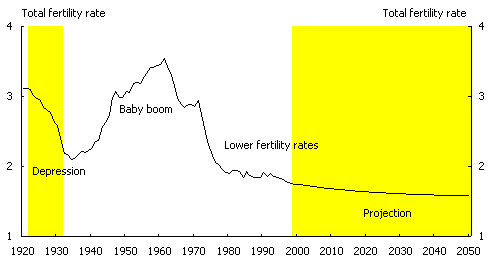
The total fertility rate3 fell sharply from the start of the 1960s through to the early 1970s (the `baby bust'), marking an end to the period of high fertility rates from the end of World War II (the `baby boom') (Chart 2). The projections allow for a continuation of the gradual trend decline in the total fertility rate since the early 1970s (Bacon, 2000). Apart from its implications for growth in the working age population, the impact of the gradual shift from a relatively high to a relatively low fertility rate will contribute to an acceleration of the ageing of the working age population.
Chart 2: The total fertility rate
Source: ABS cat. no. 3301.0 and Treasury estimates.
Over the next 50 years, a sharp decline in the growth of the working age population and its consequent ageing seems largely unavoidable in the sense that it is almost entirely attributable to the fall in fertility. A significant reversal of the downward trend in the total fertility rate would be required to overturn the projected decline in the growth in the working age population and its ageing (McDonald and Kippen, 1999, p 11). Over the coming decade, the growth in the working age population is largely predetermined because it reflects fertility decisions that were taken between five to fifteen years ago.
The projected decline in the growth in the working age population is relatively invariant to small changes in net overseas migration around the assumed level of 90,000 per annum. For example, each additional 20,000 immigrants adds only around 0.1 percentage points to projected annual growth in the working age population. The projected ageing of the working age population is also relatively invariant to small changes in net overseas migration (McDonald and Kippen, 1999, p 16).
2. Growth in the participation rate
Recent trends in the participation rate
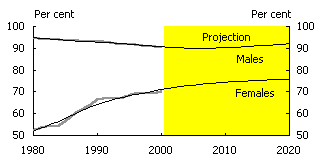
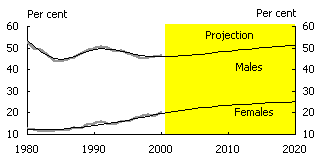
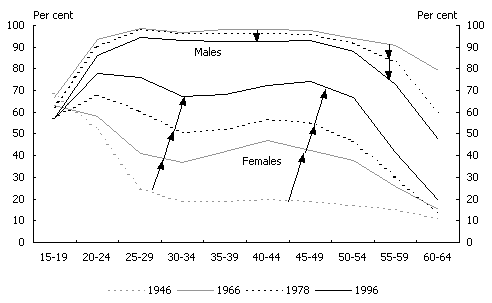
Over the past three decades Australia has seen major changes in the working patterns of both males and females. The total participation rate4 has been rising, with increasing female participation partially offset by falling male participation, particular
ly for those aged over 45 (Chart 3).
Chart 3: Participation rates by age and gender
Source: ABS cat. nos. 6204.0 and 6203.0.
There appear to be a number of key social and economic trends underlying the observed longer run labour force participation patterns, reflecting fundamental labour supply and demand pressures in the economy (Bacon, 1999). There has been an increase in the number of women returning to the workforce after child bearing, supported by greater access to child care and changes in social attitudes towards women with children working. In addition, the trend towards smaller families and an increase in the number of women not having children has led to higher levels of workforce participation by women.
At the same time, the growth in employment opportunities in the traditionally female dominated industries (service-related industries), and decline in traditionally male dominated industries (manufacturing, utilities and mining), has coincided with greater participation of women in the workforce and reduced participation of men. The shift towards part time and casual paid employment opportunities has also encouraged many women into the workforce because it better suits their lifestyle requirements. Clearly these factors are not independent but reflect an underlying social trend towards greater female participation in the work force, which appears to be producing a convergence of male and female participation rates (Chart 3).
There has also been a trend towards early retirement, where men who would have retired at the pension age in the past, are now retiring earlier. Almost all of this major shift towards early retirement occurred between 1973 and 1982. In recent years this trend appears to have stabilised.
The impact on the total participation rate of population ageing
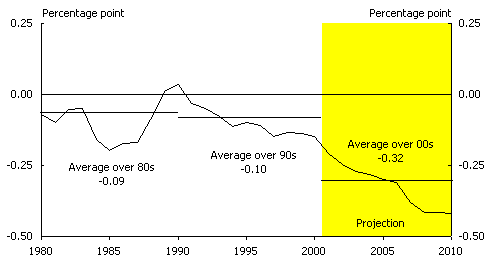
The age-structure of the population can influence the total participation rate since participation rates vary markedly between different age groups. As the proportion of the population in the various age groups changes over time, all other things being equal, the total participation rate will change. Chart 4 shows the impact of the changing age-structure of the population on the growth in the total participation rate over recent decades, and the likely impact over the coming decade, all other factors unchanged5.
The changing age-structure of the population, with individual (within age-group) participation rates held steady, has placed downward pressure on the total participation rate over the last two decades as the population has aged - subtracting around 0.1 percentage points per annum from growth in the total participation rate. The ageing of the population primarily reflects rising life expectancy which has increased the proportion of the population in the (low participation) 65-and-over age group. This has more than offset the positive effect on the participation rate of the `baby boom' generation moving into the `peak' participation age groups (between 20 to 54).
Chart 4: Impact of the ageing of the working age population
on the growth in the participation rate
Source: Treasury estimates.
This downward pressure from the ageing of the population is expected to intensify over the coming decade, as the `baby boom' generation moves into the lower participation `early retirement' age group, and life expectancy continues to increase. Changes in the age-structure of the population are projected to subtract an average 0.3 percentage points per annum from growth in the total participation rate over the coming decade - around three times larger than the average annual impact over the previous two decades.
Future trends in the participation rate
While the ageing of the working age population is expected to continue to exert negative pressure on the participation rate over the coming decade and beyond, changes in the total participation rate will also reflect social and economic trends in individual (within age-group) participation rates.
Chart 5: Selected age specific labour force participation rates
|
25-54 year age group |
|
65-69 year age group |
|
|
55-59 year age group |
|
70+ |
|
|
60-64 year age group |
|
Total |
|
|
Source: ABS cat. no. 6203.0 and Treasury estimates |
|
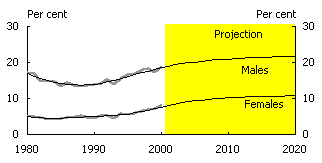
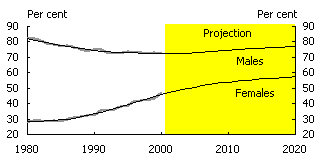
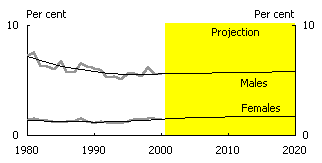
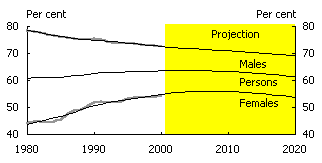
Projections of individual participation rates allow for a continuation of the increasing trends in female participation rates witnessed over the last three decades (Chart 5). The projections incorporate a modest recovery in the participation rates of males aged between 25-54, against recent historical trends. They also allow for an increase in the participation rate of persons aged 55 and over (discussed in more detail, below). These projections result in a further narrowing of the gap between male and female participation rates (Bacon, 1999).
On the basis of these projections, the total participation rate could begin to fall by around the middle of the decade, reflecting the acceleration of the negative influence on the participation rate from the ageing of the population6. The total participation rate is projected to rise during the first half of the coming decade, but then fall in the second half (Chart 5). By the end of the coming decade, the total participation rate is projected to fall by around 0.2 per cent per annum.
Chart 6: Growth in working age population and labour force7
Source: ABS cat. no. 3201.0 and Treasury estimates.
Over the past two decades the average growth in the labour force has exceeded the growth in the working age population, reflecting growth in
the total participation rate. However, on the basis of these projections, labour force growth could fall below the already falling growth in population from the early part of the decade (see Chart 6).
Uncertainties around the participation rate projections
Clearly, these projections are only one of a range of possible scenarios and it is important to remember that they are based on an assumption of no policy change. For example, changes to the structure of child care, welfare or pension arrangements would all be expected to impact on labour force participation decisions. The key uncertainty in the labour force projections is the response of the various age and gender cohorts to the changing labour environment. In particular, as these projections reflect recent social and economic trends, the key uncertainty relates to the possibility of new trends emerging in the labour market in the coming decade.
For example, in response to the slowdown in the growth of the working age population, business may introduce incentives to retain existing workers, encourage them to increase the number of hours they work or defer their retirement, and to attract additional workers into the labour force. These incentives could take the form of higher real wages or other non-pecuniary benefits such as the opportunity to work from home, part time hours for those full time workers considering retirement, or more generous maternity leave arrangements. A modest allowance for these factors has been built into the projections of individual participation rates (Chart 5).
Moreover, the `baby boom' generation may retain a greater attachment to the workforce than previous cohorts, as they move into the `early retirement' cohorts over the coming decade. The importance of this issue is underscored by the OECD's observation that the economic effects of population ageing would be greatly diminished `if it were possible to increase labour force participation rates amongst persons aged 55 and over to the levels of the 1960s' (OECD, 1999, p 135).
Most males (over 60 per cent) who retire early (ie, before age pension age of 65) do so involuntarily (ABS, 1997), with the main reasons given for early retirement being ill health, injury or retrenchment. Further, the decline in workforce participation between age 55 and 64 is significantly greater for those without tertiary education (OECD, 1999, p 139). As `baby boom' males have a higher level of educational attainment than previous generations, they may experience a lower level of involuntary early retirement than previous generations. Indeed, the relative stability (following a period of steady decline) over recent years in the participation rate of males aged between 55 and 64 may reflect the emergence of this effect.
It seems likely that, as `baby boom' females have maintained a higher level of workforce attachment during their `peak working years', they are likely to maintain a greater connection to the workforce than their predecessors in the `early retirement' age groups.
Nevertheless, there remains considerable uncertainty as to how both male and female `baby boomers' will approach the `early retirement' decision. On the one hand, they may place a greater value on leisure in retirement than previous generations, resulting in an increase in voluntary early retirement. On the other hand, recent measures aimed at removing incentives for early retirement8 could see a decrease in voluntary early retirement. On balance, the projections allow for an some additional increase in the participation rates of persons aged 55 and over (Chart 5).
While future trends in participation rates are very uncertain, it is clear that very large changes in current work preferences would be required to have any significant impact on the projected slow down in labour force growth over the coming decade and beyond.
3. Changes in the the unemployment rate
The extent to which employment growth can (sustainably) outstrip labour force growth over a period depends on the scope for the unemployment rate to fall below its present level without initiating inflationary pressures.
The measurement of the structural rate of unemployment is difficult. The relationship between unemployment, wages and inflation is complex and changing over time. Inflation, for example, may rise for reasons other than generalised wage increases. Firms may be in a position to exercise greater pricing power, at least in the non-tradeable goods sector, in buoyant demand conditions, or in response to rising import prices. Prima facie evidence of a structural problem in the labour market exists, however, if, for firms generally, wage increases exceed the net effect of productivity growth and price rises (ie, real unit labour costs rise) at high rates of unemployment, reducing incentives to increase employment and investment.
Conceptual difficulties also arise as unemployment may be falling at a pace such as to influence the wage claims and outcomes of those already in employment, even though the unemployment rate is above what might otherwise be considered its structural level.
The current unemployment rate is at the high end of the range of some recent estimates of the structural rate of unemployment. For example, Gruen, Pagan and Thompson (1999) estimated the structural rate of unemployment to be between 5 and 7 per cent through the 1980s and 1990s, while the structural unemployment rate derived from the latest version of the Treasury Macroeconomic (TRYM) model is below 6 per cent9. However, such estimates are historical and do not include an explicit allowance for the likely beneficial effects on structural unemployment of recent reforms to product and labour markets. Some of these benefits are likely to be still accruing.
In short, there seems to be scope for the unemployment rate to fall below its present level of around 6 per cent over the coming decade without initiating inflationary pressures. In preparing the employment growth projections in this paper, it is assumed that the unemployment rate will decline to an assumed structural rate of 5 per cent by around the middle of the coming decade. The potential for further falls in unemployment will depend, in part, on the extent of further labour market reform, social security reform and microeconomic reform more generally. However, these projections are based on an assumption of no policy change.
4. Growth in productivity
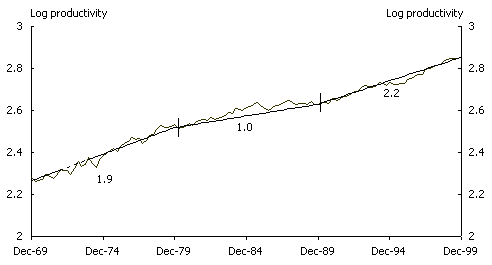
While the main focus in this article is the impact of emerging demographic trends on workforce growth, overall economic growth in the decades ahead will also be influenced by trends in productivity growth. Over the last three decades, productivity growth, defined as growth in GDP per employed person, averaged around 1.7 per cent per annum (Chart 7). In the 1990s productivity growth averaged 2.2 per cent per annum, a rate of growth which is high by historical and international standards.
Chart 7: Labour productivity
Source: Modellers' Database, ABS cat. no. 1364.0.15.003.
A sectoral analysis of productivity trends in the 1990s is provided in Table 1. Growth in productivity in the private business sector was strong in the 1990s by historical standards, and provided the major contribution to growth in total productivity. Across industries in the private business sector the growth was broadly based, with the strongest growth in mining, manufacturing and distributional services (retail and wholesale trade and transport services). Distributional services and manufacturing made the largest contribution to overall productivity growth (Chart 8).
A large share of this productivity growth can be attributed to the widespread structural reform that commenced in the mid-1980s and still continues. In particular, trad
e barriers were lowered, financial markets were liberalised, and enterprise bargaining improved labour market flexibility. Bean (2000) and Forsyth (2000) note that both the magnitude and timing of Australia's improved productivity performance are consistent with it being primarily driven by microeconomic reform.
Growth in productivity in the private business sector has been affected by a number of other factors in the 1990s. For example, the cyclical lag10 between changes in GDP and employment growth was particularly strong over the last few years, and is likely to have been exacerbated by the uncertainty caused by the Asian crisis, which may have led to firms delaying the hiring of new employees. Moreover, growth in productivity in the private business sector was boosted by capital-labour substitution11 reflecting falling investment prices - in particular, the prices of computer hardware and software.
Table 1: Productivity growth by sector

Source: Modellers' Database, ABS cat. no. 1364.0.15.003
A feature of the sectoral analysis of productivity trends in the 1990s is that productivity growth in the public enterprise sector has been much higher than in the private business sector. Productivity in the public enterprise sector grew by an average 10.4 per cent per annum in the 1990s, compared with 2 per cent in the private business sector. Underpinning growth in productivity in the public enterprise sector12 were communication services and electricity gas and water (utilities), which were two of the stronger performing industries over the 1990s (Chart 8). There has been substantial microeconomic reform in these industries over the last two decades (OECD, 2000, pp 111-119) - in particular, National Competition Policy - and they are dominated by enterprise bargaining.
Chart 8: Labour productivity growth in the 1990s13
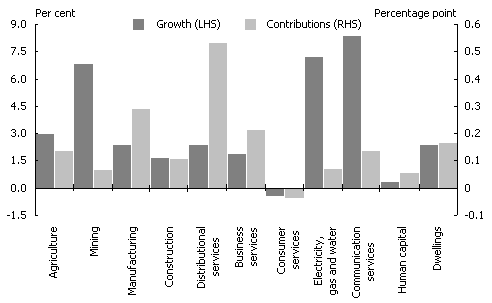
Source: Modellers' Database, ABS cat. no. 1364.0.15.003
Over the coming decade, the growth in productivity is expected to be strong in both the private business and public enterprise sectors. In part, this reflects the likelihood that productivity gains from microeconomic reforms are still working their way through the system. In addition, other reforms have only recently, or are in the process of, being legislated or brought into effect14.
Productivity in the private business sector is also likely to be supported by a further strong contribution from capital-labour substitution reflecting, among other things, a projected ongoing falling trend in investment prices, as well as the beneficial impact on these prices of The New Tax System15.
However, despite ongoing strong growth, the public enterprise sector may make a smaller contribution to growth in total labour productivity in the coming decade as the proportion of employment in the sector falls16. In addition, the dwelling sector may also make a smaller contribution to growth in total labour productivity as dwelling investment slows, in line with the projected slowing in the growth of the underlying demand for housing17 (OECD, 1999, p 115).
A key uncertainty in productivity growth over the coming decade relates to the potential impact of developments in, and rapid take up of, information and communication technology (ICT). One identifiable impact of ICT on productivity growth over the 1990s flowed from its rapid take-up (that is, capital-labour substitution), as a result of falling computer hardware and software prices. As discussed, this is expected to continue over the coming decade. In addition, there is the further question of whether the use of ICT has made, or will make, a contribution to multi-factor productivity (for example, by reducing business-to-business and business-to-consumer costs).
Much attention has been paid recently to the pick-up in productivity growth in the US in the 1990s and its possible links to ICT. Early studies argued that most of this pick-up in productivity growth reflected technological improvements in the production of computers (Gordon, 1999). However, more recent studies provide evidence that the gains from these improvements are accruing more widely (rather than solely to producers of computers in the form of monopoly rents) (Oliner and Sichel, 2000 and Jorgenson and Stiroh, 2000).
It is now widely accepted that in the longer run it is the take-up and use of ICT that are the key drivers of productivity gains - rather than its production. Australia performs very well in the adoption and application of new technologies. For example, Australian e-commerce readiness is among the highest in the world and only a little behind the US - whether measured by PCs per household, installed computers per thousand inhabitants, secure servers per thousand inhabitants, or internet connections and use. To the extent that growth in multi-factor productivity outside the computer manufacturing sector in the US reflects the use of ICT, there is the potential for stronger growth in multi-factor productivity in Australia (that is, `catch-up').
Some possible implications for longer term economic growth
While outcomes so far into the future are highly uncertain, it is interesting to consider some possible implications of the projections and assumptions for longer term economic growth.
As outlined above, on a no policy change basis, annual growth in the labour force at the end of the decade could be around 0.4 percentage points slower than its average annual growth rate over the 1990s, and significantly below the growth rates of earlier decades. With the unemployment rate assumed to stabilise at around 5 per cent by the middle of the decade, annual employment growth could be around 0.3 percentage points per annum slower than its average annual growth rate over the 1990s.
Table 2: Growth in GDP and GDP per capita
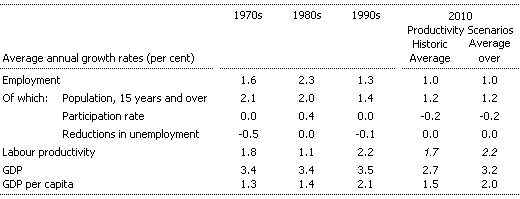
Source: ABS cat. no. 5206.0, Modellers' Database, ABS cat. no. 1364.0.15.003 and Treasury estimates.
To illustrate the possible implications of these projections for longer term economic growth, if productivity were to grow at its long run average rate (thirty years) of 1.7 per cent, these projections suggest GDP would grow by around 2.7 per cent per annum by the end of the decade. Alternatively, if productivity were to grow at the average rate seen during the 1990s of 2.2 per cent, GDP would grow by around 3.2 per cent per annum by the end of the decade.
These illustrative scenarios for economic growth are obviously below recent outcomes. However, since the slowdown in growth in GDP is driven essentially by demographic factors, including slower growth in the total population and the ageing of the workforce, growth in GDP per capita - which is a more appropriate indicator of the growth in living standards - is not expected to decline to the same extent, if at all. As an illustrative example, if productivity grows at the average rate seen during the 1990s, growth in GDP per capita could fall marginally below rates achieved in that decade, but would remain above rates achieved in the 1970s and 1980s. If the growth in productivity exceeds the average rate reached in the 1990s, growth in GDP per capita need not fall at all in the coming decade.
International comparisons
Over the longer term, all OECD countries are expected to experience similar
downward pressure on the growth rate of the labour force and, in turn, trend economic growth, as a result of declining fertility rates and an ageing population. On the illustrative estimates presented above, Australia would remain amongst the top of the league growth table because it will have one of the highest population growth rates. Table 3 lists some recent studies for a selection of OECD countries.
Table 3: Real GDP projections - selected countries

1 US Council of Economic Advisers, 2000.
2 HM Treasury, 2000.
3 NZ Treasury, Budget 2000.
4 King and Jackson, 2000 (Finance Canada).
5 Japan Centre of Economic Research, 1999.
Conclusion
Demographic projections point to Australia's population growth slowing over the next 50 years and, in turn, the population ageing. Under these circumstances, it is likely that the growth in the labour force will decline, perhaps significantly. It is possible that the average annual rate of growth in the workforce towards the end of the coming decade could be around 1 per cent, or around 0.4 percentage points below that in the 1990s, and could be negative by the middle of the century. The key uncertainty in these labour force projections is the likely participation responses of the various age and gender cohorts to the changing labour environment, particularly amongst older workers. While outcomes so far into the future are highly uncertain, these emerging trends in the labour force suggest a possibility that Australia's trend GDP growth could be lower over the coming decade than during the 1990s. However, growth in GDP per capita is not expected to decline to the same extent, if at all.
References
Australian Bureau of Statistics, November 1997, Cat. No. 6238.0, Retirement and Retirement Intentions, Australia.
Bacon, Bruce (1999). Ageing in Australia: Some Results and Research Issues, in Policy Implications of the Ageing of Australia's Population, Productivity Commission, Melbourne, 18-19 July 1999.
Bacon, Bruce (2000). Projecting the Decline in Fertility, Paper presented at Workshop on Declining Fertility in Australia: Policy and Research Issues, Australian Institute of Family Studies, Melbourne, 30 May 2000.
Bean, C. (2000). The Australian Economic Miracle: A View From The North, in
The Australian Economy in the 1990s, Reserve Bank of Australia, July 2000.
Forsyth, P. (2000). Microeconomic Policies and Structural Change, in
The Australian Economy in the 1990s, Reserve Bank of Australia, July 2000.
Council of Economic Advisers (2000). Economic Report of the President,
February 2000.
DEWSBR (2000). Safety Net Review - Wages November 1999 - March 2000, Attachment 1, Appendix F, Department of Employment, Workplace Relations and Small Business, pp 453-455.
Downes, Peter. and Bernie, Kris (1999). The Macroeconomics of Unemployment in the Treasury Macroeconomic (TRYM) Model, TRYM Related Paper No 20, (www.treasury.gov.au).
Gordon, Robert J. (1999). Has the `New Economy' Rendered the Productivity Slowdown Obsolete, Northwestern University June 1999.
Gruen, David, Pagan, Adrian and Thompson, Christopher (1999). The Phillips Curve in Australia, Journal of Monetary Economics, 44, pp. 235-58.
HM Treasury (2000), Budget, March 2000
Japan Centre of Economic Research (1999), The Japanese Economy in 2025, Feb 1999
Jorgenson Dale W. and Stiroh Kevin J. (2000), Raising the Speed Limit:
US Economic Growth in the Information Age, Brookings Papers on Economic Activity, 2000, Vol 1.
King, Phillip. and Jackson, Harriet. (2000), Public Finance Implications of Population Ageing, Working Paper 2000-08, Department of Finance, Canada.
McDonald, Peter. and Kippen, Rebecca. (1999), The Impact of Immigration on the Ageing of Australia's Population, Discussion Paper, Department of Immigration and Multicultural Affairs, May 1999.
Oliner, Stephen D. and Sichel, Daniel E. (2000), The Resurgence of Growth in the Late 1990s: Is Information Technology the Story?, US Federal Reserve Board Staff Working Paper, May 2000.
New Zealand Treasury (2000), Fiscal Strategy Report, Budget 2000.
OECD, Economic Survey of Australia, 1998-99.
OECD, Economic Survey of Australia, 1999-00.
2 In those years where net overseas migration fell, the subtraction from population growth has been shaded white. The natural increase in the population equals the number of births less the number of deaths.
3 The total fertility rate measures the number of children one woman would bear in her lifetime if she experienced current age-specific fertility rates at each age of her reproductive life.
4 The total participation rate is defined as the number of persons in the labour force as a percentage of the working age population.
5 The estimates of the ageing effect are constructed by holding the participation rate of each age-group constant at the level in the previous year, while changing the age-composition of the working age population in line with actual and projected outcomes.
6 The total participation rate in Chart 5 reflects both social and economic trends in individual participation rates, as well as the negative influence of the ageing of the working age population. To emphasise the interaction of trends in individual participation rates and the ageing effect, note that even though female participation rates are projected to rise in all age groups (Chart 5), the total female participation rate is projected to fall by the end of the decade because of the ageing of the female working age population.
8 For example, in July 1998 the Government introduced a bonus scheme to persons who remain in employment and defer taking up the pension. The Government also introduced legislation so that all contributions and earnings accruing from 1 July 1999 will have to be retained in the superannuation system at least until preservation age.
9 For further discussion of the modelling of the structural unemployment rate in the TRYM model see Bernie, Kris. and Downes, Peter. 1999.
10 Since capital and labour inputs tend to be used more intensively during expansions than contractions, productivity growth rates measured within business cycles may be biased. As each of the last three decades has contained a recession, measuring labour productivity growth rates over these decades should broadly control for these cyclical effects.
11 Growth in labour productivity can be decomposed into a contribution from `capital deepening' - or growth in the capital-labour ratio - and from growth in `multi -factor' productivity - measured as a residual and attributable to influences other than increases in the quantity and quality of labour and capital.
12 The public enterprise sector comprises electricity, gas and water, communications and parts of transport and some other industries.
13 Certain industries have been consolidated: business services includes finance and insurance and property and business services; con
sumer services includes recreation, accommodation and personal services; distributional services includes wholesale trade, retail trade and transport and storage and human capital includes education, health and government administration.
15 To the extent that the slow down in the growth of the labour force leads to an increase in real wages, there is likely to be additional capital-labour substitution.
16 The contribution of productivity growth in an industry to total productivity growth is determined by that industry's share of total employment. An industry experiencing strong productivity growth may also show a declining share of total employment (for example, due to capital-labour substitution) that is sufficient to reduce its contribution to total labour productivity.
17 Over the coming decade, as projected growth across the 25-34 age group (traditionally considered to be the key household forming age group) slows, and the baby boomers move into their retirement years (and therefore require less housing services), underlying demand for housing is projected to slow.

