Alternative approaches to constructing a SNA 93 consistent measure of gross private saving
The ABS does not currently publish a measure of overall private saving. Rather, it publishes separate income and capital accounts for the household (including non-profit institutions serving households and unincorporated enterprises) and the non-financial private corporations sectors. Under current international standards (known as SNA93), the ABS also publishes a capital account for the aggregate financial corporation sector. To construct an overall measure of private saving, this financial corporation saving needs to be allocated between the public and private sectors and added to the saving by the household and non-financial private corporation sectors. Another difficulty with deriving a consistent measure of private saving over time is that, at present, the ABS has only recalculated the income and capital accounts for the public and private non-financial corporation sectors back to 1989-90. The remainder of this Appendix discusses three alternative approaches for trying to overcome these problems.
These approaches make use of the fact that, prior to the adoption of the current international standards (SNA93), the ABS separately identified the public and private components of the financial corporation sector. These data are available from 1969-70 to 1996-97 and was prepared on the basis of the previous international standard known as SNA68. However, this data are not directly comparable with that which has been prepared on an SNA93 basis. Not least of these difficulties are the differences in the asset boundary between the two standards. Another complication is the reclassification of the state government central borrowing authorities from the general government sector under SNA68 to the financial corporation sector under SNA93.
Approach 1: Split SNA 93 National Saving using SNA 68 private and public splits
This approach to constructing SNA 93 consistent measures of private and public saving uses the split between the two saving measures already available under the SNA 68 standard. This approach involves taking the ratio of private saving to national saving under the SNA 68 and multiplying this by national saving on an SNA 93 basis. The same is then also done for public saving (or alternatively it can be derived as a residual of the other two). This means that the total of the public and private saving measures calculated is consistent with the SNA 93 calculation of national saving.
A limitation of this approach is that it does not capture some differences in the classification and definition of the components of public and private saving in the SNA 68 and SNA 93 methodologies. In particular, it is unclear whether the difference between national saving on an SNA 68 and an SNA 93 basis has been allocated correctly since the approach ignores information on the allocation of this difference between the general government, non financial public, non financial private and household sectors. For example, the new treatment of unfunded superannuation for general government employees under SNA 93 will have had a significant impact on the saving of the general government and household sectors.
A second limitation of this approach is that SNA 68 data are only available up to 1996-97. As a result, it has been assumed that the split between public and private saving in 1997-98 and 1998-99 is the same as in 1996-97.
The main strengths of this approach are that it is simple to calculate and that its limitations are relatively transparent.
Approach 2: Use SNA 93 data when available, and use SNA 68 data when they are not
An alternative approach to the construction of private and public saving would be to use SNA 93 data to the extent they are available and use SNA 68 data when they are not.
Under the SNA93 standard, data are available for household and general government saving back to 1959-60. Data are also available for non-financial corporation saving (broken down between the public and private sectors) from 1989-90 to 1997-98. To construct a public and private saving measure, financial corporations can be split between public and private using SNA68 data going back to 1959-60. This allows public and private saving to be calculated from the bottom up, adding each of the components, from 1989-90 to 1996-97. Non-financial corporations can then be split between public and private from 1959-60 to 1989-90 using SNA68 data, and then spliced onto the SNA93 series. It is necessary to assume that the split between public and private financial corporations remains the same in 1997-98 and 1998-99 as it was in 1996-97 and the split between public and private non-financial corporations is the same in 1998-99 as in 1997-98.
This approach has the limitation of being more complex than Approach 1. As it uses both SNA 93 and SNA 68 data to construct private saving, there is a greater prospect of it being affected by classification and definitional difference between these methodologies.
Approach 3: Use SNA 93 data on saving when available, and the relationship between net lending, saving and investment when it is not
Another approach to calculating private saving is through the relationship between public, private and national net lending, saving and investment. Public saving is calculated first, with private saving the residual from national saving.
Public net lending (or the PSBR) is required to calculate the level of public saving and hence private saving. General government net lending is available on a SNA 93 basis and is used directly (as is the case in Approach 2, where general government saving was able to be used directly). Public non-financial net lending is available from 1989-90 to 1997-98 on a SNA 93 basis. Over this period it again is used directly. Prior to 1989-90, public non-financial net lending is sourced from the RBA Australian economic statistics (on an SNA 68 basis). Public financial net lending is imputed, as the residual of total financial net lending (which is published on an SNA 93 basis) and private financial net lending (which is published on an SNA 68 basis up to 1996-97). It is assumed that subsequent to 1996-97 public financial net lending is zero, as all excess funds are distributed to the general government sector.
With public net lending (calculated as the sum of the three components above), public saving is calculated as public net lending plus public investment (available on a SNA 93 basis). Private saving is derived as national saving (available on a SNA 93 basis) less the calculated level of public saving.
Which approach is preferable?
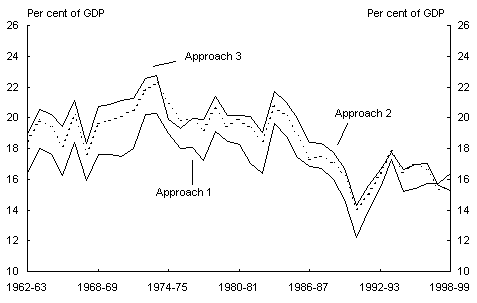
There are reasonable grounds for adopting each of these approaches to constructing a SNA 93 private saving measure would be acceptable. Indeed, as shown in Chart 14, they follow a similar trend over time. In this paper, Approach 2 is adopted. Although more complex than Approach 1, it is considered to be more likely to provide an accurate reflection of the private saving as measured by the SNA93 national accounts. Although Approach 3 may prove to be superior in time, further work is required to test the validity of assumptions underpinning its construction.
Short of the ideal solution to this dilemma ie, the publication of a national accounts consistent measure of private saving by the ABS analyses of private saving in Australia should be cognisant of the fact that there are several approaches to the measurement of this measure.
Chart 14: Comparison of measures of private saving

Source: ABS Cat. No. 5204.0, 5206.0 and Treasury estimates.
Appendix B
Construction and components of the net private saving measure
To assist international comparisons, the analysis in the body of this paper focuses on gross, rather than net, measures of private saving derived from the National Accounts. However, as noted in the paper, when properly measured the net measure of saving is more conceptually correct. The purpose of this Appendix is to outline how net private saving measure can be derived from the national accounts and to show the effect of using net rather than gross private saving on the components of private saving.
How is net private saving calculated?
Net private saving is defined as gross private saving less private sector depreciation. Appendix A outlines how gross private saving is constructed. A similar methodology is employed in calculating SNA 93 consistent measure of private sector depreciation (and thus net private saving).
The ABS does not publish a SNA 93 consistent measure of depreciation for the private sector as a whole, although it does publish depreciation for the economy as a whole. However, prior to the adoption of the current international standards (SNA93), the ABS separately identified the public and private components of depreciation in the annual national accounts. As with gross private saving, this data are available from 1969-70 to 1996-97 and was prepared on the basis of the previous international standard, SNA 68.
This approach to constructing SNA 93 consistent measures of private and public depreciation uses the split between the two saving measures already available under the SNA 68 standard. This approach involves taking the ratio of private depreciation to national depreciation under the SNA 68 and multiplying this by national saving on an SNA 93 basis. The same is then also done for public depreciation (or alternatively it can be derived as a residual of the other two). This means that the total of the public and private saving measures calculated is consistent with the SNA 93 calculation of national saving.
The resultant private sector depreciation is subtracted from gross private saving determined under Approach 1 of Appendix A to arrive at net private saving.
A limitation of this approach is that it does not capture some differences in the classification and definition of the components of public and private depreciation in the SNA 68 and SNA 93 methodologies. In particular, there were significant changes to the calculation of depreciation in the move to the SNA 93 basis that could have affected the public/private mix of total depreciation.
Components of net private saving
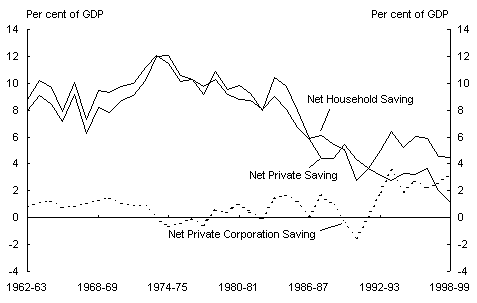
Chart 15 illustrates the components of net private saving as a percentage of GDP. Over the 1960s net private saving averaged around 9 per cent of GDP, reflecting a similar level of net household saving and slightly negative net saving by private corporations. Although net household saving increased considerably in the 1970s, this was largely offset by an increase in net dissaving by private corporations. By the start of the 1990s, a combination of lower net household saving as a percentage of GDP and higher net dissaving by private corporations as a percentage of GDP led to net private saving falling to around 3 per cent of GDP. Since then, net private saving has recovered to around 4 per cent of GDP, with a continued decline in net household saving as a percentage of GDP being more than offset by a significant turnaround in net saving by private corporations.
Chart 15: Components of net private saving

Source: ABS Cat. No. 5204.0, 5206.0 and Treasury estimates.
Net private saving international comparison
As noted in the paper, international comparison of net saving measures is complicated by the significant variation in depreciation calculation methods across countries. Nevertheless, for completeness this section compares these measures across the countries considered in the body of the paper.
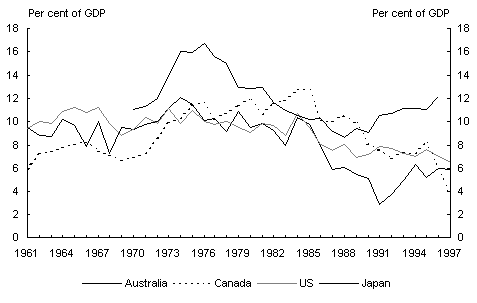
The trend in net private saving rate in Australia has been broadly similar to that experienced in some other developed countries (see Chart 16). In the United States the net private saving averaged around 10 per cent of GDP from the 1960s to the mid-1980s, before falling to around 7 per cent of GDP since then. Net private saving in Canada was around 6 per cent of GDP at the start of the 1960s before increasing to around 12 per cent of GDP in the mid-1980s. Since then the Canadian net private saving rate has fallen back to around 4 per cent of GDP. Net private saving in Japan rose from slightly above the rate of the United States, Canada and Australia at the start of the 1970s to peak above 16 per cent of GDP in the mid-1970s. In the 1980s Japans net private saving rate was similar to that of the United States and Canada. Since then, Japans net private saving rate has risen to around 12 per cent of GDP at present, significantly above the rate in Australia, Canada and the United States.
Chart 16: Net private saving international comparison

Source: OECD Annual National Accounts and Treasury estimates.