Jyothi Gali and Bruce Taplin1
In the context of public discussion about the advantages and disadvantages of foreign investment, this article looks at the macroeconomic effects of reducing capital inflows into Australia.
Executive summary
As a resource rich economy with a relatively high demand for capital, Australia has had more abundant investment opportunities than were fully financed by Australians. This has led to capital inflow that has built up capital, incomes and wages — and also net foreign liabilities. Most of those are foreign debt rather than foreign equity.
A hypothetical policy is considered to reduce capital inflow by restricting investment. Lower investment will lower production and income in Australia. Lower capital inflow, over time, would reduce net foreign liabilities. Modelling using the Monash Multi Regional Forecasting (MMRF) model quantifies these two effects. The reduction in income from lower production is found to be only partially offset by the increase in income arising from lower net foreign liabilities. For example, a reduction of capital inflow and investment of 1 per cent of GDP will reduce gross national income by about half a per cent each year in the first decade relative to baseline.
Other things being equal, restrictions on capital inflow (including foreign investment) would reduce Australian investment, production and incomes. In turn, this would reduce the wellbeing of Australians.
Introduction
Australia has a long history of capital inflow, which is foreign funding of investment in Australia, either by lending to Australians or directly investing in Australian enterprises.2 Australia has had more abundant investment opportunities than were funded from the limited domestic saving of a small population. It has relied on foreign funds to finance the shortfall between national investment and national saving for all of the last three decades and for most of its history before that.
Capital inflow has helped to build the stock of productive capital and increase living standards, which have enhanced the wellbeing of Australians. Other benefits of capital inflow could also occur through better access to international markets and greater transfers of skills and ideas from overseas, though these issues are not explored in this article. However, capital inflow has also resulted in an accumulation of net foreign liabilities. Whether this is foreign debt or foreigners’ ownership of assets in Australia, this has sometimes caused community sensitivity and concern. Foreign debt has different characteristics from foreign equity, largely concerning who bears risks and what returns are received in compensation. Restricting one particular type of capital inflow may just shift capital inflow to a different type of inflow.
This article explores the economic consequences of capital inflow by analysing the effects on net foreign liabilities, income and the macroeconomy of a sudden and ongoing reduction in capital inflow arising from lower investment. Unless otherwise specified, in this article no distinction is made between debt and equity. Even if the restriction applied to only part of capital inflow, such as direct investment, it could still reduce total capital inflow. In this case, the results in this article still apply because a reduction in capital inflow must occur with a reduction in investment if saving is unchanged. If the restriction does not reduce total capital inflow then it must change only its composition and the policy would have been ineffective in changing the level of net foreign liabilities.
The first part of this article looks at the history of Australia’s capital inflow and net foreign liabilities, including their components. The second part looks at Australia’s imbalance between saving and investment in recent decades. The third part has a comparative static analysis of the consequences of lower investment and capital inflow. The fourth part presents some modelling results from a reduction in capital inflow using the Monash Multi Regional Forecasting (MMRF) model of the Australian economy. The technical appendix provides a detailed explanation for these results.
Capital inflow into Australia
Net capital inflow into Australia represents net new investment made by foreigners in Australia. This is the amount invested by foreigners in Australia, less the amount that Australians invested overseas. It comprises both debt and equity.
By definition (and abstracting from measurement difficulties), capital inflow also equals Australia’s current account deficit (CAD). The value of Australian imports and other current payments to foreigners may be larger than the value of Australian exports and other current receipts from foreigners, which results in a CAD. The CAD must be funded through capital inflow (abstracting from changes in official reserve assets).3
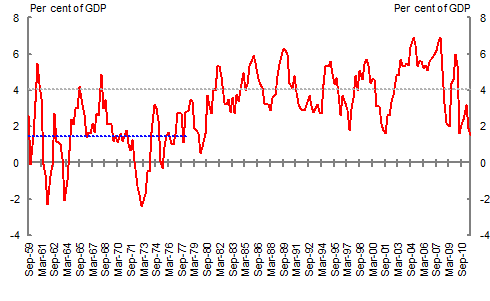
Capital inflow in Australia has fluctuated in the last five decades, averaging about 4 per cent of GDP since the early 1980s, having risen from lower average levels in the 1960s and 1970s (Chart 1).
Chart 1: Capital inflow into Australia
Source: ABS (2011a) Cat No.5302.0 Table 35, Quarterly data, Current Account Deficit to GDP ratio.
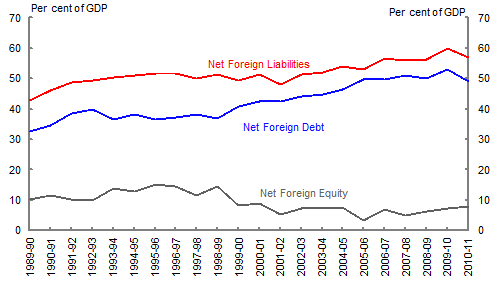
Capital inflow accumulates into the stock of net foreign liabilities (Chart 2), which is defined as Australia’s gross foreign liabilities less gross foreign assets. This is also referred to as the ‘international investment position’. Valuation changes arising from asset price and exchange rate movements also affect the value of net foreign liabilities. Australia’s net foreign liabilities have risen, from just above 40 per cent of GDP in 1989-90 to nearly 60 per cent of GDP in 2010-11.
These net foreign liabilities comprise two different parts. Net foreign debt reflects the total debt liabilities of Australian residents to foreigners minus the debt liabilities of foreign residents to Australian residents. Net foreign equity reflects the total value of Australian equity assets owned by foreign residents minus the total value of overseas equity assets owned by Australian residents.
Chart 2: Net foreign liabilities
Source: ABS (2011a) Cat No.5302.0 Table 85.
Net foreign liabilities are expected to earn returns that are sent back overseas. For debt, interest is paid and at the term of the debt the initial borrowed amount is repaid. For equities, dividends are paid (retained earnings increase expected future returns). Dividends and interest contribute to the CAD.
Australia’s net foreign debt grew from 33 per cent of GDP in 1988-90 to 50 per cent of GDP in 2010-11. Over the same period, Australia’s net foreign equity as a share of GDP declined from 10 per cent of GDP to 8 per cent.
Debt has different characteristics from equity. For example, equity holders bear a greater share in the risks of a project than holders of debt and therefore returns to equity are higher on average. Debt tends to be more liquid (the risk is borne by the borrower) and the returns are lower.
The levels and ratio of foreign debt and equity can have implications for Australia’s macroeconomic performance. One way is that if Australian investment is debt funded then it increases the gearing ratio of the Australian economy and increases risks to Australian business. In extreme cases, equity holders can e
arn nothing or face bankruptcy. Where foreign debt is denominated in foreign currency and not hedged then a fall in the Australian dollar raises the Australian dollar value of the debt and the interest costs.4
Australia’s national investment and saving gap
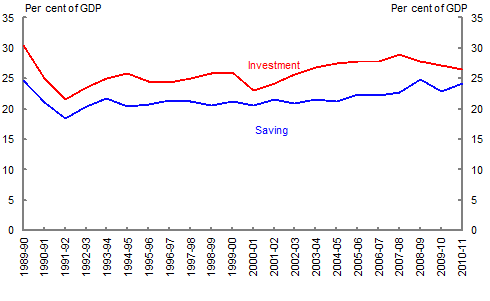
As a resource rich economy with a relatively high demand for capital, Australia has had more abundant investment opportunities than were fully financed by Australians (Chart 3). Consequently, foreign funds have financed the shortfall between investment and national saving for decades. This is the capital inflow described above.
Australia’s capital inflow reflects changes in both national saving and investment. National saving, at around 24 per cent of GDP in 2010-11, has been increasing in recent years. It is now above the average levels of national saving of the G7 group of countries, equal with Japan (the highest in G7) and well above the levels in the United Kingdom (13 per cent) and the United States (12 per cent) (IMF 2011, World Economic Outlook).5
Chart 3: Australia’s national investment and saving gap
Source: ABS (2011b) Cat No. 5206.0, Annual, Tables 43 and 65.
National investment, at around 27 per cent of GDP in 2010-11, has also been higher on average in the last decade. Australia’s national investment rate has averaged 27 per cent of GDP in the past decade, considerably higher than the average of 19 per cent of GDP for the G7 economies (IMF 2011, World Economic Outlook). This is higher than any G7 economy and one of the highest levels in OECD countries. The benefits of this investment are considered below.
Overall, the gap between national investment and saving has been around 4 per cent of GDP over the past three decades (Chart 1). In theory and abstracting from measurement difficulties, this is the capital inflow that represents how much foreign savings Australia uses to fund its investment.
Analysing a lower capital inflow
This section presents a comparative static analysis of the consequences of a lower level of capital inflow into Australia arising from lower investment. Assume that the amount of domestic saving in Australia is fixed (Qd) whereas any amount of foreign saving is available at a fixed rate of return (Rw) (Chart 4). Also assume that the demand for capital is a declining function of the rate of return (D) and that all foreign funding is by equity.
Chart 4: Impact of limiting capital inflow
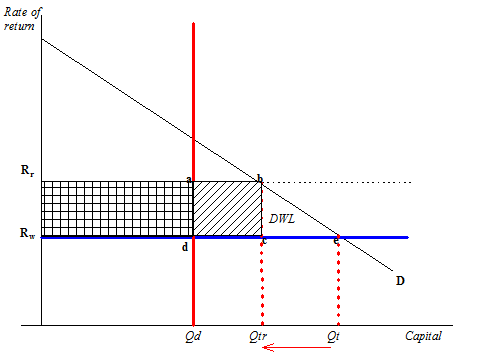
Without any restrictions on foreign capital, domestic funding will be supplied up to Qd at the world rate of return. Beyond that, capital inflow funds all investment between Qd and Qt.
With a restriction on capital inflow and investment, the amount of total investment falls to Qtr and the amount of foreign investment falls to the difference between Qd and Qtr. The lower level of capital drives up the rate of return from Rw to Rr.
The area ‘beQtQtr’ is a loss to Australian GDP. Firms would have liked to use foreign capital to produce output shown by D, but they are denied access to Australia. The triangle ‘bce’ is the loss to Australian gross national income (GNI) and welfare. The rectangle ‘ceQtQtr’ is the loss to Australian production that was produced by foreign owned capital.
The rectangle ‘abcd’ represents the increase in payments overseas on foreign owned capital. This arises because the foreign investors who remain enjoy an increase in their rate of return on capital. Previously, this income would have been paid as wages to Australians. While this is not a loss to GDP, it is a loss to GNI and welfare.
The triangle ‘bce’ and the rectangle ‘abcd’ represent the total loss to GNI and welfare. Other things being equal, they represent a clear loss to the wellbeing of Australians.
Note also that the rectangle ‘RradRw’represents a transfer of income from Australian wage earners to Australian capital owners. Previously, owners of capital had a rate of return Rw whereas now they have the higher rate Rr. These higher rates of return are at the expense of lower wage rates. This may also affect the wellbeing of Australians because of its distributional consequences.
Modelling a lower capital inflow
This section presents model simulation results for the Australian macroeconomy of a lower level of capital inflow into Australia arising from lower investment.
The precise mechanism that leads to this lower capital inflow is not explored in this paper. Instead, the outcomes from limiting capital inflow and investment are explored. (A change in domestic saving would also affect capital inflow, but would involve different policies, issues and outcomes, and is not considered in this article.)
All results are considered relative to a baseline where no limit or reduction in capital inflow is imposed. For example, an observation that investment is lower would mean that investment is lower than it was in the baseline, rather than that it was lower than in the previous year or that its growth rate was lower.
The model used was the Treasury version of the Monash Multi Regional Forecasting (MMRF) model.6 It models over fifty industries and goods and services, covers eight states and territories, and contains a full set of identities for goods markets, labour markets, international transactions and income flows. It also contains some simple assumptions for the behaviour of consumers, investors and government. It abstracts from the behaviour of financial markets, ignores some important distinctions between debt and equity financing and does not model interest rates or changes in inflation.
Since there is no specific policy proposal to restrict capital inflow, a lower level of capital inflow with a magnitude equal to 1 per cent of GDP is considered. That is about one quarter of the average net capital inflow during the last two or three decades and just over one tenth of average gross capital inflow. This amount is blocked but other factors may make an additional change to investment over time. This is explained in more detail in the technical appendix.
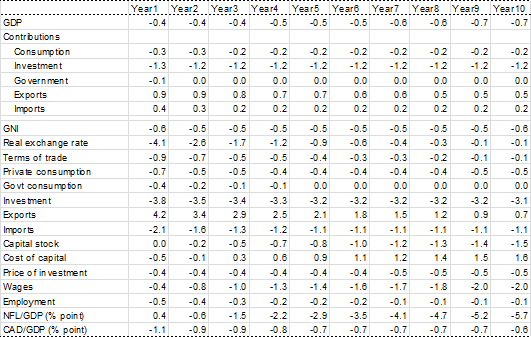
Key macroeconomic results of the modelling are reported in Table 1 for the first 10 years after the restriction commences. As described above, all results are the difference between this simulation and the baseline. For example, a result of 1 per cent means that something is 1 per cent higher than the baseline, not that it is 1 per cent higher than the previous year or that its growth rate is 1 percentage point higher.
Table 1: Macroeconomic effects of lower capital inflow by 1 per cent of GDP
Change from the baseline
Note: GDP contributions are percentage point contributions to GDP deviation from baseline. NFL and CAD as a share of GDP is the change in the ratio in percentage
points from baseline.
Source: Treasury estimates from MMRF model.
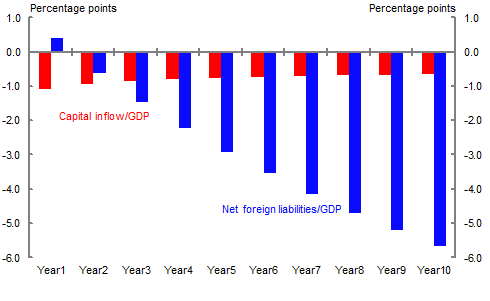
In this simulation, capital inflow is lower by design (Chart 5). This also leads to a reduction in net foreign liabilities over time. The exception is the first year, when net foreign liabilities rise because a lower exchange rate increases the Australian dollar value of foreign debt denominated in foreign currency.
Chart 5: Capital inflow and net foreign liabilities
Source: Treasury estimates from MMRF model.
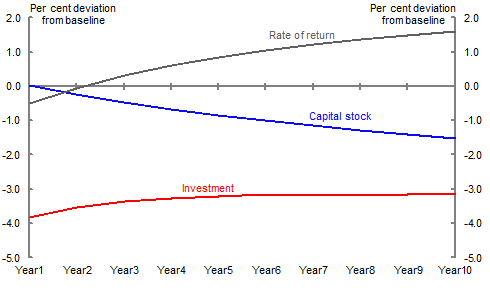
Investment is also lower (Chart 6). The lower investment causes a lower capital stock, with the difference from baseline increasing over time. Initially, this lower investment reduces demand and profitability. Over time, the growing shortage of capital increases the rate of return on capital.
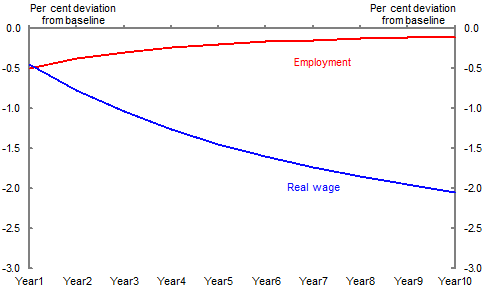
As a result of lower capital inflow and investment, employment and real wages are lower (Chart 7). Over time, the lower employment leads to increasingly lower real wages relative to baseline. These lower real wages gradually help employment return towards its baseline level. Therefore, the initial labour market impact is on employment and wages. The long-run effect is on wages and living standards as employment moves back to its baseline level. The lower levels of wages and employment reduce the incomes and living standards of many Australians and, other things being equal, would lead to lower wellbeing for these Australians.
Chart 6: Investment, capital and profitability
Source: Treasury estimates from MMRF model.
Chart 7: Labour market
Source: Treasury estimates from MMRF model.
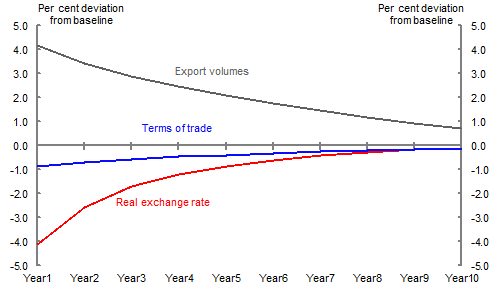
The lower capital inflow reduces foreigner’s purchases of Australian currency. That reduces the exchange rate until the lower capital inflow is matched by fewer importers selling Australian currency and more exporters buying Australian currency (Chart 8).
Chart 8: Exports, terms of trade and exchange rate
Source: Treasury estimates from MMRF model.
The lower exchange rate and the increase in export volumes also produce a lower terms of trade. Foreigners will buy more from Australia if there is a small reduction in the foreign currency price Australia charges for its exports, which is a small offset to the extra income from higher export volumes. This lower price produces a lower terms of trade.
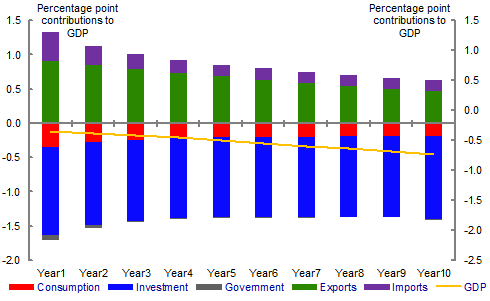
Given the lower levels of employment and capital, production is lower and this is matched by changes in the composition of demand (Chart 9).
Chart 9: GDP and demand components
Source: Treasury estimates from MMRF model.
The negative contribution of investment to GDP is shown. In the first year, this is matched by a positive contribution from exports and imports, where the contribution from higher exports exceeds that from lower imports. These contributions match because the lower investment causes lower capital inflow, which causes the lower CAD, which equals the contribution from net exports.
Lower production and the lower terms of trade lead to lower incomes, which reduce consumption.
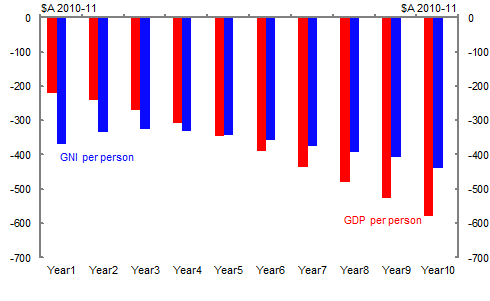
GDP per capita is lower (Chart 10). Gross national income (GNI) is also lower. Initially, the negative impact on GNI is larger than the negative impact on GDP because the lower international price of exports reduces the terms of trade and the purchasing power of Australian incomes. Later, the terms of trade effect becomes smaller and the lower net foreign liabilities reduce income payments to foreigners. Over time, the loss in GNI becomes smaller than the loss in GDP.
Chart 10: GDP per person and GNI per person
Change from baseline
Source: Treasury estimates from MMRF model.
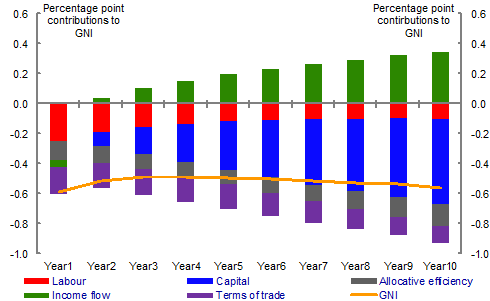
A key result is that a restriction on capital inflow and investment equal to 1 per cent of GDP will reduce GNI by about half a per cent each year in the first decade (Chart 11).
Chart 11: Contributions to GNI deviation
Source: Treasury estimates from MMRF model.
Different factors contribute to this result. Since employment is lower in the short run, this leads to a lower contribution from labour to GNI. As capital falls relative to baseline, this leads to a lower contribution from capital to GNI. Since the restriction on investment affects capital intensive industries more than labour intensive industries, there is also a loss to GNI from lower allocative efficiency. The lower terms of trade further reduces GNI.
Except for the first year, lower net foreign liabilities lead to lower income payments overseas. The detraction from GNI from lower production and other factors outweighs any supplement to GNI from lower income payments.
The broad magnitudes of these results can be obtained from other models too. For example, similar reductions in investment, GDP and the terms of trade can also be produced with a similar simulation using the G-cubed model of the international economy (McKibbin and Wilcoxen, 1999). This is significant because G-cubed is a different type of model with endogenous interest rates, endogenous inflation, forward looking financial markets and some forward looking investors and savers.
This suggests that, other things being equal, restrictions on capital inflow would reduce the wellbeing of Australians.
Conclusion
This article examined the history of Australia’s capital inflow and net foreign liabilities in recent decades. Net foreign liabilities are mostly comprised of net foreign debt rather than net foreign equity. The capital inflow funds that part of domestic investment not funded by domestic saving.
Some of the benefits of capital inflow are shown by using the MMRF model to estimate how much lower gross national income would be if capital inflow and investment was restricted. That would result in Australians having lower levels of income and wages in the long run than they would otherwise enjoy. It is also likely to lead to lower employment levels in the short term. The reduction in national income from less capital outweighs the increase in national income from less net foreign liabilities for at least the first decade. For example, a restriction on capital inflow and investment equal to 1 per cent of GDP will reduce gross national income by about half a per cent each year in the first decade. This suggests that, other things being equal, restrictions on capital inflow and investment would reduce the wellbeing of Australians.
References
Australian Bureau of Statistics 2011a, Balance of payments and internationa
l investment position, 2011, cat no. 5302.0, ABS, Canberra
Australian Bureau of Statistics 2011b, Australian national accounts: National income, expenditure and product, 2011, cat no. 5206.0, ABS, Canberra
Australian Government 2008, Australia’s Low Pollution Future Report, Commonwealth of Australia 2008
Australian Government 2011, Strong Growth Low Pollution Report, Commonwealth of Australia 2011
IMF 2011, World Economic Outlook, Tensions from Two speed recovery, Unemployment, Commodities and Capital flows, April, International Monetary Fund
McKibbin, W J and Wilcoxen, P J 1999, ‘The theoretical and empirical structure of the G-Cubed Model’, Economic Modelling, vol 16, pp 123–148
Technical appendix
This technical appendix contains the detailed analysis underlying the results presented in the article. First it considers the long-run effects of less capital inflow using some general macroeconomic principles. Then it considers the results from the Monash Multi Regional Forecasting (MMRF) model. It also presents the results from a larger reduction in investment and capital inflow.
Long-run effects of less capital inflow
This section considers what effect a lower level of capital inflow arising from lower investment into Australia would have on the Australian macroeconomy once capital stocks have fully adjusted. This abstracts from the adjustment process, which may take some time.
Since there is no policy proposal to restrict capital inflow, a lower level of capital inflow with a magnitude equal to 1 per cent of GDP is considered. That is about one quarter of the average capital inflow for the past three decades. It is also about 4 per cent of investment. This is a reduction in the level of capital inflow under the assumption that other things are unchanged. Since the supply curve for the financing of investment shifts to the left, rather than investment being fixed at a lower level, other things do change, including the levels of GDP and investment. This better replicates the features of a hypothetical policy where the overall level of investment is not set.
The precise mechanism that leads to this lower capital inflow is not important, except that it arises from some limitation on capital inflow and not from domestic saving. (A change in domestic saving would affect capital inflow, but would involve different policies, issues and outcomes, and is not considered in this article.)
The analysis in this section is based on macroeconomic principles under certain simplifying assumptions. It focusses on the most important transmission mechanisms in the economy so that less important effects are not discussed. The numbers presented indicate magnitudes but are not necessarily precise.
This analysis is not specific to any particular model of the Australian economy. Nevertheless, it addresses issues covered in any macroeconomic model because it uses economic principles and theory.
All results are considered relative to a baseline where no limitation or reduction in capital inflow is imposed. For example, an observation that investment is lower would mean that investment is lower than it was in the baseline, rather than that it was lower than in the previous year or that its growth rate was lower.
Australia is a small open economy with a flexible exchange rate and relatively free capital mobility between Australia and the rest of the world. The economy-wide saving and investment gap is equivalent to capital inflow or the use of foreign saving. This accounting identity is shown below as equation (1).
![]() (1)
(1)
This equation shows that investment in Australia (I) must be financed by either domestic saving (S) or by foreigners through capital inflow. If capital inflow is lower and domestic saving remains unchanged then investment must be lower by the same amount. If capital inflow is lower by 1 per cent of GDP then investment will also be 1 per cent of GDP lower, other things being equal. Given the current composition of the economy, this is equivalent to investment being about 4 per cent lower. This lower level of investment will lead to a lower level of capital.
The initial reduction in investment is not the same as the eventual change in investment (Chart 12). Initially, the investment schedule shifts to the left (from a to b) because less investment will be undertaken at any rate of return. However, the lower level of capital will increase the rate of return to capital. That will lead to a greater incentive to invest and more investment proposals (the shift from b to c). While some of these could be funded domestically, the rest will be funded by foreigners. That will lead to additional capital inflow that is a partial offset to the initial amount of capital inflow that was blocked.
Chart 12: Initial and final shifts in investment
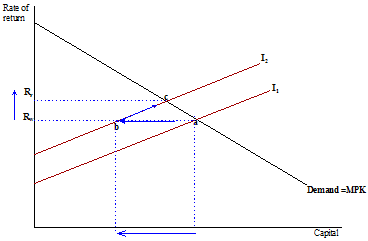
The following analysis assumes that the higher rate of return provides a partial offset to investment of (an arbitrary) 1 per cent. That will result in investment being only 3 per cent lower in the long run.
In the long run, lower investment will lead to a lower stock of capital. Lower capital will reduce the supply of factors of production in the economy and so reduce output. Given the current composition of the economy as shown by wages and profits, capital probably contributes about a third of total factors. On this basis, the 3 per cent lower capital will contribute to output being about 1 per cent lower if the amount of labour is unchanged.
The labour market is assumed to clear in the long run so that the demand and supply for labour match. Under the assumption that labour supply is unchanged, employment will also be unchanged.
Unchanged employment will require a change in wages, given that capital and production are lower. With capital and production being lower, an unchanged demand for labour requires a higher ratio of labour to capital and a higher ratio of labour to production. If production is lower by about 1 per cent then the ratio of labour to production must also rise by about 1 per cent if the demand for labour is to be unchanged.
The relevant elasticity for labour demand is likely to be less than one in Australia (including because we have seen the wages share increase when real wages rose in the 1970s). If this elasticity is equal to one half, then a 1 per cent increase in the ratio of labour to production requires real wages to be about 2 per cent lower.
With unchanged employment, but wages about 2 per cent lower, labour income is about 2 per cent lower. This reduction in labour income would reduce the incomes and, other things being equal, the wellbeing of most Australians.
Lower capital increases the rate of return on capital. If production is 1 per cent lower and capital is 3 per cent lower, then the ratio of capital to production is 2 per cent lower. Assuming an elasticity of a half, this leads to an increase in the rate of return to capital of about 4 per cent. (That is not an increase of 4 percentage points. Instead, it means that a baseline rate of return of 10 per cent would increase to a rate of return of 10.4 per cent, which is higher by 4 per cent of 10 percentage points.).
Having considered the size and structure of the supply side of the economy, which is about 1 per cent lower with less capital and more labour intensity, now consider the demand side of the economy.
By assumption, capital inflow is lower. By identity, this means that the current account deficit (CAD) is also lower. If interest payments and the other non-trade components of
the CAD change little, then the change must be largely on net exports. If capital inflow is lower by about 1 per cent of GDP then net exports must be higher by about 1 per cent of GDP.
The exchange rate moves to ensure that the lower capital inflow is matched by a lower CAD. If capital inflow is lower then there are fewer foreigners buying Australian dollars to invest here. The exchange rate is reduced to a level where either more exporters buy Australian dollars or fewer importers sell Australian dollars.
Australia’s exports are generally thought to be much more price elastic than our imports. That is partly because many of our exports are fairly homogenous commodities sold into large world markets where small differences in price are significant. It is partly because many of our imports are of investment goods and business inputs that are much less price sensitive.
In the (extreme) situation where all of the increase in net export was provided by an increase in exports, exports contribute 1 percentage point to GDP and exports would increase by about 4 per cent. If the elasticity of demand was about -4, then a 4 per cent increase in exports requires an increase in international competitiveness of about 1 per cent. Therefore, the exchange rate is about 1 per cent lower, abstracting from changes in the price of exports, the terms of trade and imports.
To the extent that capital inflow is lower by about the same amount as investment, the positive contribution from higher net exports will be about equal to the negative contribution from lower investment.
Since GDP is about 1 per cent lower and the contributions from investment and net exports broadly offset each other, the contribution from consumption must contribute about 1 percentage point to the lower in GDP. Equivalently, it must be lower by a little more than 1 per cent.
This is not a surprising result. If production is lower by about 1 per cent then private incomes and tax revenue will be lower by about 1 per cent. Also, higher export volumes will require some reduction in export prices, which reduces the terms of trade and further reduces real incomes. With unchanged budget deficits, government expenditure will be lower by about 1 per cent or more in line with lower tax revenue and tax bases. With unchanged private saving rates, private consumption will be lower by about 1 per cent or more in line with private income.
This analysis captures the main transmission mechanisms and establishes some expected directions of change and magnitudes. However, these results are not exact and they abstract from many other influences that are individually of smaller magnitude. For example, relative prices will likely shift, so that the price of consumption and investment may change relative to the price of output. Also, lower capital inflow reduces net foreign liabilities so that interest and dividend payments are lower. Further, different industries will be affected differently and compositional effects have been ignored.
To establish more precise relationships requires more assumptions, elasticities and data. It is also advantageous to take into account all the other relationships that were not considered above. Models of the Australian economy provide these advantages.
Some modelling results
Having analysed the likely long run effects on the macroeconomy, including directions and magnitudes of change, this section considers the results produced by one model of the Australian economy.
The model used was the Monash Multi Regional Forecasting (MMRF) model. It models over fifty industries and goods and services, it covers eight states and territories, and it contains a full set of identities for goods markets, labour markets, international transactions and income flows. It also contains assumptions for the behaviour of consumers, investors and governments. It abstracts from the behaviour of financial markets, ignores any distinction between debt and equity financed projects and does not model interest rates or changes in inflation.
The Treasury version of the MMRF model which is used in this article has been used to analyse the impacts of carbon pricing on the Australian economy. More details on this model can be found in the Strong growth, low pollution (SGLP) report and Australia’s low pollution future (ALPF) report (Australian Government, 2008 and 2011). The baseline used here is the modelling of the Government carbon pricing scenario done for the SGLP report.
The MMRF model has also been used by other agencies for other purposes, including by the Productivity Commission to examine the effects of microeconomic reforms.
MMRF was used to estimate the likely consequences of reducing capital inflow by 1 per cent of GDP, relative to what it would otherwise have been. However, since other things do not remain unchanged, capital inflow can move by more or less than that, including because of further changes in investment (Chart 12).
In MMRF, capital inflow is set by an identity along the lines of equation (1) and the lower capital inflow is achieved by reducing investment. Technically, the lower capital inflow is achieved by inserting into each industry’s investment equation an increase in the hurdle rate of return calculated to reduce business investment by 1 per cent of GDP. As shown in equation (1) above, this is equivalent to a reduction in capital inflow equal to 1 per cent of GDP, other things being equal.
Key macroeconomic results are reported in Table 1 for the first 10 years in the main body of this article.
First, compare the results in year 10 to the long-run results discussed in the previous section.
In year 10 in Table 1, investment is 3.1 per cent lower and the capital stock is only 1.5 per cent lower. The level of investment is relatively stable but the capital stock is continuing to fall relative to baseline. That suggests that the economy is half way towards its long run adjustment for the capital stock.
In year 10, the 1.5 per cent lower level of capital has increased the rate of return by 1.6 per cent. This stimulates investment and the extra investment is funded by foreigners. This partly offsets the initial reduction in capital inflow and investment.
The year 10 results for employment and wages show that employment is 0.1 per cent lower while wages are 2.0 per cent lower. That suggests that the labour market is close to its long run result with much larger changes in wages than employment. The extent to which wages are lower is very similar to the long-run results from the previous section, even though the capital stock has only partially adjusted.
Production is 0.7 per cent lower in year 10. That is obtained on the supply side with 1.5 per cent lower capital and 0.1 per cent lower employment and reflects different ratios of labour to capital in different industries and movements between industries. The composition of demand is also broadly consistent with the long-run analysis in the previous section.
Investment makes the largest negative detraction from GDP of 1.2 percentage points.
Net exports make a positive contribution to GDP of 0.7 percentage points in total. The 0.5 percentage point contribution from higher exports is greater than the 0.2 percentage point contribution from lower imports. Imports are lower (1.1 per cent) by a little more than GDP. In contrast, exports are about 0.7 per cent higher despite GDP being 0.7 per cent lower. In summary, exports have moved more than imports, especially as a share of GDP, as expected.
In year 10, the exchange rate is 0.1 per cent lower. This is a smaller reduction than expected from the long-run analysis of the previous section. In MMRF, the export supply of agricultural and mining commodities is determined by the capital stock in those industries. This is determined by investment in those industries in previous years, which is strongly influenced by the exchange rate in those previous years. Since the exchange rate is
lower by about 1 per cent on average in the first ten years, investment is higher in export oriented industries. So exports are higher in year 10 because they were previously internationally competitive as well as because of the small increase in international competitiveness in year 10.
Consumption and government expenditure are the remaining demand side components of GDP. Consumption makes a contribution of -0.2 percentage points to GDP. Gross national income (GNI) is 0.6 per cent lower. Lower household incomes lead private consumption to be 0.5 per cent lower. Net foreign liabilities as a percentage of GDP are nearly 6 percentage points lower. This is a result of the lower levels of capital inflow in the preceding years. Capital inflow initially fell by nearly 1 per cent of GDP but by year 10 it has partially recovered as the higher rate of return stimulates investment further, which at the margin is funded by foreigners.
The results for the first year of the simulation from Table 1 are now analysed.
Capital inflow of 1 per cent of GDP will lower investment by 3.8 per cent. This subtracts 1.3 percentage points from GDP on the demand side. So far, demand is lower and that has not yet been matched by lower supply. Three different factors work to bring demand and supply into balance. Employment is 0.5 per cent lower. This lower level of labour inputs explains why production is 0.4 per cent lower. The lower level of employment lowers real wages, which continue to fall relative to baseline for many years subsequently while employment is still lower than the baseline.
The exchange rate is 4.1 per cent lower. This provides the increase in international competitiveness to make exports 4.2 per cent higher and imports 2.1 per cent lower. Together, these positively contribute 1.3 percentage points to GDP, which matches the 1.3 percentage point detraction to GDP from lower investment. This matching is due to the equivalence between the contraction of capital inflow and the CAD. The lower investment corresponds to a lower level of capital inflow, while the initial increase in net exports is a result of the current account deficit being lower by exactly the same amount as capital inflow. As noted above, the lower exchange rate stimulates net exports now and, by drawing investment into the export oriented sectors; helps boost exports in future too.
With investment initially offset by net exports, lower production must be the result of lower consumption and government expenditure. GNI is 0.6 per cent lower. Part of this arises from 0.4 per cent lower production. Part of this also comes from a decline in the terms of trade since exporters cut their foreign currency prices to win higher market shares, which further reduces real incomes. (Note that it is only a partial offset to the boost to exports described above.) Private consumption is 0.7 per cent lower in the first year.
The results above focus on a reduction in capital inflow of an arbitrary 1 per cent of GDP or equivalently investment that is 3.8 per cent lower. Given that Australia has experienced levels of capital inflow over the last thirty years that average about 4 per cent of GDP (Chart 1); Box 1 considers the impact of a larger reduction in investment equal to 4 per cent of GDP.
This box considers the consequences of a larger reduction in capital inflow. Other things being equal, capital inflow is lower by 4 per cent of GDP (rather than 1 per cent), which is about the average level of capital inflow that has occurred in the last three decades (Chart 1). This is also equivalent to investment being 13.8 per cent lower. Table 2 contains some key results, which are about four times larger than the results reported in Table 1.
In the first year:
- investment is nearly 14 per cent lower;
- GDP is 1.2 per cent lower and GNI is 1.9 per cent lower;
- real wages are 1.5 per cent lower; and
- employment is about 1.7 per cent lower.
After ten years:
- investment is 11 per cent lower;
- GDP is 2.6 per cent lower and GNI is 2 per cent lower;
- real wages are 7.2 per cent lower; and
- employment is about 0.4 per cent lower.
Table 2: Macroeconomic impacts of capital inflow lower by 4 per cent of GDP
Change from the baseline
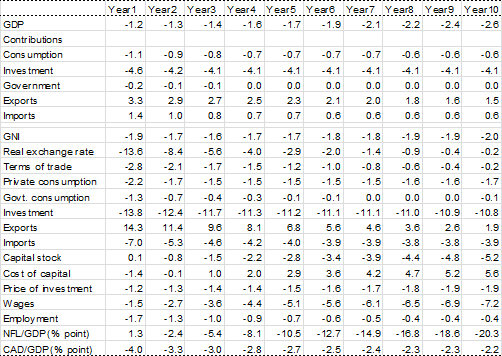
Note: GDP contributions are percentage point contributions to GDP deviation from baseline. NFL and CAD as a share of GDP is the change in the ratio in percentage points from baseline.
Source: Treasury estimates from MMRF model.
1 Valuable suggestions were provided by colleagues, including Ben Dolman, David Earl, Christopher Hoy, Steve Morling, Mark O’Shea, Liyi Pan, Sam Reinhardt, Daniel Silva Withmory, Jim Thomson, and Luke Willard.
2 In this article, capital inflow always means net foreign capital inflow. This is gross inflows less gross outflows. It is the balance on the capital and financial accounts in the balance of payments, and covers both debt and equity inflows. This article abstracts from the data measurement issues that the ABS confronts and that give rise to errors and omissions.
3 The rest of this article assumes that there is no change in official reserve assets.
4 It is worth noting that Australia’s exposure to foreign currency risk is minimal – more than 90 per cent of our foreign liabilities are either denominated in, or hedged back into, Australian dollars.
5 G7 countries are Canada, France, Germany, Italy, Japan, the United Kingdom and the United States.
6 The Treasury version of the MMRF model which is used in this article was also used to analyse the impacts of carbon pricing on the Australian economy. More details on this model can be found in the Strong growth low pollution (SGLP) report and Australia’s low pollution future (ALPF) report (Australian Government, 2011 and 2008). The baseline used here is the modelling of the Government carbon pricing scenario done for the SGLP report. The MMRF model has also been used by other agencies for other purposes, including by the Productivity Commission to examine the effects of microeconomic reforms.