This article briefly illustrates some key aspects of Australia's economic development over the century since Federation. The time between 1901 and 2000 was generally a period of increasing prosperity; reinforced in recent times by strong economic gains in the second half of the 1990s.
Introduction
This `pictorial' article briefly illustrates some key aspects of Australia's economic development since Federation, with a particular focus on how Australia's most recent economic performance in the 1990s compares with other periods of the past century. Points for discussion include:
- the dimensions of Australia's economic growth over the past century, and in particular, the trends in GDP growth and GDP growth per capita;
- the levels of inflation and unemployment over the last century; and
- the pattern of exports, imports and the current account balance over the century since Federation.
Trends in Australia's economic growth, 1901-2000
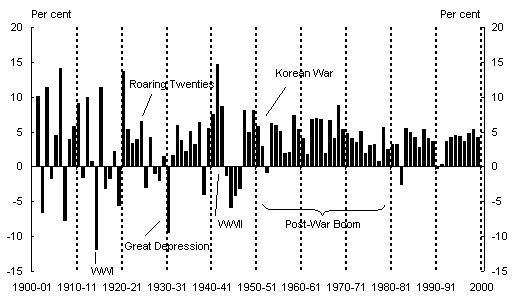
Economic growth (Chart 1) in the first five decades following Federation was highly volatile. Years of very strong economic growth of over 5 and 10 per cent were interspersed with years of very large declines in activity. 1
Chart 1: Annual GDP growth, 1901-2000
Source: ABS catalogue number 5206.0 for the period 1959-2000. Treasury, for the period 1940-1958. Butlin, N. G. (1962) for the period 1901-1939.
Volatility in agricultural production is likely to have contributed to the volatility of overall GDP in the early years after Federation, while two world wars and the Great Depression also significantly impacted on economic stability in the first half of the century.
Economic growth since the 1950s has been much more stable, with the 1990s standing out as one of the more stable decades, despite the recession of the early 1990s.
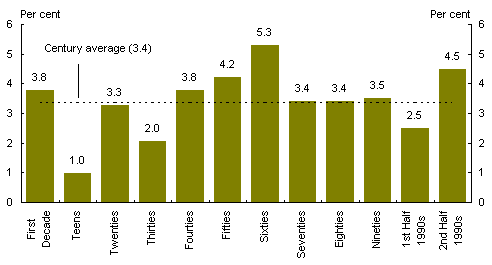
One approach to looking through some of this short-term volatility is to consider decade average GDP growth rates (Chart 2). Growth over the century as a whole averaged around 3.4 per cent per year. Outcomes in the second decade and the 1930s fell well short of that average, while the 1960s were markedly above the average.2 Strong growth in the 1950s and 1960s was largely driven by rapid population growth and the transition to manufacturing production (Sinclair, 1976).
Chart 2: Decade average GDP growth, 1901-2000
Source: ABS catalogue number 5206.0 for the period 1959-2000. Treasury, for the period 1940-1958.
Butlin, N. G. (1962) for the period 1901-1939.
By comparison with earlier periods, average growth in the 1990s was solid, and just above the century average. Australia generally experienced impressive GDP growth in the 1990s, partly reflecting strong productivity growth (OECD, 2000). What is remarkable about the 1990s, is the marked increase in growth over the second half of the decade, which ultimately provided for the solid decade average growth over the 1990s, despite relatively modest growth in the first half of the decade.
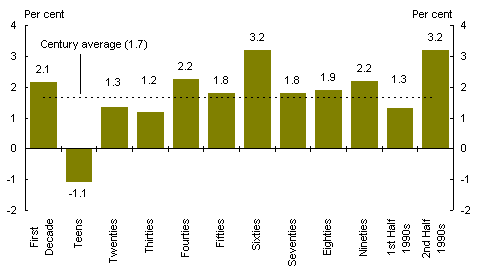
The strong growth in the latter half of the 1990s is more marked in comparison to previous periods when expressed in terms of GDP growth per capita (Chart 3). This provides a better indication of growth in living standards. GDP growth per capita in the 1990s was 2.2 per cent per annum, second only to the 1960s and above the century average of 1.7 per cent per annum. In the second half of the 1990s growth was significantly higher at 3.2 per cent per annum.
Chart 3: Decade average GDP growth per capita, 1901-2000
Source: ABS catalogue number 5204.0 for the period 1971-2000, and 5206.0 for the period 1960-1970.
Treasury, for the period 1940-1959. Butlin, N. G. (1962) for the period 1901-1939.
In international terms, decade average GDP growth per capita was lower in Australia than for the OECD as a whole over the 1960s, 1970s and 1980s. This situation was reversed in the 1990s, with Australia's decade average per capita GDP growth being higher than the OECD as a whole.3 Australia's economic growth in the 1990s was underpinned by a surge in productivity growth, to rates that were amongst the best in the world and historically high (OECD 2000). This productivity growth also provided for a very low inflationary environment.
A century of moderate inflation and unemployment
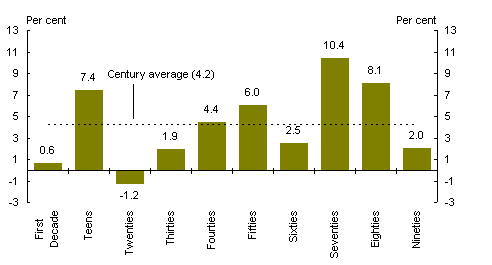
Chart 4 illustrates that the century since Federation was generally a period of relatively low inflation, with only the second decade of the century and the 1970s and 1980s being standout decades of high inflation. Oil price shocks and domestic inflationary pressures in the seventies resulted in a long period of high inflation. High inflation undermined Australia's economic growth between 1970-1990, relative to previous decades, with the highest decade average inflation rates of the twentieth century in the 1970s and 1980s.
Chart 4: Decade average inflation, 1901-2000
Source: ABS catalogue number 5206.0 for the period 1959-2000. Treasury, for the period 1940-1958.
Butlin, N. G. (1962) for the period 1901-1939.
The 1990s saw a return to very low inflation rates, with inflation averaging around 2 per cent per annum. While the low inflation in the 1990s is impressive in itself, the comparison with previous periods is even more striking given the strong economic growth experienced during the second half of the 1990s. While the 1990s rate second behind the 1960s in GDP growth per capita, inflation was actually lower in the 1990s and vastly lower again when compared with the 1970s and 1980s.
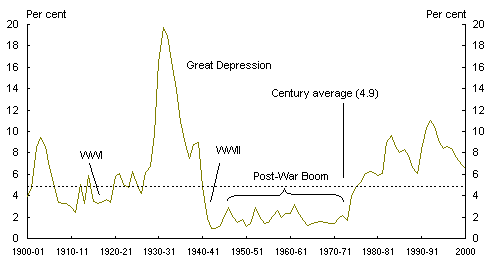
In the course of the last century the unemployment rate (Chart 5) ranged between a high of almost 20 per cent during the Great Depression to a low of less than 1 per cent in the midst of the WWII.4 From 1939 to 1945 the Australian economy devoted much of its resources to the national war effort, and the large increase in labour demand produced a sharp decline in the unemployment levels that had lingered after the Depression.
Chart 5: Australia's unemployment rate, 1901-2001
Source: RBA Preliminary Annual Database for the period 1901-66. ABS Quarterly Labour Force Survey for the period 1967-77. ABS Monthly Labour Force Survey for the period 1978-2000.
Slower GDP growth than the 1950s and 1960s and record levels of inflation in the 1970s and 1980s brought the relatively new phenomenon of persistently high unemployment. Only the combination of solid economic growth and low wage and price pressures achieved over the 1990s saw a significant and sustained reduction in the unemployment rate.5
The changing structure of Australia's economy
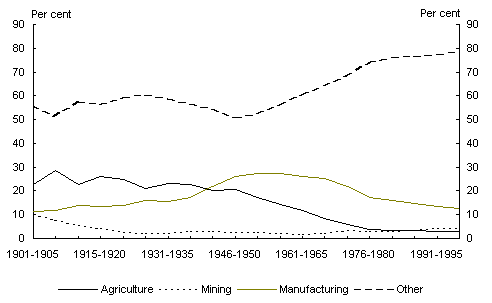
Since 1901 there have been significant changes in the industry shares of GDP for the mining, agricultural, manufacturing and services sectors of the economy.6
Ch
art 6: Industry shares of GDP, 1901-2000
Source: ABS yearbooks (various editions) for the period 1975-2000. Treasury for the period 1940-74. Butlin, N. G. (1962) for the period 1901-39.
Key trends evident in Chart 6 include:
- the rise in the services sector share of GDP (refer to `Other' in Chart 6) after the middle of last century with the services sector also representing the largest portion of the Australian economy; 7
- a peak in manufacturing after World War Two (WWII), and subsequent decline as a share of GDP since that time (consistent with the experience of many industrialised nations) to a level similar to that of a century ago;
- the gradual decline of agriculture as a share of GDP after the first four decades following Federation as the economy became less reliant on the land; and
- mining's declining share of GDP following the early years of Federation, picking-up in recent decades following further discoveries and development of economically viable resources.
Australia's increasing trade intensity
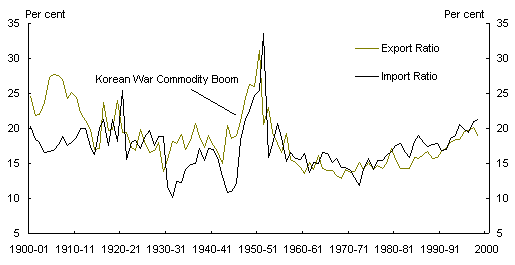
Trade intensity, measured as the ratio of exports and imports to GDP (Chart 7), has increased in recent decades as a more open Australian economy has been exposed to greater trade.
With the world wars, the Great Depression and growing worldwide protectionism, Australia's exports and imports declined markedly as a proportion of GDP over the first four decades of the last century. The 1920s were influenced by increased protectionism, particularly in the agricultural and manufacturing industries.
Chart 7: Exports and imports as a share of GDP, 1901-2000
Source: RBA Preliminary Annual Database, and ABS Cat No 5206.0.
The Korean War saw a surge in demand for many commodities and Australia's exports climbed dramatically. Import restrictions were then relaxed, which saw a sharp rise in imports as Australia took advantage of freer trade. Restrictions were then reimposed, and the bulk of these restrictions remained in place for the next three decades.
Australia lowered its tariff barriers in the 1970s and adopted a floating exchange rate in 1983. Since then, the ratio of exports and imports to GDP has increased steadily, to return to levels similar to those at the start of last century.
Moderate current account deficits were the norm
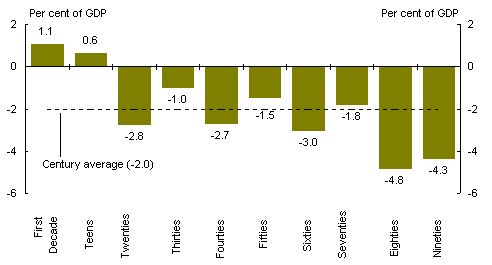
With Australia's shifting trading patterns, the Current Account Balance (Chart 8) has also fluctuated. During the 1920s the pattern of sustained current account deficits (CAD) was established. The domestic savings of a relatively small Australian population needed to be supplemented by savings from overseas.
Chart 8: Current account balance, 1901-2000
Source: RBA Preliminary Annual Database, and ABS Cat No.s 5206.0 and 5302.0.
The ability to `tap into' the world economy has allowed Australia much greater investment capacity and correspondingly higher economic growth, in turn producing higher per capita income and increased wealth.
Although the decade average CAD in the 1990s was larger than the century average CAD as a whole, it was lower than the average for the 1980s. The improved stability in the CAD in the 1990s follows the sharp rise in the 1980s and further adds to Australia's economic performance in the 1990s - in addition to the low inflation, and declining unemployment.
Concluding themes
Through the course of the century since Federation, Australia generally enjoyed moderate inflation and unemployment, and solid economic growth. During the second half of the last century, economic growth was significantly more stable than in the first half, on average, which correspondingly produced higher economic growth and GDP growth per capita.
Two of the standout decades in the last hundred years, were the 1960s and the 1990s. The former was underpinned by a boom in mineral trade, improved manufacturing productivity and strong population growth during a period of strong worldwide growth, while the latter reflects the dividends of a sound macro-policy framework and the outcomes from ongoing structural reform.
Indeed, the 1990s, and the second half of the 1990s in particular, ranks as one of Australia's best periods in terms of historically high productivity, strong GDP growth and GDP growth per capita, low inflation and falling unemployment - a period which not only reinforced prosperity and wealth from Australia's own perspective, but also by comparison to the outcomes achieved by the major industrialised economies.
Sources (bibliography)
Australian Bureau of Statistics (2001), Year Book Australia 2001, Stored on CD Rom, (Catalogue Number 1301.0.30.001)
Boehm, E.A. (1979), Twentieth Century Economic Development in Australia, Second Edition, Longman Cheshire, Melbourne.
Butlin, N.G. (1962), Australian Domestic Product, Investment and Foreign Borrowing 1861-1938/39, Cambridge University Press.
Commonwealth of Australia (2000), `Budget Strategy and Outlook 2000-01', Budget Paper No. 1, The Department of Treasury, May 2000, Canberra.
Gregory, R.G. and N.G. Butlin (1988), Recovery from the Depression: Australia and the World Economy in the 1930's, Cambridge University Press, Cambridge.
Gruen, D. and S. Shrestha (2000), `The Australian Economy in the 1990s', Proceedings of a Conference 24-25 July 2000, Economic Group, Reserve Bank of Australia.
Keating, M. (1973), `The Australian Workforce 1910-11 to 1960-61', The Australian National University, Canberra.
OECD (2000), OECD Economic Surveys 1999-2000, Australia, OECD Publications.
Sinclair, W. A. (1976), The Process of Economic Development in Australia, Longman Cheshire, Melbourne.
Treasury (2000), Economic Roundup, Department of Treasury, Spring 2000, Canberra.
1 Historical data on GDP from the earliest periods are likely to be less reliable, and the GDP growth estimates derived should therefore be treated with caution.
2 Due to the relative volatility of data from 1901 to 1950, average growth rates over that period in Charts 2 and 3 are generated utilising simple averages, while averages for 1951 to 2000 are generated using the preferred compound growth rates. Century average growth rates and decade average inflation rates in Chart 4 are also calculated as simple averages.
3 Address by Ted Evans, Secretary to the Treasury, Ninth Annual Colin Clark Memorial Lecture, Economic Nationalism and Performance: Australia from the 1960s to the 1990s, 3 June 1999.
4 Unemployment rates based on information contained in the reporting done by trade unions on the number of unemployed members suggest a peak in the depression related unemployment of just under 30 per cent. However, these unemployment statistics are not directly comparable over time.
5 The century average unemployment rate of 4.9 per cent abstracts from the effect of the Great Depression.
6 As this discussion seeks to only identify broad changes in aggregate industry structure over the century, it takes no account of definitional and technical changes to industry data series over the period. Industry shares of GDP are measured as the ra
tio of total product for a given industry to GDP.
7 Measuring the precise contribution of the service sector in the early stages of the century is difficult, but a strong proxy is readily formed from the residual of farming, mining and manufacturing contributions. Although this simple proxy tends to overstate the exact percentage contribution of services to GDP, the overall trends are similar to most research material for this area.