Gene Tunny1
Australians have increased their educational attainment over the past few decades, essentially catching up with their peers in the rest of the OECD. Although older Australians have lower upper secondary attainment, the educational attainment of young Australians is similar to the OECDaverage. With strong educational attainment among young Australians, the flow of younger well-educated cohorts into the working-age population will gradually improve Australia’s total stock of human capital. While it seems plausible to believe that such increases in measured educational attainment will benefit Australia’s economic performance, it is difficult to find statistical support for such a conclusion from a cross-country comparison of productivity and educational attainment.
Introduction
This article compares the educational attainment of Australians with their peers in the rest of the OECD. Discussions of educational attainment often focus on average years of schooling. However, estimates of average years of schooling require assumptions about the number of years of schooling a particular level of attainment represents. This has resulted in discrepancies between estimates from different sources. Furthermore, average years of schooling can give a misleading picture of overall educational attainment, especially if a large tertiary-educated segment of the population skews the average upward.
Arguably, a population’s educational attainment is better summarised by its educational attainment profile, which is the distribution of people at different levels of educational attainment. For example, the educational attainment profile shows the percentage of the population that has at least an upper secondary education.
Although a more informative measure than average years of schooling, the educational attainment profile is still subject to the significant caveats that attach to international comparisons of educational attainment. It is difficult to compare levels of attainment across countries with different education systems, especially where there may be quality differences in the provision of education.
Section 2 contains an overview of the evolution of Australia’s educational attainment profile relative to the rest of the OECD and, in particular, the United Kingdom (UK) and the United States (US). Then Section 3 discusses the relationship between educational attainment and labour productivity across the OECD. Section 4 summarises and concludes.
Australia’s educational attainment profile
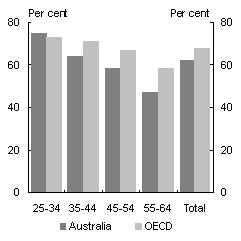
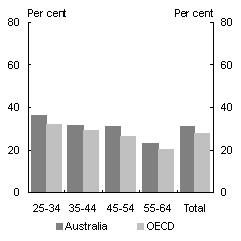
Educational attainment profiles for Australia and the rest of the OECD by age group are presented in Chart 1. The profile for the rest of the OECD is an average of the profiles of member countries, weighted by their relative populations. The US and Japan are given a greater weight than Denmark and Sweden, for example. This gives a truer picture of where Australia is in the OECD compared with the simple average or country mean, which can be skewed by a number of smaller countries. The youngest age group presented is 25-34, to allow for differences in typical ages of graduation among OECD countries.
Two broad levels of educational attainment are used: at least upper secondary and tertiary. In Australia, in addition to university qualifications, the tertiary category includes diploma and advanced diploma courses awarded in the Vocational Education and Training (VET) sector, which conducts approximately one-sixth of tertiary education in Australia (OECD 2005b). All the other VET qualifications are classified as upper secondary education, which includes post-school non-tertiary qualifications.
|
Chart 1: Educational attainment, Australia and rest of OECD, 2003(a) |
|
|
Chart 1a: At least upper secondary |
Chart 1b: Tertiary |
|
|
|
- 2002 data for Iceland, Italy, and Netherlands.
Source: OECD (2005a; 2005c).
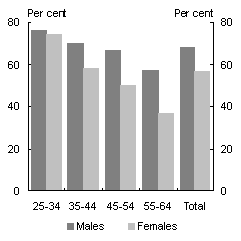
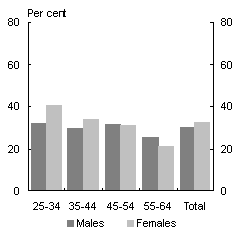
Charts 1a and 1b suggest a substantial increase in Australia’s educational attainment over the last few decades of the twentieth century. While the proportion of Australians aged 55-64 with at least upper secondary attainment was 11percentage points below the weighted average of the rest of the OECD, this shortfall diminishes and disappears for younger age groups. The proportion of Australian 25-34 year olds with at least upper secondary attainment was marginally higher than for 25-34 year olds in the rest of the OECD. A large part of the increase in educational attainment from one age group to the next was the increase in educational attainment among females relative to males (Chart 2).
|
Chart 2: Educational attainment, males and females, Australia, 2003 |
|
|
Chart 2a: At least upper secondary |
Chart 2b: Tertiary |
|
|
|
Source: OECD (2005c).
Along with high tertiary attainment across all age groups, the increase in educational attainment with each successive cohort has made the aggregate educational attainment profile ‘hollow’ in the middle. Proportionately, Australia has more tertiary qualified people than the rest of the OECD. Also, as Australia has proportionately fewer people with at least upper secondary attainment, it has more people with only lower secondary attainment. The youngest age group, however, has comparable if not higher educational attainment than their peers in the rest of the OECD. This suggests that the hole in the middle will be gradually filled in as younger cohorts replace older cohorts over the decades to come.
While the comparison with the rest of the OECD is informative, it masks a wide variation in the educational attainment profiles of member countries. Narrowing the comparison to countries with broadly similar histories and institutions, such as the UK and the US, shows a substantial increase in Australia’s educational attainment relative to the UK and US over the last few decades.
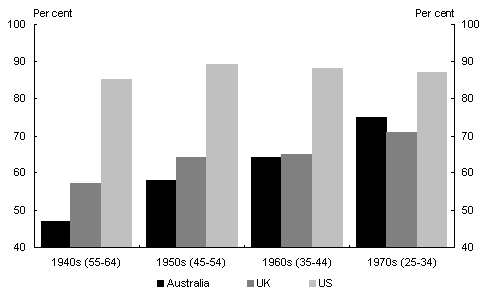
The increase in educational attainment from older to younger age groups is more easily seen if the age groups are presented in reverse order, from oldest generation to youngest. Taking the 55-64 age group as the generation of the 1940s, the 45-54 age group as the generation of the 1950s, and so on, Chart 3 shows Australia’s substantial increase in at least upper secondary attainment relative to the UK and US.
Chart 3: At least upper secondary attainment by generation (age group), 2003
Source: OECD (2005a).
As Chart 3 highlights, the upward shift in Australia’s educational attainment was still occurring comparatively recently. While there was a significant shift in Australia’s educational attainment between the 1940s and 1950s generations, the change between the 1950s and 1960s generation was about half the size. There was, however, a large change in (at least) upper secondary attainment between the 1960s and the 1970s generations. This increase resulted in Australian 25-34 year olds having higher upper secondary attainment than their peers in the UK. The US has had a high and stable level of upper secondary attainment across the generations.
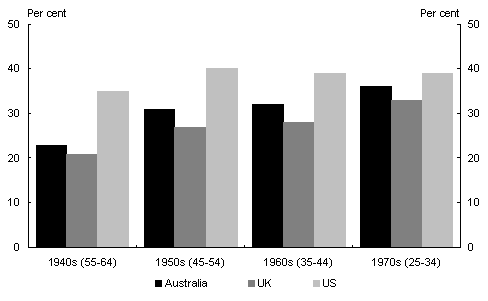
Australians have also increased their tertiary attainment from generation to generation, although not as substantially as upper secondary attainment (Chart 4). This is partly due to Australians having relatively high tertiary attainment across all generations. The 1970s generation in Australia has tertiary attainment almost at the US level.
It is difficult to project the educational attainment of future cohorts. For example, a cohort’s average upper secondary attainment will depend on school retention rates, but also on completion rates of VET qualifications that are measured as equivalent to upper secondary. There will also be a small proportion of each cohort that attain uppersecondary qualifications beyond the traditional age of high-school completion.
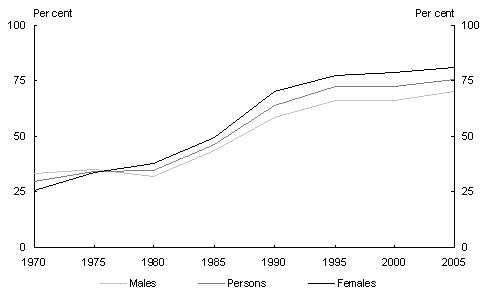
Nonetheless, some indication of the likely educational attainment of future cohorts is given by current year 12 retention rates (Chart 5). The maintenance of retention rates at around historically-high levels suggests that younger cohorts are likely to be just as well qualified as current 25-34 year olds. This continued inflow of highly-educated young people will gradually increase the average educational attainment of the Australian population.
Chart 4: Tertiary attainment by generation (age group), 2003
Source: OECD (2005a).
Chart 5: Year 12 retention rates, Australia
Source: ABS Schools, Australia, various years, cat. no. 4221.0.
Note: Data presented in this chart are at five-yearly intervals.
Educational attainment and labour productivity
This article has reviewed trends in educational attainment for Australia and comparator countries, but has not considered whether a particular educational attainment profile is desirable. Studies relating to this issue in the Australia context include Dowrick (2003), Access Economics (2005), and Borland (2002), for example. Although a full exploration of this issue is beyond the scope of this article, it is worthwhile considering the relationship between educational attainment and labour productivity currently observed across the OECD.
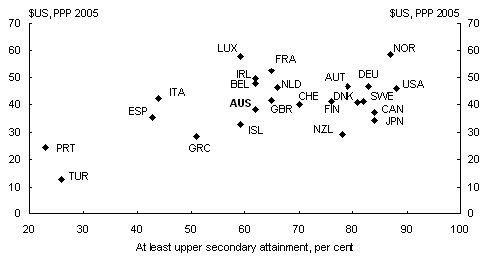
Chart 6 plots educational attainment and labour productivity (GDPperhour worked) across the OECD in 2003. While there is broadly a relationship between a country’s average educational attainment and labour productivity, this relationship may not extend beyond a ‘threshold’ level of educational attainment.2 Australia is one of the cluster of countries where there is not a strong relationship between the level of labour productivity and levels of educational attainment.
Chart 6: Educational attainment and GDP per hour worked, 2003
Source: OECD (2005a) and Groningen Growth and Development Centre and the Conference Board (January 2006). Data are for the 24 longest standing OECD member countries.
The evidence in Chart 6 tends to suggest that higher measured educational attainment is, alone, no guarantee of stronger economic performance. For example, despite the substantial difference in educational attainment between Australia and Japan, Australia had a 12percent higher level of labour productivity than Japan in 2003. Nonetheless, it seems plausible that the mix of education and training, and its quality, will be important.
In addition to education mix and quality differences, another possible explanation for the breakdown in the education-productivity relationship among high-income countries could be that their populations might have different preferences for education. To varying degrees, as countries reach a threshold level of economic development their populations may increasingly demand education for lifestyle and personal development reasons, rather than for any income benefit it might provide.
There are also a range of other institutional and macroeconomic factors that might explain the particular performance of particular countries. These would include country-specific contextual factors and policy settings, including product and labour market regulations. These possible influences are discussed by Rahman (2005) in the context of labour productivity differences between Australia and the US.
Conclusion
Australia has experienced a substantial increase in the educational attainment of its working-age population over the past few decades. Australia has caught up with the rest of the OECD and has substantially increased its educational attainment relative to the UK and US. Indeed, it appears that young Australians have surpassed their peers in the UK in upper secondary and tertiary attainment. Although lower than the US in tertiary attainment, Australia has a relatively high level of tertiary attainment among OECD countries. Furthermore, the remaining gap with the US for the youngest cohort is small.
Despite some concerns about the international comparability of education systems and levels of educational attainment, it appears that the educational attainment of younger Australians is encouraging. With strong educational attainment among younger Australians, the flow of younger well-educated cohorts into the working-age population will gradually improve Australia’s total stock of human capital.
References
Access Economics 2005, The Economic Benefit of Increased Participation in Education and Training, Dusseldorp Skills Forum, Sydney.
Borland, J 2002, New Estimates of the Private Rate of Return to University Education in Australia, Department of Economics, University of Melbourne.
Dowrick, S 2003, ‘Ideas and education: level or growth effects?’, NBER Working Paper, no. 9709.
Groningen Growth and Development Centre and The Conference Board 2006, Total economy database, January, University of Groningen, viewed March 2006, www.ggdc.net.
Krueger, A and Lindahl, M 2001, ‘Education for growth: Why and for whom?’, Journal of Economic Literature, vol 39, no. 4, pp 1109-36.
OECD 2005a, Education at a Glance: OECD Indicators 2005, OECD, Paris.
OECD 2005b, Education Policy Analysis, OECD, Paris.
OECD 2005c, Labour force statistics, December, OECD, Paris, viewed 15September2005, www.oecd.org.
Rahman, J 2005, ‘Comparing Australian and United States productivity’, Economic Roundup, Autumn 2005, pp 27-45.
1 Th
e author is from the Macroeconomic Policy Division of the Australian Treasury. This paper has benefited from comments and suggestions from fellow Treasury officers, including Greg Coombs, Graeme Davis, David Gruen, John Hawkins, Rob Heferen, Hamish McDonald, David Parker, Jyoti Rahman and Dominic Regan. The views in this article are those of the author and not necessarily those of the Australian Treasury.
2 This parallels the finding of the effect of education on economic growth made by Krueger and Lindahl (2001, p1130) that ‘education was statistically significant and positively associated with subsequent growth only for the countries with the lowest level of education’.
