Graeme Davis and Jyoti Rahman
Treasury Working Paper
2006 — 04
September 2006
This paper is a revised version of a paper presented at the Productivity Perspectives Conference hosted by the Productivity Commission and the Australian Bureau of Statistics on 23 March 2006. The authors are from Macroeconomic Policy Division, the Australian Treasury. The authors would like to thank Greg Clark, BenDolman, Ruth Gabbitas, DavidGruen, StevenKennedy, Simon Laffey, Paul O’Mara, DavidParker, and their colleagues in the Macro Dynamics Unit for their suggestions. The views in this article are those of the authors and not necessarily those of theAustralianTreasury.
Productivity is the key driver of economic growth and prosperity over the long run. It is possible to think of Australia’s productivity growth as consisting of two elements: Australia’s productivity catching up to its steady statelevel relative to the global technological frontier; and an outward movement of the frontier.
The United States is often seen as a reasonable proxy for the global technological frontier. Over the past four decades, Australia’s productivity has been mostly between 75 and 85 per cent of that of the US. This productivity gap can at least in part be explained by a combination of differences in: capital per worker; educational attainment; microeconomic policies; and the geographic and historical context in which the two economies operate.
Economic reforms of the recent decades have helped improve Australia’s productivity level relative to the frontier and narrow the productivity gap. This narrowing of the gap has manifest itself as an increase in Australia’s productivity growth rate. Additional reforms could help narrow the productivity gap further. However, in the long run, Australia’s productivity growth will be primarily determined by technological progress at the frontier.
JEL Classification Numbers: O47.
Keywords: Productivity, convergence, technological progress.
Contents
3. The Australia-US productivity gap
4. Perspectives on productivity prospects
Perspectives on Australia’s productivity prospects
Graeme Davis and Jyoti Rahman
11. Introduction
It is standard practice to analyse the level and the growth rate of a country’s GDPperperson when gauging the country’s economic performance. To analyse its evolution over time, the Australian Treasury often decomposes GDP per person into ‘3Ps’— population, participation and productivity. Population is the proportion of the population that are of working age. Participation is the average number of hours worked by those of working age. The final ‘P’ in this framework is labour productivity, measured as GDPperhour worked and used synonymously as productivity in this paper. The components of the ‘3Ps’ framework are multiplied together to give GDPperperson.
An examination of the contribution of each of the components suggests that productivity has been the primary driver of growth in GDPperperson in Australia over the past four decades (Chart 1).
Chart 1: Contribution to the growth in Australia’s GDP per person

Source: Australian Bureau of Statistics (ABS) Australian Historical Population Statistics; ABS Australian Demographic Statistics; Reserve Bank of Australia (RBA) Australian Economic Statistics; ABS National Accounts; authors’ calculations.
Similarly, assumptions about productivity growth matter greatly in projecting the future size of the Australian economy and its ability to meet future fiscal pressures from demographic change. For example, if annual productivity growth across the economy were of a percentage point faster than the 1percent assumed in the Commonwealth of Australia (2002) Intergenerational Report (IGR), the Australian economy would be about 20percent larger than assumed in the IGR in forty years.
After stagnating during the 1980s, Australia’s productivity grew rapidly during the 1990s. In particular, productivity growth in the later part of that decade was stronger than during any comparable period in the previous thirty years. Since that time, productivity growth has eased towards its long-term average rate (Chart 2).
Chart 2: Annual productivity growth
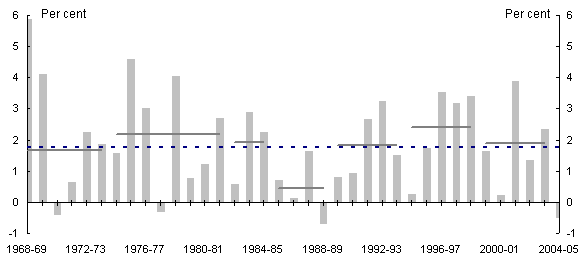
The columns represent annual growth rates; the solid lines represent annual average growth rates over the ABS ‘productivity growth cycle’; and the dotted line represents the annual average growth rate since 1968-69.
Source: ABS National Accounts; RBA Australian Economic Statistics; authors’ calculations.
It is possible to think of Australia’s productivity growth as consisting of two elements: Australia’s productivity catching up to its steady state level relative to the global technological frontier; and an outward movement of the frontier. This is the approach taken in this paper.
If the United States is taken as the global technological frontier, then an examination of Australia’s productivity level relative to that of the US might help explore the following questions: how close to the frontier is Australia’s productivity; how much more can Australia’s productivity catch-up; and how fast is the frontier moving? This paper explores these questions in order to get a perspective on future productivity growth.
The rest of this paper is organised as follows. Section 2 describes an analytical framework based on the idea of conditional convergence. Section 3 surveys various explanations for the Australia-US productivity gap. Section 4 discusses recent productivity trends and what they might mean for the future. Section 5 summarises and concludes.
2. Conditional convergence
Analysis of productivity trends is inherently difficult. Nonetheless, a number of papers have explored Australia’s recent productivity experience. Many have concentrated on the pick-up in productivity growth during the 1990s and its subsequent moderation (Gruen 2001; Quiggin2001; Parham 2004; Dolman, Lu and Rahman 2006). Others have focused on international comparisons of productivity levels (Davis and Ewing 2005; Rahman 2005). Yet others have included Australia in international comparisons of productivity trends (Skoczylas and Tissot 2005).
It is possible to analyse recent trends in Australia’s productivity growth and international comparisons of productivity levels together by viewing productivity growth as consisting of: Aus
tralia’s productivity catching up to its steady state level relative to the global technological frontier; and an outward movement of the frontier.
One perspective on productivity catch-up is provided by the neoclassical model of economic growth of Solow(1956) and Swan(1956). Although this model is usually written in terms of income, it is straightforward to set it in terms of productivity. In the simplest version of this model, in the steady state, all countries (which are identical) catch up to the same level of productivity, and then grow at the same rate thereafter. A country with a lower initial level of productivity catches up faster.
However, countries are not identical, and the simplest Solow-Swan model is not likely to be a very good description of the world. In more sophisticated versions of the Solow-Swan model, countries have different steady state productivity levels conditional on their circumstances and policy choices. However, these circumstances and policy choices do not affect the steady state growth rate, which is driven by the rate of technological progress. That is, countries catch up to different steady state levels of productivity, and then grow by the same rate thereafter.
In this theoretical world of conditional convergence, the steady state levels of productivity are functions of each country’s circumstances and policy choices. Changes in circumstances or policy choices can change the steady state level of productivity. Because shocks can affect both the frontier and the follower economy, it is useful to think about the steady state level of productivity relative to the frontier.
The Solow-Swan model does not explain technological progress. Even though technological progress occurs endogenously in reality, it is assumed exogenous in the model, and is often described as ‘manna from heaven’. There are other models of economic growth that try to describe technological progress explicitly — Barroand Sala-I-Martin (2003) provide a thorough treatment of the leading models of economic growth. Some of these models do not predict any catch-up. For example, in the constant returns to capital AK model, models with increasing returns to scale, or models with multiple equilibria, countries may not catch up at all, either in terms of level or growth rate. While these models may help analyse the worldwide dynamics of economic growth, they shed little light on future productivity trends. Therefore, this paper relies on the Solow-Swan model with conditional convergence.
As the richest major economy in the world, the United States is often used as a proxy for the global technological frontier. Chart 3 compares Australia’s productivity with that of the US. Australia’s productivity has been between 80 and 85 per cent of that of the US over the past decade or so. This compares with a relative productivity level of between 75 and 80 per cent during the early 1970s.
Chart 3: Australia’s productivity relative to the US
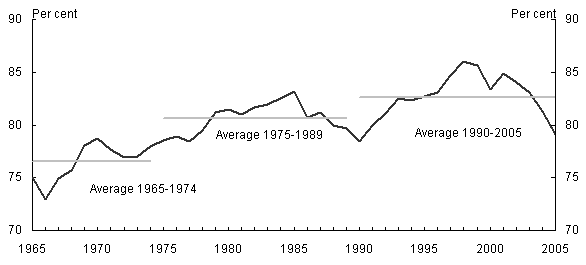
Source: Groningen Growth and Development Centre (GGDC) and The Conference Board Total Economy Database, May 2006.
In the short to medium term, Australia’s productivity might grow faster than that of the US if the actual productivity in Australia is below its steady state level relative to the frontier represented by the US productivity. But with conditional convergence, in the long run, when Australia’s productivity has reached its relative steady state, it should grow by the same rate as that of theUS.
While international comparisons of productivity levels are complicated by substantial statistical and measurement issues (see Box 1), a better understanding of the causes of the Australia-US productivity gap can help shed light on how much further productivity in the Australian economy may be able to catch up with that in the US. This is addressed in the next section.
|
Box 1: Statistical and measurement issues Measuring any economic variable is prone to error and international comparisons are often difficult. These problems are particularly acute for productivity analysis. Productivity data are volatile, cyclical and susceptible to revision. Particularly, hours worked data are strongly affected by cyclical factors. Further, hours worked data are collected in different ways in different countries, making cross-country comparisons particularly difficult. These differences can have large impacts. For example, according to the OECD (2006), about two-thirds of Italy’s 30 per cent GDP per person gap with the US is explained by productivity differences. This estimate follows revisions to Italian labour force data. According to the old data, Italy’s productivity was slightly higher than the US, and labour utilisation (hours worked per person) explained the entire Italy-US income gap (OECD 2005a). Further, it is not easy to measure output and inputs separately in some industries. Methods of measuring output for many industries are different across countries or depend on uncertain links with wages. This is why the ABS focuses on productivity in the market sector, which includes manufacturing and construction but not government administration. Similarly, the US Bureau of Labor Statistics publishes data for the private business sector. Another difficulty in cross-country analysis of productivity levels involves the choice of the exchange rate used to compare national data. Using market exchange rates is problematic for this purpose as they do not always reflect relative price differences between countries. For example, if an industry had lower prices in Australia than in the US, then output per hour worked in that industry would be understated in Australia relative to the US. The standard method used in international comparisons, which this paper also uses, is to convert national currency estimates of productivity into purchasing power parity (PPP) US dollar equivalents using standard PPP exchange rates. This paper uses data from the GGDC because it publishes a time series. The GGDC in turn makes use of the data from the OECD for its publication. The statistical and measurement issues mean that sometimes the two sources of cross-country data might differ. |
3. The Australia-US productivity gap
This section surveys various explanations for the Australia-US productivity gap. The explanations can be classified into three broad groups: relative factor intensities; differences in various policies; and, differences in the geographic and historical context in which the two economies operate. Each of these are analysed in separate subsections.
If most of the productivity gap can be explained, then it might be the case that Australia’s productivity is now near its steady state level relative to the frontier. On the other hand, if a large part of the gap remains unexplained, then this might point to a relatively substantial scope for catch-up. Existing evidence suggests that the productivity gap can at least in part be explained by a combination of differences in: physical capital per worker; human capital; microeconomicpolicies; and, the geographic and historical context in which the two economies operate.
Estimates of possible effects of differences in physical capital per worker, human capital and microeconomic policies suggest that these may explain as much as half of the productivity gap. It is much harder to estimate the effect that geography and history have on the gap. Yet, there are strong reasons to believe that a major part of the Australia-US productivity gap may be due to geography and history. This me
ans that it is unclear how large Australia’s scope for catch-up really is.
3.1 Relative factor intensities
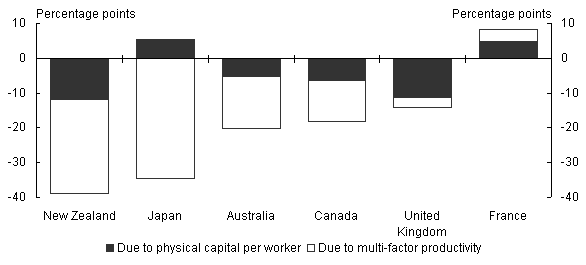
Productivity might be lower in Australia if the capital-labour ratio were lower in Australia. International comparison of the contribution that physical capital per worker makes to productivity is difficult because comparable time series data on the physical capital stock for the whole economy are not generally available. According to Schreyer (2005), about a quarter of the Australia-US productivity gap might be due to differences in physical capital per worker (Chart 4).
Chart 4: Decomposing productivity gap with the US in 2002
Source: Schreyer (2005).
That Australia appears to have less physical capital per worker is not in itself an explanation for the productivity gap. This productivity decomposition does not explain why there are different rates of capital intensity across countries. One plausible answer may be that the factors that explain the productivity gap between the two countries might also explain why Australian firms use less physical capital-intensive production techniques than their American peers.
In addition to physical capital, the economic growth literature also stresses the importance of human capital — the skills and knowledge of individual workers and their ability to use these skills and knowledge in the wider economy — in the production process (Mankiw, Romer and Weil 1992; Lucas 1988). Differences in the average level of human capital may partly explain the productivity gap. The ideal analysis would measure Australia’s human capital stock relative to that of the US. However, it is very difficult to calculate the contribution of human capital in the production process. International comparisons are even more problematic.
Measures of educational attainment are often used as a proxy for human capital. Mankiw, Romer and Weil (1992) use the fraction of working age population that is in secondary school as a measure of investment in human capital. Adult literacy rates, life expectancies at birth and average years of schooling among the adult population are some other measures of human capital used in economic growth literature (Sachsand Warner 1997).
Dowrick (2003) uses the average years of schooling among the working age population as a proxy for human capital. His survey of the literature suggests that if the average years of schooling of young people in Australia were to rise by one year, real GDP would rise by up to 8 per cent over about forty years. This result can be used to think about the effect that a rise in average years of schooling in Australia might have had on GDP.
Average years of schooling in the working age population have been around half a year lower in Australia than in the US over the period 1971 to 1998 (BassaniniandScarpetta 2001). Had Australia instead achieved similar average years of schooling to the US over this period, then Dowrick’s result suggests that by 1998 Australia’s GDP might have been around 2 to 3 per cent higher than was actually recorded. Depending on assumptions about the effect of education on labour force participation, this can give a back-of-the-envelope estimate of the contribution of education to the productivity gap.
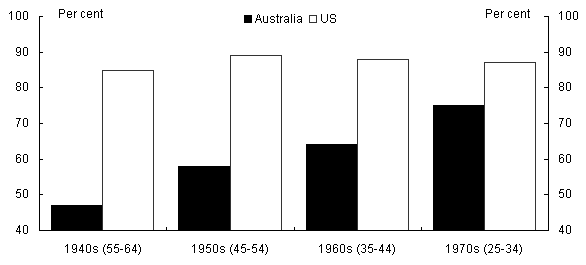
Differences in educational attainment reflect historical choices. The US has traditionally placed more emphasis on the achievement of at least an upper secondary education. Chart 5 shows that whereas five in six Americans of the 1940s generation have at least an upper secondary qualification, fewer than half of Australians from that generation do so.
Chart 5: At least upper secondary attainment by age group in 2003
Source: OECD (2005b).
The Australia-US gap in educational attainment has, however, narrowed in the most recent cohorts (Tunny 2006). As Australia’s relative qualifications profile improves, the productivity gap should narrow in the future. Possibly running counter to this expectation, however, is that educational attainment is not quality-adjusted and there are significant quality differences between countries.
Educational attainment is only a proxy for the stock and accumulation of human capital. The ability to use particular skills and knowledge in the production process, not merely acquiring them, is what really matters for productivity and income. Increasing educational attainment might particularly spur productivity when incentive structures in the economy promote innovation. Unfortunately, the available measures of innovation are as challenging to interpret as the measures of human capital.
Innovation can take many forms, including learning-by-doing, improving management structure, reorganising work practices, adapting technologies to suit the firm’s needs and conducting R&D. For tractability, empirical analysis often focuses on business sector R&D intensity and patents as proxies for innovation. For example, Australian businesses spend about 0.9 per cent of GDP on R&D, compared with 1.9percent of GDP spent by US businesses. It is, however, not clear that the relationship between R&D and innovation more broadly defined is stable across countries, industries, or even firms, implying that R&D is potentially a poor indicator of innovation.
The part of the productivity gap that is not explained by differences in physical or human per worker can be termed the Australia-US multi-factor productivity gap, which captures the efficiency with which all inputs are used in Australia relative to the US. The empirical literature on economic growth suggests that differences in income across countries are primarily caused by differences in the efficiency with which all inputs are used in the production process (Prescott 1998; Easterly and Levine 2001). The idea that the Australia-US productivity gap might be driven by differences in multi-factor productivity across the countries thus accords well with the literature.
3.2 The role of policies
A country’s steady state level of productivity relative to the frontier can be affected by its micro and macroeconomic policies. Alesinaetal(2003) find that regulatory reforms, especially those liberalising firm entry, are likely to spur investment. Nicoletti and Scarpetta (2003) find that in countries with lower entry barriers and fewer state controls, firms adopt best-practice technologies more quickly. Aghion and Howitt (2005) argue that competition, education and macroeconomic policy can in large part explain the US-Europe productivity differences.
Comparing sets of policies across countries is even more challenging than comparing productivity. One approach is to develop indicators of policy stances. These indicators can only give a general impression, and must miss many things. They do, however, provide some basis to work from.
A study of the effects of product market regulations on productivity suggests that further deregulation of Australia’s product market would reduce Australia’s multi-factor productivity gap with ‘the frontier economy’ by 7.5percent (Scarpetta and Tressel, 2002). The authors compute the ‘frontier’ by aggregating over industry-level technology leaders. Different countries are technological leaders in different industries, and no individual country is actually the frontier economy. This makes it difficult to use the authors’ result to quantify the extent to which additional changes to Australia’s product market regulations would further narrow the productivity gap between Austr
alia and the US.
Australia’s regulatory stance in product markets is already quite liberal. Along with those of the United Kingdom, Australia’s economy-wide product market regulations were the least restrictive in the OECD in 2003 (Conway, Janod and Nicoletti 2005). Even if the US is assumed to represent the ‘frontier economy’, which would represent an overestimate of the US level of efficiency, the Scarpetta and Tressel (2002) estimates suggest substantial reforms of Australia’s product market regulations would narrow the productivity gap by only a small amount. That said, further product market reforms could be worthwhile in their own right if they deliver increases in living standards.
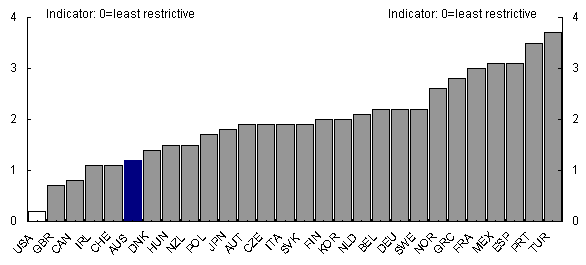
In addition to policies that affect product markets, labour market regulations, particularly employment protection legislation, can also affect productivity. Gust and Marquez (2002) point to a potential link between employment protection legislation and the productivity gap through technology adoption. In their model, more restrictive employment protection legislation leads to slower adoption of new technology, and this widens the productivity gap between the leader and the follower countries. Australia had more restrictive employment protection legislation than the US in 2003 (Chart 6).
Chart 6: Employment protection legislation in the OECD in 2003
Source: OECD (2004).
Scarpetta and Tressel (2002) provide an estimate of the extent to which differences in employment protection legislation might explain the productivity gap. Considering the effect of employment protection legislation on multi-factor productivity in the manner described above, they find that a substantial liberalising of the labour market would reduce Australia’s multi-factor productivity gap with ‘the frontier economy’ by 10.8percent. Acknowledging the difficulties involved in estimating the impact of potential reforms, these estimates suggest that reforms of Australia’s employment protection legislation may reduce the productivity gap by 1 to 2percentagepoints.
3.3 Other explanations
There are strong reasons to believe that part of the Australia-US productivity gap is likely to be explained by geography and history. In contrast to the US, Australia is a long way from the centre of world economic activity. The economic growth literature suggests that over the long term, geography is a major underlying determinant of economic prosperity (SachsandWarner1997). One implication of this literature is that being an island or being remote is likely to lower a country’s income, other things being equal. For example, ReddingandVenables (2002) suggest that Australia’s GDP could have been nearly 7 per cent higher if, rather than being an island, it had land borders with significant trading partners.
Remoteness has affected Australia’s economic history compared with that of the US. The US was fighting its War of Independence long before large-scale settlement commenced in Australia. Australia’s population was about 1.8million in 1870, when with over 40million people the US was already larger than most other countries in the world (Maddison 2001). Even today, Australia’s population is only about one-fourteenth that of the US, even though Australia is nearly four-fifths the size of the US in terms of area.
Partly as a result of nineteenth century history, Australia’s population is concentrated in a few large cities situated hundreds of kilometres apart. Cities are much more closely situated in the US. As a result, while average citizens in the two countries live in cities of similar sizes, the US has nearly eight times as many cities of substantial size as Australia in a given area.
These differences in geography and history mean that Australia misses many of the benefits of proximity that accrue to the US. Such benefits include the economies of scale, intensity of competition, and low transportation costs that are available in more densely populated markets. As a result, these factors might lower Australia’s steady state level of productivity relative to that of the US. Battersby(2006) finds that Australia’s remoteness can possibly explain over two-fifths of the Australia-US productivity gap.
Geographic and historical factors might shape the structure as well as the size of an economy. Some industries are likely to form a bigger part of the overall economy in Australia than in the US. To determine the extent to which the overall productivity differences are related to industry structures — defined as the distribution of total hours worked between industries using the data from the GGDC 60 industry database — US shares of hours worked in each industry are multiplied by Australian productivity in those industries. This results in a productivity level that is similar to that with Australia’s existing industry structure. That is, while industry structure may in part explain Australia’s R&D intensity (Davis and Tunny 2005), it does not appear to explain the aggregate productivity gap. This suggests that the productivity gap between the two countries arises mainly from differences in productivity levels within industries.
International comparisons of industry productivity levels are difficult because of difficulties in comparing values in different currencies. The standard method used in international comparisons, which this paper also uses, is to convert national currency estimates of productivity into purchasing power parity (PPP) US dollar equivalents using standard PPP exchange rates. However, using economy-wide PPP exchange rates is problematic for industry productivity because they may not always fully take into account within-country relative price differences. For example, if an industry had lower relative prices in Australia than in the US, then output and productivity in that industry would be understated in Australia relative to the US, unless industry-specific purchasing power parity exchange rates were used. Such exchange rates are, however, not readily available.
Such difficulties notwithstanding, preliminary analysis suggests that Australia’s productivity level relative to the US differs markedly across industries. Australia’s mining sector, for example, is much more productive than that of theUS, reflecting Australia’s abundant natural resource endowment. On the other hand, according to recent estimates, Australia’s retail and wholesale trades are less than half as productive as their US counterparts (Timmer and Ypma 2006).
There remains much scope for future research to measure the importance of geography and history to the productivity gap. One way to explore this link empirically is to focus on industry- and firm-level data. Another way is to look to the burgeoning literature on the link between economic geography, market structure and policy choices (Syverson 2004, Winters and Martins 2004, and Melitzand Ottaviano 2005 are some examples of this literature). This literature does not specifically focus on Australia, but analysing its implications will illuminate how these factors affect market structure and productivity in Australia relative to the US.
4. Perspectives on productivity prospects
Taking the US as the global technological frontier, the last section examined the Australia-US productivity gap in order to ascertain how much further productivity in the Australian economy may be able to catch up with that of theUS. This section addresses recent productivity trends and what they might mean for the future.
Australia’s productivity is affected by global technological changes. A change in the pace of technological development at the frontier will tend to
change productivity growth across the world. This has happened in the past-productivity slowed, to varying degrees, across the OECD during the 1970s and 1980s (Chart7).
Chart 7: Annual average productivity growth
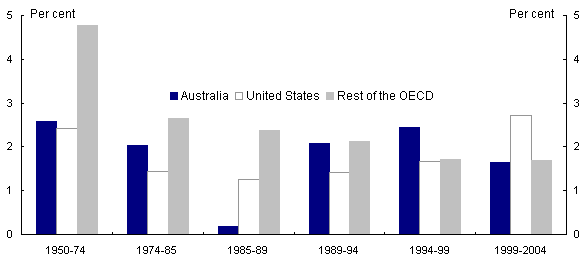
Rest of the OECD are the 22 longest standing OECD member countries excluding Australia and the United States (New Zealand and Iceland data are not available for 1950). Periods are chosen to coincide approximately with the four most recent Australian productivity growth cycles.
Source: GGDC and The Conference Board Total Economy Database, May 2006.
Chart 7 also shows that Australia’s productivity revival of the 1990s preceded that of the US and occurred despite a productivity slowdown elsewhere in theOECD. This suggests that the 1990s productivity revival may have been at least partly due to the easing of Australian domestic constraints on productivity growth, rather than a pickup in the pace of global technological change. There is a broad agreement that policy reforms played a role in Australia’s productivity revival of the 1990s. This is discussed first.
While there has been little change in productivity performance elsewhere in the OECD, productivity in the US accelerated over the past decade. There is a general agreement that information and communication technology (ICT) and related ‘new economy’ innovations have helped productivity growth in both Australia and the US over the past decade. The second part of this section discusses possible impacts of these ‘neweconomy’ innovations on the productivity gap.
The final part of this section considers the challenge of estimating plausible future rates of productivity growth at the frontier.
4.1 Reforms and Australia’s productivity
The Australian economy has been the subject of dramatic changes in policy settings through a series of broad and deep macroeconomic and microeconomic reforms during recent decades.
Key macroeconomic reforms include: liberalising Australia’s foreign exchange regime; a medium-term inflation target through an independent central bank; and adopting a fiscal policy that achieves budget balance over the economic cycle. Key microeconomic reforms include: liberalising Australia’s foreign trade, foreign investment, financial markets and workplace relations regimes; tax reform, including reforms of the indirect tax system and targeted incentives to work and save; corporate law reform; a broad-ranging National Competition Policy agenda; and workplace relations reforms.
These reforms increased competition and gave Australian firms a more international focus. Competition encouraged both a more efficient allocation of resources and a more vigorous pursuit of productivity improvement through the adoption of new technologies. At the same time, more flexible labour markets allowed the reorganisation of work practices to take advantage of improvements in technology and skills, and more flexible financial markets gave new, developing industries access to the capital they required.
An alternative explanation for the strong productivity performance since the early 1990s is that the economy has avoided a recession in these years. However, the macroeconomic stability of the past decade has been achieved despite the Asian financial crises, global recession of 2001, a severe drought, sharp rises in the terms of trade and high oil prices. Comparing the current terms of trade boom to the terms of trade boom of the 1970s, Gruen (2006) shows how the reforms — a market-determined exchange rate, a credible medium-term inflation targeting regime implemented by the Reserve Bank, and more decentralised wage-setting arrangements — have helped ensure macroeconomic stability in recent years.
As a result of the reforms, the Australian economy is now more open, competitive and flexible, allowing it to take better advantage of future technological developments. However, the reforms themselves are likely to have lifted productivity levels in specific industries, rather than increasing the economy-wide productivity growth rate.
While Australia may well be the technological leader in some industries, most notably mining, Australian firms are much more likely to be technology followers for most goods or services produced domestically. Therefore, Australia’s domestic economic reforms by themselves are not likely to affect the movement in the global technological frontier. Rather, it is much more likely that these reforms have increased Australia’s steady state level of productivity relative to the frontier.
4.2 The ‘new economy’
After nearly two decades of relatively weak growth, the US productivity has grown at a rapid pace over the past decade. This rapid productivity growth accompanied a very long expansion during the late 1990s and a very mild recession (in terms of output, though not in terms of employment) in the early 2000s. Noting the strong productivity growth and increased macroeconomic stability, many commentators have dubbed the recent US economy the ‘neweconomy’.
A number of explanations have been offered for the ‘neweconomy’ productivity growth in the US. Increased investment in ICT, and rapid technological progress in that sector, were two early explanations (Jorgenson and Stiroh 2000; Olinerand Sichel 2000). However, the US was not the only country to see a rapid expansion in ICT investment — other developed countries also invested heavily in these technologies in the 1980s and 1990s. Yet, with a few exceptions including Australia, productivity growth in other advanced countries has not increased recently (Skoczylas and Tissot 2005).
This suggests that while the ICT revolution helped spur the productivity acceleration, ICT investment does not lead mechanically to better productivity performance. Forexample, productivity levels in Europe have fallen behind that of the US after 1995. US-Europe differences in productivity growth do not appear to have been particularly large in the ICT-producing sectors. Rather, the US advantage has been most evident in the ICT-using sectors such as wholesale and retail trades (Van Ark, Inklaar and McGuckin, 2003).
The productivity surge in the US retail trade sector can be attributed almost entirely to the entry of more productive firms that displaced much less productive existing retailers (Foster, Haltiwanger and Krizan2002). The entering firms were usually large discount operations — the ‘big-boxes’ like Wal-Mart. These stores are more productive because of their size, which allows them to better exploit economies of scale, more efficiently use warehousing, better manage inventories and implement other innovative operation practices (Gordon2004a).
Gordon (2004a) argues that differences in ICT use per se do not explain why USproductivity has grown strongly over the past decade while Europe’s has not. Rather, he attributes weaker productivity growth in Europe’s wholesale and retail industries to regulatory barriers and land-use regulations. For example, complex licensing is required to convert an existing building for retail use in Germany, while in France it takes ten administrative procedures and nearly 200days to register any sizable business property, even when no rezoning is required (Bailyand Kirkegaard 2004).
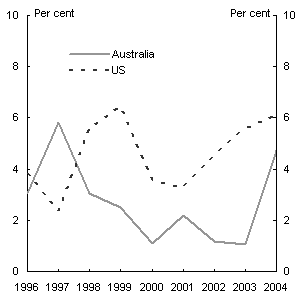
Over the 1990s, Australia was among the world’s leading users of ICT (OECD2005c), and this played an important part in the Australian productivity surge of the 1990s (Simon and Wardrop 2002; Productivity Commission 2004; Revesz, Anderssen and Boldeman 2005). As in the US, wholesale and retail trades in Australia benefited heavily from the use of ICT-related innovations during the 1990
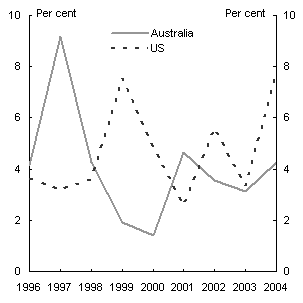
s (Gruen 2001). Australian wholesale and retail industries also benefited from regulatory reforms, adoption of new technology, and competition and rationalisation in the industry (Johnstonetal2000). Nonetheless, recent productivity growth in retail trade has been weaker in Australian than in the US (Chart 8a).
Chart 8: Productivity growth in wholesale and retail trade
|
Chart 8a: Retail trade |
Chart 8b: Wholesale trade |
|
|
|
Source: ABS for Australia (year ending 30 June); the Bureau of Labor Statistics for the US.
It appears that Australian retailers have not adopted the ‘big-box’ format to the same extent as the US. It may be that Australia’s geography and size make the integration of supply chain and better inventory management harder, and make the adoption of the ‘big-box’ format less profitable.
A large part of the productivity gains accrued to the US over the past decade comes from the adoption of the ‘big-box’ format. If Australia’s economic geography makes it harder for the Australian industries to realise these benefits, then a key implication is that, as a result of the ‘new economy’ innovations, Australia’s steady state level of productivity might have fallen relative to the frontier, even though in absolute terms, Australia’s productivity has benefited from these innovations.
While this may be dismaying, there may also be grounds for optimism regarding the impact ‘new economy’ innovations might have on the Australia-US productivity gap. Recent productivity growth in Australia’s wholesale trade compares well with the US growth rates (Chart 8b). The ICT-related innovations — cellular telephony and satellite navigation for example — allowed Australian wholesale firms to move away from storage-based operations to transport-based operations and thus realise stronger productivity performance (Johnstonetal2000). More broadly, ICT-related new economy innovations might actually lift Australia’s steady state level of productivity relative to the US by removing some of the disadvantages of operating in a small market that Australian firms face.
The above discussion suggests that there are reasons to believe that the ICT-related ‘new economy’ innovations might help Australia narrow the productivity gap with the US, just as there are other reasons to argue that these innovations might widen the gap. While it is not possible to determine which of these will dominate, ongoing reviews of existing structural policies are needed to ensure that Australian firms can adopt innovations that are profitable for them.
4.3 Projecting productivity growth
Regardless of how the ICT-related innovations impact on the evolution of the Australia-US productivity gap, Australia’s productivity growth in the long run will be primarily determined by the rate at which productivity grows in the ‘frontier’ economy. This paper has used the US as a proxy for the frontier. How fast might US productivity grow over the coming decades?
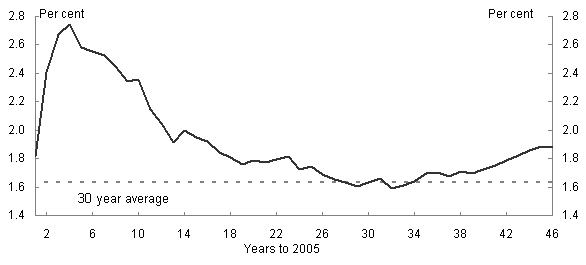
One simple way to answer this question is to use the same methodology as used in the IGR for projecting Australia’s productivity growth — namely to assume that, over the medium term, the productivity growth rate will equal its past thirty year average. Of course, the choice of averaging over the past thirty years is arbitrary, and the length of time over which the averaging is undertaken affects the outcome to some extent (Chart 9).
Chart 9: Average annualised rate of productivity growth in the US
Source: GGDC and The Conference Board Total Economy Database, May 2006; the authors’ calculation.
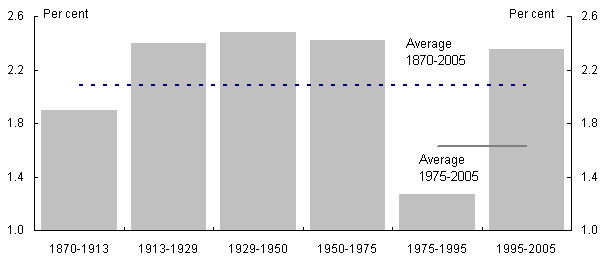
Annual productivity growth in the US has averaged 1.6per cent in the three decades to 2005. This annual average rate, however, masks the recent acceleration in USproductivity — in the decade to 2005 it was 2.4 per cent compared with 1.3 per cent between 1975 and 1995 (Chart 10).
Chart 10: Long-run productivity growth in the US
Source: GGDC and The Conference Board Total Economy Database, May 2006 and Gordon(2004b).
Even with the benefit of decades of hindsight, the reasons for the 1970s productivity slowdown are still not clearly understood. Given this, it is not possible to form a confident assessment about whether such a slowdown will be repeated in the future.
That said, a number of studies, using various econometric methods, suggest that USproductivity might grow by an annual rate of about 2-2percent over the medium term (Gordon 2003; Jorgenson, Ho and Stiroh 2004). The USCongressional Budget Office (2006) assumes annual productivity growth of 2.2per cent between 2008 and 2011. This compares with the long-run annual average productivity growth rate of 2.1per cent (Chart 10).
The past thirty year average points to a medium-term annual growth rate of 1.6per cent for the USproductivity. The 2-2 per cent annual rates projected by the studies cited above provide an upside risk, and the actual annual growth rate of 1.3per cent recorded between 1975 and 1995 provide a downside risk, to this simple assumption.
If it is assumed that US productivity will grow by 1.6 per cent per year over the medium term, then the IGR assumption for Australia of 1percent would imply that Australia would narrow the productivity gap with the US by a further 5percentage points by the mid-2040s.
The IGR assumption of annual productivity growth of 1 per cent is based on the thirty year average to 2001-02. Those thirty years of course include the period of rapid productivity growth in the late 1990s. Ongoing policy reforms might therefore be seen as implicit in the IGR assumption of productivity growth.
5. Conclusion
This paper has argued that in order to analyse Australia’s productivity prospects, two issues need to be addressed: how far is the Australian productivity from its steady state relative to the frontier; and, how fast is the frontier moving?
Over the past four decades, Australia’s productivity has been mostly between 75and 85 per cent of that of the US. Australia’s GDP per person has been between 70 and 80 per cent of that of the US over this period. Strong productivity growth in the 1990s resulted in Australia narrowing the productivity, and income, gap.
A range of micro and macroeconomic reforms over the past two decades have contributed to Australia’s strong productivity performance in the 1990s. A survey of the existing literature suggests that Australia could potentially narrow the productivity gap by: further improvements in human capital, as better educated workers assume a larger role in the workforce; continued vigour in competition policy; and, improving the functioning of labour markets.
Differences in the geographic and historical contexts in which the Australian economy operates are likely to inhibit Australia’s ability to fully close the gap with the US level of productivity. These very same geographic and historical facto
rs may also determine how technological developments affect Australia’s steady state productivity level relative to the frontier. For example, technological progress might help Australian firms overcome some of the disadvantages of operating in a small market, and as a result, the productivity gap might narrow. On the other hand, if small market size inhibits Australian firms from fully utilising the benefits of some new technology, this will widen the productivity gap. Regardless of which of these outcomes is realised, ongoing review of existing structural policies will be required for Australian firms to continue to develop and adopt innovations that are profitable for them and the economy as a whole.
While, in a number of areas, Australian firms and policies will contribute to moving the global technological frontier outwards, across the economy as a whole the conditional convergence framework used in this paper is probably a reasonable representation of reality. This framework implies that policy reforms in Australia by themselves are not likely to increase Australia’s productivity growthrate over the long term. Rather, reforms are likely to improve Australia’s steady state level of productivity relative to the frontier, while, in the long run, Australia’s productivity growth will be determined by technological progress at the frontier.
Aghion, P and Howitt, P 2005, ‘Appropriate growth policy: a unifying framework’, Paper presented to the OECD Conference on Convergence, January 2006.
Alesina, A, Ardagna, S, Nicoletti, G and Schiantarelli, F 2003, ‘Regulation and investment’, NBER working paper 9560.
Baily, M and Kirkegaard, J 2004, ‘The landlocked continent’, The McKinsey Quarterly, December.
Barro, R and Sala-i-Martin, X 2003, Economic Growth: Second Edition, The MIT Press.
Bassanini, A and Scarpetta, S 2001, ‘Does human capital matter for growth in OECD countries? Evidence from pooled mean-group estimates’, OECD Economic Department working paper282.
Battersby, B 2006, ‘Does distance matter? The effect of geographic isolation on productivity levels’, Treasury working paper 2006-03, Australian Treasury, May.
Commonwealth of Australia 2002, Budget Paper No. 5, Intergenerational Report 2002-03, Commonwealth of Australia, Canberra.
Congressional Budget Office 2006, The budget and economic outlook: fiscal years 2007to 2016, The United States Congress, Washington DC.
Conway, P, Janod, V and Nicoletti, G 2005, ‘Product market regulation in OECD countries: 1998 to 2003’, OECD Economic Department working paper 419.
Davis, G and Ewing, R 2005, ‘Why has Australia done better than New Zealand: Good luck or good management?’, Treasury working paper 2005-01, Australian Treasury, January.
Davis, G and Tunny, G 2005, ‘International comparisons of research and development’, Economic Roundup, Spring 2005, pp63-82.
Dolman, B, Lu, L and Rahman, J 2006, ‘Understanding productivity trends’, Economic Roundup, Summer 2006, pp35-52.
Dowrick, S 2003, ‘Ideas and education: level or growth effects’, NBER working paper 9709.
Easterly, W and Levine, R 2001, ‘It’s not factor accumulation: Stylized facts and growth models’, World Bank Economic Review, 15(2), pp 177-219.
Foster, L, Haltiwanger, J and Krizan, C 2002, ‘The link between aggregate and micro productivity growth: evidence from retail trade’, NBER working paper9120.
Gordon, RJ 2003, ‘Exploding productivity growth: context, causes, and implications’, Brookings Papers on Economic Activity, 2, pp 207-98.
Gordon, RJ 2004a, ‘Why was Europe left at the station when America’s productivity locomotive departed?’, NBER working paper 10661.
Gordon, RJ 2004b, ‘Two centuries of economic growth: Europe chasing the American frontier’, NBER Working Paper 10662.
Gruen, D 2001, ‘Australia’s strong productivity growth: will it be sustained?’, Reserve Bank of Australia Bulletin, February, pp62-69.
Gruen, D 2006, ‘A tale of two terms-of-trade booms’, Economic Roundup, Summer, pp 21-34.
Gust, C and Marquez, J 2002, ‘International comparisons of productivity growth: the role of information technology and regulatory practices’, Board of Governors of the Federal Reserve Systems International Finance Division paper 727.
Johnston, A, Porter, D, Cobbold, T and Dolamore, R 2000, Productivity in Australia’s wholesale and retail trade, Productivity Commission, Canberra.
Jorgenson, D and Stiroh, K 2000, ‘Raising the Speed Limit: U.S. Economic Growth in the Information Age,’ Brookings Papers on Economic Activity, 1, pp125-211.
Jorgenson, D, Ho, M, and Stiroh, K 2004, ‘Will the US productivity resurgence continue?’, Current Issues, Federal Reserve Bank of New York, December, pp 1-7.
Lucas, RE 1988, ‘On the mechanics of economic development’, Journal of Monetary Economics, vol 22, pp 2-42.
Maddison, A 2001, The world economy: a millennial perspective, OECD, Paris.
Mankiw, G, Romer, D and Weil, DN 1992, ‘A contribution to the empirics of economic growth’, Quarterly Journal of Economics, vol 107, pp 407-37.
Melitz, MJ and Ottaviano, G 2005, ‘Market size, trade and productivity’, NBER working paper 11393.
Nicoletti, G and Scarpetta, S 2003, ‘Regulation, productivity and growth: OECD evidence’, OECD Economic Department working paper 347.
OECD 2004, Employment outlook, OECD, Paris.
OECD2005a, Going for growth, OECD, Paris.
OECD 2005b, Education at a Glance: OECD Indicators 2005, OECD, Paris.
OECD 2005c, OECD factbook: economic, environmental and social statistics, Paris.
OECD2006, Going for growth, OECD, Paris.
Oliner, S, and Sichel, D 2000, ‘The resurgence of growth in the late 1990s: is information technology the story?’, Journal of Economic Perspectives, vol 14, pp3-22.
Parham, D 2004, ‘Sources of Australia’s productivity revival’, The Economic Record, vol80, no. 249, pp239-57.
Prescott, E 1998, ‘Needed: A theory of total factor productivity’, International Economic Review, 39(3), pp 525-51.
Productivity Commission 2004, ICT use and productivity: a synthesis from studies of Australian firms, Commission research paper, Canberra.
Productivity Commission 2005, Review of National Competition Policy reforms, report number 33, Ausinfo, Canberra.
Quiggin, J 2001, ‘The Australian productivity miracle: a sceptical view’, Agenda, 8, pp333-48.
Rahman, J 2005, ‘Comparing Australian and United States productivity’, Economic Roundup, Autumn 2005, pp27-45.
Redding, S and Venables, A 2002, ‘The economics of isolation and distance’, Mimeo, Commonwealth Secretariat, London.
Revesz, J Anderssen, H & Boldeman, L 2005, ‘Productivity growth in service industries’, Department of Communications, Information Technology and the Arts occasional economic paper, April.
Sachs, JD and Warner, AM 1997, ‘Fundamental sources of long-run growth’, American Economic Review, vol 87(2), pp 184-88.
Scarpetta, S and Tressel, T 2002, ‘Productivity and convergence in a panel of OECD industries: do regulations and institutions matter?’, OECD Economic Department working paper 342.
Schrey
er, P 2005, ‘International comparisons of levels of capital input and productivity’, paper presented to the OECD/Ivie/BBVA workshop on productivity measurement, Madrid, October.
Simon, J and Wardrop, S 2002, ‘Australian use of information technology and its contribution to growth’, Reserve Bank of Australia discussion paper 2002-02.
Skoczylas, L and Tissot, B 2005, ‘Revisiting recent productivity developments across OECD countries’, BIS working papers no 182, Bank for International Settlements, Basel, September.
Solow, R 1956, ‘A contribution to the theory of economic growth’, Quarterly Journal of Economics, 70:1, pp 65-94.
Swan, TW 1956, ‘Economic growth and capital accumulation’, Economic Record, 32:2, pp 334-61.
Syverson, C 2004, ‘Market structure and productivity: A concrete example’, Journal of Political Economy, vol 112, no 61, pp 1181-222.
Timmer M and Ypma G 2006, ‘Productivity levels in distribution trades: a new ICOP Dataset for OECD countries’, GGDC research memorandum.
Tunny, G 2006, ‘Educational attainment in Australia’, Economic Roundup, Autumn 2006, pp1-9.
Van Ark, B, Inklaar, R and McGuckin, RH 2003, ‘ICT and productivity in Europe and the US: where do the differences come from?’, CESifo Economic Studies, vol49 (3), pp 295-318.
Winters, LA and Martins, PMG 2004, ‘When comparative advantage is not enough: business costs in small remote economies’, World Trade Review, vol 3, no3, pp 347-83.
