Graeme Davis and Robert Ewing
Treasury Working Paper
2005 — 01
January 2005
This paper is based on a presentation to the Productivity: Performance, Prospects and Policy workshop held in Wellington, New Zealand on 29July2004. The authors are grateful to DavidGruen, PaulO’Mara, PaulLindwall, DeanParham, and BenDolman for discussions and suggestions. The views expressed in the paper are those of the authors and not necessarily those of the Treasury or the Government.
Abstract
The relative performance of the Australian and New Zealand economies has been the subject of many questions. Why, if New Zealand reformed so much, has the Australian economy performed so much better? Why are average incomes in Australia so much higher than in New Zealand?
This paper explores some of the potential explanations for the different levels of labour productivity in the two countries and attempts to quantify the effects on productivity of a range of possible causal factors. Potential causal factors examined include the level of education, Research and Development (R&D) intensities, regulatory policy differences, the interaction of productivity with participation, and the potential impact of geography, location, and population.
It is the last of these possible explanations, the impact of geography, location and population that would seem to have the most potential to explain the differences in labour productivity levels that are currently observed. By comparing productivity levels in New Zealand with those of the Australian States we can estimate the potential magnitude of such effects. We find that the difference in productivity levels between Australia and New Zealand is not outside reasonable expectations once these factors are taken into account.
JEL Classification Numbers: N17, N37, O47
Keywords: Australia, New Zealand, Productivity, Economic Reform, Geography, Remoteness
Contents
1. Introduction
2. Australia’s performance is not an accident
2.1 Policy change
3. How big are the differences with New Zealand
4. What might explain these differences?
4.2 Employment and hours worked
5. Conclusion
1. Introduction
In this paper we ask if the differences between Australia’s measured productivity and that of New Zealand can be thought of as simply luck or good management.
The answer to this question is: not simply luck. Australia’s recent economic performance has not happened by accident. Rather it is the outcome of a concerted policy effort to lift the performance of the economy.
The first section of this paper identifies some of the policy reforms and discusses some of the results including the differences with the United States productivity levels.
But New Zealand too has been through a substantial reform process. Why does the productivity gap with Australia remain and appear to have increased in the 1990s? The second section of this paper briefly discusses some of the differences in productivity between the two countries.
Measuring differences in productivity between countries is never a simple exercise. There are many methodological and measurement issues that mean that such measures can only be thought of as rough indicators of relative performance. For this reason the focus is often on comparisons of rates of growth. This paper will focus attention on relative levels of productivity and what might explain those.
There are a number of explanations for such differences that have been suggested. The third section of the paper looks at some of these.
Firstly the paper looks at some policy indicators. There do not appear to be substantial differences of a magnitude that could be expected to explain the differences in measured performance.
Secondly, the possible impact of labour utilisation is explored. While it may have only a small impact on the measured productivity gap between Australia and New Zealand, changes in labour utilisation may mean that New Zealand’s decline in relative labour productivity may be overstated.
A third factor often considered important for productivity levels is the ability to generate and use knowledge. This might be reflected in differences in the stock of human capital or in the extent of innovation-related activities. This may be a contributor to the productivity gap but it is unclear.
Finally, geography, location and population density have often been considered in looking at the New Zealand and Australian economies. To what extent might they explain the differences we see? By comparing productivity levels in NewZealand with those of various Australian States we can identify the potential magnitude of such effects. We find that the productivity level differences between the Australian states and New Zealand are not outside reasonable expectations once these factors are taken into account.
2. Australia’s performance is not an accident
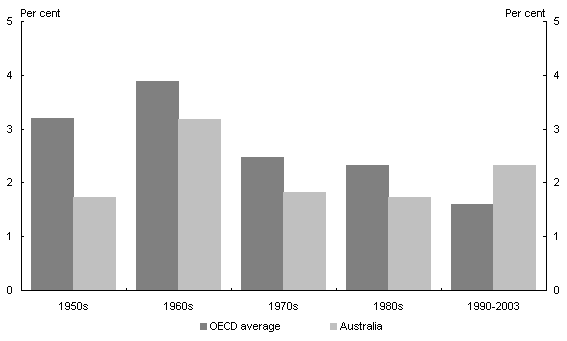
Australia experienced relatively poor performance compared with the OECD for the majority of the second half of the last century in terms of both incomes and productivity.
Chart 1: GDP Per Capita Average Annual Growth Rate
Source: Authors calculations based on Groningen Growth and Development Centre and The Conference Board, Total Economy Database, February 2004,
http://www.ggdc.net. OECD average calculated for membership pre 1994.
In the 1960s, Australian GDP per capita increased by 3.2 per cent a year on average. In the 1970s and 1980s, GDP per capita growth was much lower than in the 1960s. The 1990s, however, were also years of relatively high growth, though not as high as the 1960s.
But this picture of strength in the 1960s is rather misleading. The 1960s were years of exceptionally buoyant growth in most of the industrialised world.
In fact, the past decade was the only one in which Australia’s rate of growth of GDP per capita exceeded the OECD average. It was against this backdrop of steadily declining relative incomes up to the start of the 1990s, and evidence of significant payoffs from reforms since then, that policy in Australia evolved.
2.1 Policy change
The 25 per cent across-the-board tariff cut in 1973, while done for both microeconomic efficiency and macroeconomic-stabilisation reasons, arguably marked the beginning of microeconomic reform.
At the end of 1983 the exchange rate was floated, and capital controls were lifted. Financial markets were liberalised and taxation arrangements began to be addressed. Both of these areas have been subject to more or less cont
inual reform since the early to mid 1980s including very substantial reforms in both areas in the last few years. Tariffs on all products have fallen steadily since the mid-1980s. In the late 1980s, and continuing in the 1990s, non-traded sectors of the economy such as transport, communication and utilities were targeted for reform.
From the late 1980s, and again in the late 1990s, labour markets and industrial relations, together with education and training, were also subject to considerable reform.
In 1995, the sectoral approach to microeconomic reform was complemented by National Competition Policy. National Competition Policy obliges Commonwealth and State governments to review existing legislation, and to assess proposed legislation against a broad public interest test and to ensure competitive neutrality between public and private sector providers. It also introduced a national access regime for essential infrastructure services.
The second half of the 1990s was a period of wide-ranging microeconomic reform embracing:
- further financial sector reforms, particularly the creation of a system of prudential regulation that establishes a single regulator;
- a comprehensive programme of corporate law reform, implementing a corporate governance framework, and financial reporting and disclosure regimes;
- the waterfront;
- substantial further reform of the industrial relations system and the labour market more broadly; and
- a major programme of tax reform that, in addition to its complete overhaul of the indirect tax system, targeted incentives to work and save.
In summary this represents a concerted policy programme designed to improve the functioning of the Australian economy.
This programme was supported by reforms to the operation of macroeconomic policy.
It has been argued that macroeconomic policy lacked clear frameworks to handle the instabilities of the 1970s and 1980s and that this contributed to the recession in 1990-91. It was not until 1993 or 1994, building on reforms pioneered in New Zealand, that the Australian monetary policy framework was consolidated into a medium-term inflation-targeting regime.1 This was codified into the Statement on the Conduct of Monetary Policy, agreed between the Treasurer and the Governor of the Reserve Bank in August 1996, which formalised the operational independence of the Reserve Bank in implementing monetary policy to achieve the Government’s inflation goals. This Statement included a commitment by the Reserve Bank to hold inflation between 2 and 3percent on average, over the course of the economic cycle.
The Government also announced its intention in 1996 to establish a new fiscal framework. The Charter of Budget Honesty Act 1998 states that fiscal policy should be directed at maintaining the ongoing economic prosperity and welfare of the people of Australia, and therefore should be set in a sustainable medium-term framework. The primary objective of the fiscal strategy is to maintain budget balance, on average, over the course of the economic cycle.
Moving these macroeconomic policies onto a medium-term footing improved the climate for quality investment decisions and hence the potential for productivity growth.
The benefits of Australia’s policy reform programme took some time to arrive. Certainly, the benefits were not much in evidence in the second half of the 1980s.
Over the 1990s, however, Australia was one of the few OECD countries to experience significant productivity improvements.
By the second half of the 1990s Australia’s average annual labour productivity growth was more than double that recorded in the late 1980s and had risen to rates last seen in the 1960s. The difference was that in the 1990s Australia’s productivity growth exceeded the OECD average; whereas in the 1960s, productivity growth was high everywhere and Australia’s growth was below the OECD average.
But Australia’s GDP per capita and productivity levels remain below the best in the world.
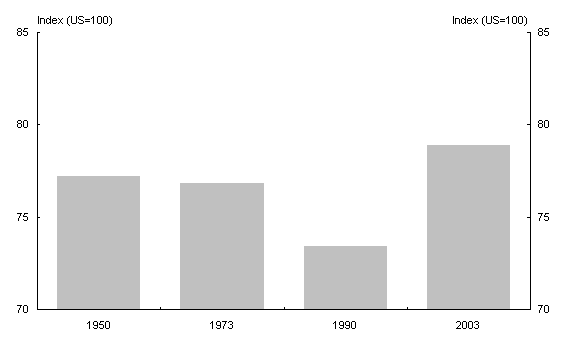
Chart 2 shows Australia’s GDP per capita relative to the United States. In 2003, GDP per capita and productivity levels were just below 80 per cent of those in the United States — slightly above the relative performance in 1950. But the relative performance in 1990 was worse.
Chart 2: Australian GDP Per Capita level relative to United States
Source: GDP measured using purchasing power parity exchange rates taken from Groningen Growth and Development Centre and The Conference Board, Total Economy Database, February 2004,
Australia’s 21percent level gap in per capita incomes with the United States is mostly explained by productivity (18percentagepoints), and only slightly by participation and demographic factors (4percentagepoints) (see Chart 3).2
Chart 3: Labour Utilisation and Productivity Levels, 2003
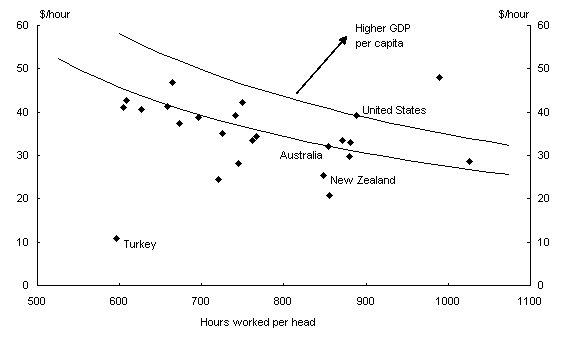
Source: Authors calculations based on Groningen Growth and Development Centre and The Conference Board, Total Economy Database, February 2004,
http://www.ggdc.net. Productivity figures are in 1999 PPP adjusted $US, and hours worked are on an annual basis.
This is very different to the situation of many of the countries in Chart 3 with higher productivity levels than the United States. In many of these countries, income per capita is lower than in the United States, despite higher (measured) productivity levels, reflecting population and participation factors.
In summary, Australia has experienced a significant improvement in productivity performance over the past decade at least in part due to a concerted effort to improve the operation of the economy. The hard work has paid dividends, with hopefully more to come.
2.2 But what has really changed?
If all countries had the same attributes we could expect productivity levels over time to converge. But this is not the case. Differences in factors which normally change slowly such as location relative to global economic activity, fundamental institutions such as the rule of law, the level of education across the population, and the value of natural or historical endowments per head of population can be expected to lead to sustained differences in the levels of labour productivity.
What does this mean for Australia? On the one hand, resources will be allocated to activities where distance is not a barrier or where Australia’s advantages are clear. This applies, for example, in some areas of mining and agriculture, and potentially some areas of the international trade in services. On the other hand, it also means that resources will be allocated to activities where distance confers natural protection by decreasing the competitiveness of imported goods or services. The result is a range of goods and services produced in Australia in markets either too small to generate economies of scale or with littl
e effective competition. As a consequence, Australia's relative levels of productivity may be behind global best practice in these areas, and hence aggregate productivity levels behind the global frontier.
Improved productivity performance might imply a more rapidly expanding global frontier, but this would not see improved relative performance. Alternatively, it might be a result of changes that mean these slowly changing factors are less of a barrier to approaching the global frontier. Equally, it might indicate a more effective use of resources within these constraints.
Australia’s most recent productivity surge started earlier than the surge in the United States and accelerated to a higher rate. Recent estimates indicate that increased investment in the use of information and communication technologies made an important contribution to productivity growth in Australia, slightly more so than in the United States. The real story for Australia, however, has been in the growth of the residual part of labour productivity growth, so-called ‘multi-factor productivity growth’. This growth was far more rapid in Australia than in the United States and captures the increased output from better combining labour and capital inputs. This reflects factors such as improving management and work practices within industries and resource reallocation into more productive activities (see Table 1).
Table 1: Productivity Acceleration: Australia and the United States

(a) Growth in 1993-94 to 1999-00 minus growth in 1988-89 to 1993-94.
(b) Growth in 1992 to 2000 minus growth in 1986 to 1992.
(c) MFP growth for the US includes the contribution to labour productivity growth from labour quality.
Source: Parham (2002).
Australian economic reform has been important in much of the increase in multi-factor productivity growth. Reform encouraged both a more efficient allocation of labour and capital, and a competitive environment which drove workplace change within industries. These changes were conducive to the uptake of information and communication technologies, in both new and established plants. These technologies, in turn, contributed to the ongoing re-design of existing business processes. Australia was one of the leading economies in the OECD in using these technologies to achieve multi-factor productivity gains (see Chart 4).
Chart 4: Change in ICT investment and MFP acceleration, 1990-2000
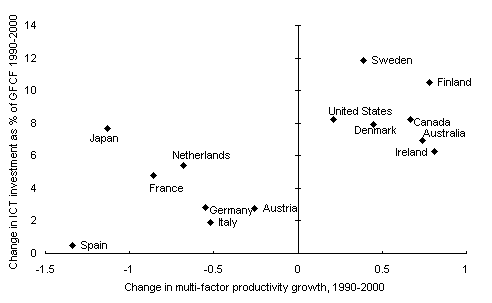
Source: OECD (2003), OECD (2002).
All of this suggests that policy reforms helped to reduce the gap with the frontier by encouraging competition in markets and hence more effective resource allocations.
Technology change may also have benefited Australia more than some other countries. This could have happened in a number of ways.
- ICT changes may have made it easier to solve some of the small market problems within the domestic economy. For example, better systems for managing stock and logistics may have reduced the cost associated with a lack of scale and density.
- Previously non-traded or hard-to-trade products and services became easier to trade across distance, increasing effective market size and competition.
- The effective knowledge stock available to Australian firms may have increased more than for firms in other countries as the ability to communicate and access knowledge over distance has improved.
2.3 Why does the gap with the US remain?
The rapid economic growth of Asia over recent decades has helped reduce the average distance from Australia to international markets. Falling international transportation costs have also helped, by lowering the costs of Australia's trading with the rest of the world.
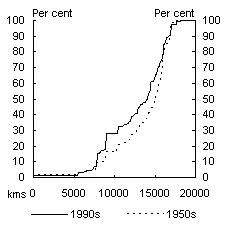
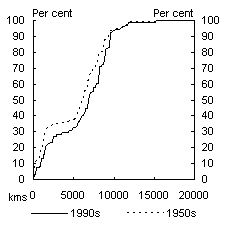
Nevertheless, the costs of trading with major international markets remain a key barrier for Australia relative to other countries. For example, from the 1950s to the 1990s, the proportion of world GDP within a 10,000-kilometre circle from Sydney increased from some 16percent to 28percent. But for London, the same sized circle enclosed 94percent of world GDP in both the 1950s and the 1990s (Chart5). By this measure, the only OECD country in the world more remote from the bulk of global GDP than Australia is NewZealand.
Chart 5: Distance to the World’s GDP from Australia and the United Kingdom
|
Australia(a)
|
United Kingdom(a)
|
(a) These figures show the percentage of world GDP (measured in purchasing power parity terms) falling within circles of different radii (from 0 to 20,000 kilometres) from Sydney and London.
Source: Treasury calculations based on data from Maddison (2001).
Distances between domestic markets may also constitute an economic hurdle. Australia is the world’s sixth largest country in area, yet has a relatively small population of around 20million. No two cities in Australia with a population of over onemillion are closer than 600kilometres, and Perth is 2,400kilometres from its nearest Australian regional market. In contrast, California has a population of around 34million in an area around one-twentieth the size of Australia, with its population concentrated between San Diego and Sacramento— a distance of some 800 kilometres (McLean and Taylor, 2001).
Technological change and economic reforms have made a difference domestically. Since 1965, road freight rates have almost halved in real terms while rail freight rates have fallen by two-thirds (Chart 6). Since 1990, real coastal shipping rates to and from Perth have fallen by 40percent and real air rates within Australia have fallen by 25percent.
While neither international nor national distances to markets are as costly to Australia as they once were, geographic remoteness is still significant.
Chart 6: Australian Real Road and Rail Transport Costs 1964-65 to 2000-01
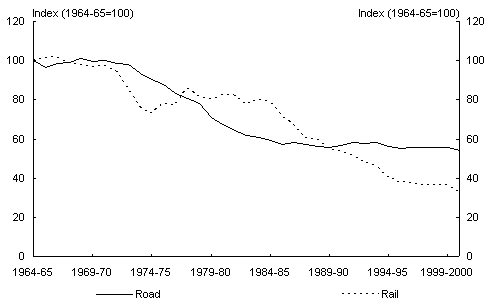
Source: Bureau of Transport and Regional Economics (2002).
The short story then is that policies that distorted resource allocation and reduced competitive pressures acted to reduce pr
oductivity below the long run level that Australia might expect to achieve relative to the United States with appropriate policy. A concerted policy reform effort has seen Australia’s measured productivity level move back towards the United States benchmark. And it is possible that technological change has meant Australian productivity levels can now move closer to the United States than previously was the case.
It is likely that the benefits from the technological advances we have already seen will take some time to work fully through the economy. Information and communication technologies could offer considerable medium-term contributions to productivity growth as they gradually facilitate further organisational change and new business practices. In this respect, they resemble earlier ‘general purpose technologies’ such as steam in the 18th and 19th centuries and electricity in the 19th and early 20th centuries. As experience with those earlier technologies has shown, applications can take several decades to disperse through the economy (Commonwealth Treasury, 2001 and DeLong, 2002, p 25).
3. how big are the differences with New Zealand?
New Zealand has also seen a sustained period of economic reform. What might explain the differences we now see? Before trying to answer that question it is helpful to have an idea of the magnitude of the differences.
To keep the exercise within reasonable bounds of complexity we look at differences in measured output per hour worked. In 2001 New Zealand levels of labour productivity were just under 80percent of Australian levels.
It has been argued that cross-country comparisons of labour productivity levels are accurate to approximately 3percent of US productivity (van Ark, 2003).
4. What might explain these differences?
In this section we attempt to estimate the potential impact of a range of factors on relative productivity levels.
A number of factors have been identified as potentially explaining the differences in productivity between Australia and New Zealand. These include:
- policy differences,
- rates of employment and average hours worked,
- education levels and innovation activities, and
- geography, location and population.
Clearly there are a number of other factors that have also been identified as potentially important. These include infrastructure (a useful indicator for which is hard to identify) and the extent of capital deepening. To argue that capital deepening is the issue does, of course, invite the next question of why, which leads us back to the same set of possible explanations.
In following sections there are a number of attempts at quantification in order to estimate potential orders of magnitude. These results clearly depend on the analytical approach taken and the data chosen. We would not claim to be experts on either the New Zealand economy or the recent analytical literature. As such the following discussion should be thought of as indicative and any conclusions drawn as tentative.
4.1 Policy differences?
Policy is often looked to for an explanation of differences in performance between countries.
Institutions are central to determining the productivity level. The key institutional frameworks, including property rights, contract enforcement and the rule of law are similar in New Zealand and Australia. This does not appear a likely candidate for explaining the productivity level differences.
Macroeconomic policies can play an important role in the functioning of an economy. Credible monetary and fiscal policies are an important foundation on which economic activity is based. Poor macroeconomic policies will cause income and productivity to fall behind world best.
Both Australia and New Zealand have independent central banks with similar (inflation targeting) objectives. Both countries also have fiscal policies based on medium-term strategies and relatively low government net debt. While Australia’s net government debt is lower than that of New Zealand it is unlikely that this explains a substantial amount of the current productivity difference.
While the frameworks for both monetary and fiscal policy are similar it has been argued that the implementation of macroeconomic policy may explain some of the differences in performance. An example that has been used is the monetary response to the Asian financial crisis where interest rates rose in New Zealand but fell in Australia. It may be that differences in implementation could temporarily influence the gap but it is unlikely that this would be sustained unless those differences persisted.
It is, however, important to observe that real interest rates in New Zealand have been quite a bit higher than in Australia or the United States on average over much of the past decade. This gap opened substantially in the early 1990s as Australia’s real cash rate fell from around 10percent on average in 1990 to below 4percent by 1993, while New Zealand experienced a similar fall initially, but real interest rates returned to an average of nearly 8percent over the two years to 1996, and didn’t fall below 4percent until the end of the decade. It would be reasonable to expect this difference to have implications for the relative extent of capital deepening and hence labour productivity in the two countries. (Chart 7)
Chart 7: Real cash rates, Australia, New Zealand and the United States, 1986-2004, two year average
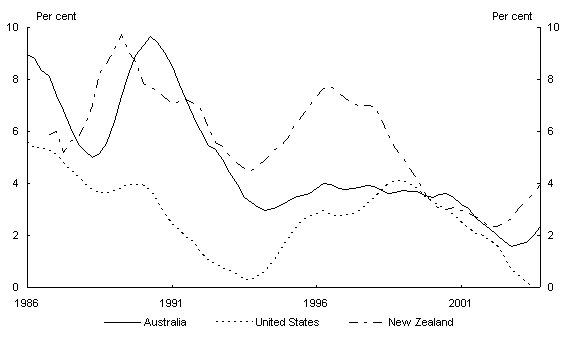
Source: Two year trailing average of nominal cash rate deflated by consumer price index (excluding Housing), adjusted for introduction of GST in Australia.
In addition to macroeconomic policies, government regulation and ownership plays an important role in determining the level of competition in markets and hence how quickly new ideas are adopted and adapted.
Indices of economy-wide product market regulation consistently place both Australia and New Zealand in the least regulated half of the OECD, with regulation in New Zealand often rated as slightly less than in Australia (Table 2).
Table 2: Rank in Indicators of regulation in selected countries

Source: Nicoletti & Scarpetta (2003). The least regulated country is ranked as 1.
The World Bank provides a snapshot of business regulation which looks at a number of indicators including Starting a Business, Hiring and Firing Workers, Enforcing Contracts, Getting Credit, and Closing a Business. The ratings of the two countries are very close (Table 3).
Table 3: Business environment indicators

Source: Doing Business: Benchmarking Business Regulation, World Bank.
Looking across the range of policies examined here, there does not appear to be a difference large enough to explain significant diffe
rences in productivity performance. That does not mean at the more micro level that there are not significant differences — just that they are not large enough to show up on these aggregate indicators.
4.2 Employment and hours worked
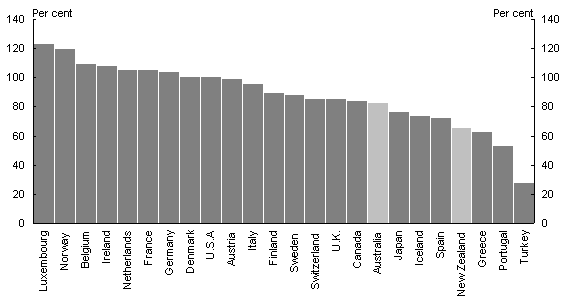
Cross country comparisons of labour productivity levels show both Australia and New Zealand ranking in lower half of the OECD (see Chart 8).
Chart 8: GDP per hour worked, 2003, percent of United States
Source: Groningen Growth and Development Centre and The Conference Board, Total Economy Database, February 2004,
A number of European countries rank above the USA. In a recent paper GilbertCette (2004) argues that the lower average annual hours worked and employment to working age population ratios in Europe ought to be taken into account. Once these factors are taken into account what he called the ‘structural’ level of labour productivity in the United States is higher than all European Union Countries, though it remains lower than Norway.
The basic argument is that the marginal employee or hour worked is less productive than the average. Drawing on a previous study by Belorgye, Lecat and Maury (2004), the paper estimates the impact of changes in the level of these variables using a cross-country growth equation, and estimates the elasticity of long term productivity per hour at -0.35 relative to hours worked and-0.5 relative to the employment rate.
In addition, there appears to be a strong, robust relationship between labour force growth and productivity growth, with slower labour force growth being correlated with faster labour productivity growth. This correlation has been demonstrated over long periods of time in the United States, and is consistently observed in cross-country growth regressions across both OECD countries, and a larger sample of countries (Romer, 1987, Englander & Gurney, 1994 and Benanke & Grkaynak, 2001). Other things given, 1percent faster (slower) annual labour force growth is associated with a fall (rise) in annual labour productivity growth of about percent.3
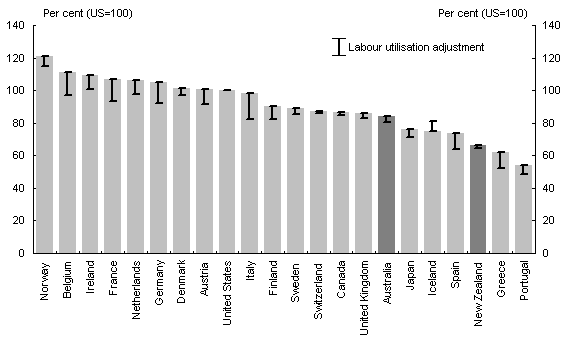
Using the same methodology as Cette (2004), we recalculated the productivity levels across the OECD to see what impact differences in employment rates and average hours worked might have. The impacts are significant for the relativities of many countries. For example, France falls from around 107percent of the US to around 94percent. For the gap between Australia and New Zealand the impact is less dramatic. Australia moves down from 84 to 80percent of US productivity levels and New Zealand moves down from 66 to 64percent (see Chart 9).4
Chart 9: GDP per hour adjusted for labour utilisation, percent of United States, 2002
Source: Authors calculations based on Groningen Growth and Development Centre and The Conference Board, Total Economy Database, February 2004,
http://www.ggdc.net and OECD Main Economic Indicators. The labour utilisation adjustment shows the estimated impact on productivity levels of changing the employment rate and average hours worked to United States levels. The bars show the unadjusted level of measured labour productivity, and the adjusted level is found by adding or subtracting the adjustment bar shown.
These small differences reflect the fact that average hours worked and employment rates in Australia and New Zealand are much closer to US levels than to European levels.
While Australia and New Zealand have similar rates of employment and average hours worked today, New Zealand has seen very significant changes in these variables since 1990. Between 1990 and 2003, the average number of hours worked per person in the total population increased by 9.7percent in NewZealand, compared to 2.2percent in Australia. The result could be to bias the measurement of the growth of labour productivity in New Zealand downwards over this period. Table 4 shows the impact that adjusting labour productivity for labour utilisation might have on the productivity gap between Australia and New Zealand since 1993. Without any adjustment the gap in productivity increases by 6percentagepoints over the decade. But once the adjustment is included, the gap increases by only 4percentagepoints.
Table 4: New Zealand’s productivity relative to Australia, original and adjusted
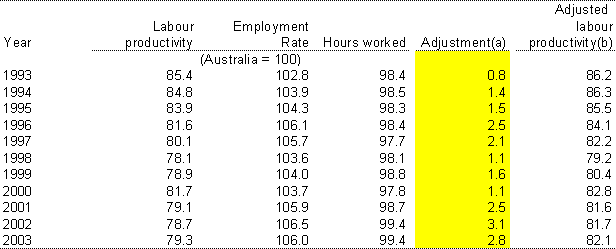
(a) The adjustment is calculated using the method in Cette (2004), see above footnote 4.
(b) New Zealand’s structural productivity level, calculated as if New Zealand had the same labour utilisation as Australia.
Source: Authors calculations based on Groningen Growth and Development Centre and The Conference Board, Total Economy Database, February 2004,
http://www.ggdc.net, Labour Force, Australia (ABS Cat. No. 6202.0), and Household Labour Force Survey, New Zealand (Stats NZ 61.900). Employment rate is calculated based on the total labour force.
4.3 Education levels and innovation activities
Human capital and the stock of knowledge available to participants in an economy may well play an important role in determining the level of productivity relative to world-best. Unfortunately we have imperfect measures of both of these factors.
At an aggregate level, education levels in Australia and New Zealand appear similar in terms of highest qualification. It is, however, difficult to sensibly compare education qualifications across countries. In one measure New Zealand is estimated to have about half a year less average years of education of the working age population than Australia (Bassaninni and Scarpetta, 2001). One estimate is that an extra year of education has a long run output effect of about 6per cent (Bassanini and Scarpetta, 2001). This then might explain something like 3 percentage points of the gap. However, this indicator can take little account of the quality aspects of education and does not capture on the job training.
At more micro levels, the quality of education and the extent to which it meets the needs of the individual country could conceivably make a difference to the levels of productivity achieved but this is hard to discern from aggregate data.
The knowledge stock available to an economy is even more difficult to measure. It depends on a range of variables, which include:
- The extent to which knowledge is generated domestically. Both Australia with Research and Development (R&D) spending of around 1.5 per cent of GDP and New Zealand at around 1.1 per cent of GDP
are below the OECD average of 2.3 per cent GDP.5
A country’s connections with the centres of economic activity. This includes both formal and informal connections. These are difficult to measure but both countries have historical connections through migration.
Distance from other knowledge generating activities is likely to matter. Falling transport and communications costs will have assisted both countries in this respect but it still provides challenges.
Differences in the levels of business R&D intensities appear to have persisted for some time. The OECD estimates that a 0.1 per cent of GDP increase in business R&D intensity raises output per working age person in the long run by 1.2percent (OECD, 2004). Australia’s business R&D intensity is around 0.4percent of GDP higher than New Zealand’s6. The implication is that if NewZealand’s business R&D intensity was similar to Australia’s then NewZealand productivity could be around 5percent higher. But R&D intensities are heavily influenced by industry structure and the industry structure of both Australia and New Zealand might sensibly imply a different mix of innovation activities from the OECD average. It might also imply a different mix of public and private R&D.
Expenditure on R&D is only one indicator of investment in knowledge. It is the most often used in international comparisons and cross country analysis, primarily because R&D spending has been measured in OECD countries for a number of decades. Total investment in knowledge on the other hand is difficult to measure. The New Zealand Ministry of Economic Development attempted to measure this and found that New Zealand’s investment, at 3.4 per cent GDP, was only slightly below Australia’s (Ministry of Economic Development, 2003).
4.4 Geography, location and population
It is likely that location relative to global economic activity, internal geography and population densities play an important role, in conjunction with institutions, in determining how close to world best productivity a country can move.
One of the arguments is that there are increasing returns to spatial concentration driven by factors such as knowledge spillovers, thick labour markets and the proximity of customers and suppliers.
It seems sensible to examine whether the level of productivity in New Zealand looks reasonable when compared to the distribution of Australian states.
Andrew Coleman (2001) used Queensland as a comparator with New Zealand. He argued (p.158) that:
The parallels are obvious:
- In population terms both are long thin countries whose three million residents are split about equally between a single large metropolitan area and a scattering of medium-to-large towns;
- Both regions are separated by over a thousand kilometres from either Sydney or Melbourne
- Both have large agricultural industries with specialties different from the rest of Australasia (sugar and beef in Queensland and dairy and forestry in New Zealand); and
- In each region the service sector is three-quarters of the economy.
Of course, Queensland has a much larger mineral sector than New Zealand, but this is capital intensive and largely owned by non-Queenslanders.
On this basis we might expect labour productivity to be similar, with Queensland perhaps slightly higher. However, New Zealand is also significantly more remote from the bulk of world economic activity than Queensland, so this may push productivity levels in New Zealand somewhat below Queensland’s7.
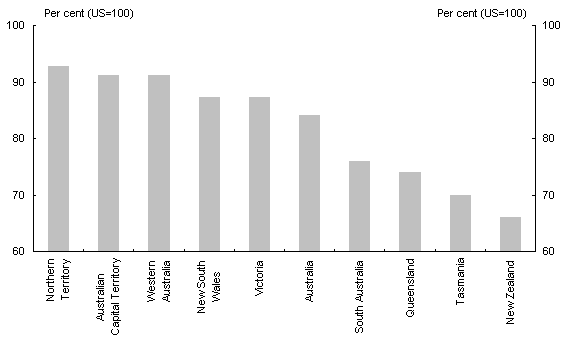
Chart 10: Productivity Levels in Australia and New Zealand, 2002
Source: Author’s calculations from Groningen Growth and Development Centre and The Conference Board, Total Economy Database, February 2004,
http://www.ggdc.net, Australian National Accounts: State Accounts (ABS Cat. No. 5220.0) and Labour Force, Australia, Detailed (ABS Cat. No.6291.0.55.001). State productivity levels are adjusted to 1999 $US PPP levels using the implicit deflator for the total Australian productivity level calculated from the State Accounts data relative to the level given in the Groningen data.
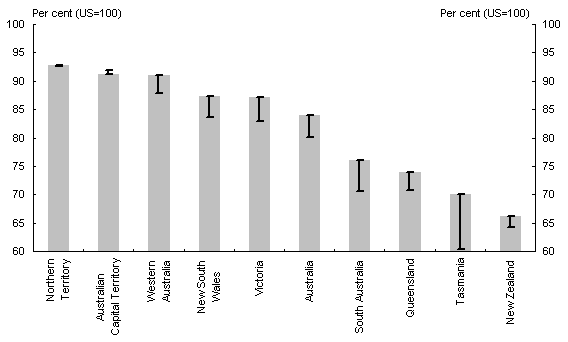
As illustrated, the Northern Territory, Australian Capital Territory and Western Australia have the highest, and New Zealand the lowest, productivity levels of any of the regions examined.
Western Australia and the Northern Territory are likely to have higher labour productivity due to the relative size of mining in their economies. The variations between Australian state productivity levels have been relatively stable over the past decade or two, except for Western Australia which has seen a significant expansion of mining. Once mining is removed, productivity growth rates across the states look very similar (see Nguyen, Smith and Boehm, 2003). This stability suggests that the steady state levels of relative productivity may have been reached, at least in some cases (see Bodman, Draca and Wild, 2003).
However, there are considerable differences in the employment rates and average hours worked between some of the states and New Zealand. If we use the adjustments discussed earlier to account for these differences the results change significantly. New Zealand productivity levels are then found to be above those of Tasmania, and somewhat closer to the levels of South Australia and Queensland.
Chart 11: Productivity levels in Australia, adjusted for labour utilisation
Source: Author’s calculations from Groningen Growth and Development Centre and The Conference Board, Total Economy Database, February 2004,
http://www.ggdc.net, Australian National Accounts: State Accounts (ABS Cat. No. 5220.0) and Labour Force, Australia, Detailed (ABS Cat. No.6291.0.55.001).
Taking the regional analogy a step further, a recent paper looking at UK regional variations found that there was a productivity effect associated with economic mass, suggesting that doubling the ‘economic mass’ to which an area has access raises its productivity by 3.5percent (Rice and Venables, 2004). Access was found to have the greatest impact within 40 minutes driving time and have little effect beyond 80 minutes. On this basis we could reasonably expect the average productivity levels in both Victoria and New South Wales to be higher than NewZealand, perhaps with New South Wales slightly higher than Victoria.
5. Conclusion
Australia’s improved productivity performance over the 1990s was not an accident. It came, in significant part, as a result of an extensive economic policy reform programme.
Economic reforms in both Australia and New Zealand over the last two decades or so were expected to lead to improved productivity performance in both countries. But significant differences i
n productivity levels between Australia and the United States and Australia and New Zealand remain.
It is likely that marked differences in geography, location and population mean that we could expect there to be a productivity difference between Australia and the United States, and between Australia and New Zealand. The productivity level differences observed are not outside reasonable expectations once these factors are taken into account. However, that does not mean that these differences cannot change in the future.
- Economic reforms over the past two decades or so have meant that both Australia and New Zealand should be able to move closer to the global productivity frontier within the constraints identified. And it is possible that technological change over the last decade may have reduced these constraints.
- Lower levels of business investment in R&D and average years of schooling in New Zealand may be a contributor to the productivity gap.
- Finally, the significant increase in employment rates over the past decade could be a significant factor in the relative decline in New Zealand’s measured labour productivity.
References
Bassanini, A and Scarpetta, S (2001), Does Human Capital Matter for Growth in OECD Countries? Evidence From Pooled Mean-Group Estimates, OECD Economics Department Working Paper No. 282.
Belorgey, N, Lecat, R & Maury, T P (2004), Determinants of Productivity Per Employee: An Empirical Estimation Using Panel Data, Banque de France Working Paper 110.
Bernanke, B S, Laubach, T, Mishkin, F S and Posen, A S (1999). Inflation Targeting: Lessons from the International Experience, Princeton: Princeton University Press.
Bernanke, B S and Grkaynak, R S (2001). ‘Is Growth Exogenous? Taking Mankiw, Romer, and Weil Seriously’, NBER Macroeconomics Annual 2001.
Bodman, Draca and Wild (2003), ‘Recent Convergence Behaviour of the Australian States: A Time Series Approach’, in Productivity and Regional Economic Performance in Australia, edited by Williams, Draca and Smith.
Bureau of Transport and Regional Economics (2002), Freight Rates in Australia, BTRE Information Sheet 19.
Cette, G (2004), Is hourly labour productivity structurally higher in some major European countries than it is in the United States?, Mimeo.
Coleman, A (2001), Three Perspectives on an Australasian Monetary Union, Reserve Bank of Australia 2001 Conference.
Commonwealth Treasury (2001), Budget Paper No. 1 2001, Budget Strategy and Outlook 2001-02, Statement 4: ‘A More Productive Australia — Policy and Technology’.
DeLong, J B (2002). Productivity Growth in the 2000s, University of California.
Englander, S and Gurney, A (1994). Medium-Term Determinants of OECD Productivity, OECD Economic Studies No. 22.
Ewing, R and Battersby, B (2003), Geographic Remoteness: Does The Growth Of Asia Improve Australia’s Position? Australian Conference of Economists, 2003.
Maddison, A (2001): The World Economy: A Millennial Perspective, Paris.
McLean, I W and Taylor, A M (2001): Australian Growth: A California Perspective, National Bureau of Economic Research Working Paper 8408.
Ministry of Economic Development (2003), Growth and Innovation Framework: Benchmark Indicators Report 2003, http://www.med.govt.nz/irdev
/econ_dev/growth-innovation/progress-2003/benchmark/index.html
Nguyen, Smith and Meyer-Boehm (2003), ‘Variations in Economic and Labour Productivity Growth among the States of Australia: 1984-85 to 1998-99’, in Productivity and Regional Economic Performance in Australia, edited by Williams, Draca and Smith.
Nicoletti & Scarpetta (2003), Regulation, Productivity and Growth: OECD Evidence, OECD Economics Department Working Paper 2003(1).
Organisation for Economic Cooperation and Development (OECD) (2002), Measuring the Information Economy 2002, Paris.
OECD (2003), The Sources of Economic Growth in OECD Countries, Paris.
OECD (2004), Understanding Economic Growth, Paris.
Parham, D (2002), ‘Productivity and Policy Reform in Australia’, International Productivity Monitor, No. 5, pp 53-63.
Rice, P and Venables, A J (2004), Spatial Determinants of Productivity: Analysis for the Regions of Great Britain, CEP Discussion Paper No. 642.
Romer, P (1987). ‘Crazy Explanations for the Productivity Slowdown’, NBER Macroeconomics Annual 1987.
van Ark, B (2004), ‘The Measurement of Productivity: What do the numbers mean?’ in Gelauff, Klomp, Raes and Roelandt (editors), Fostering Productivity, Elsevier: Amsterdam.
1 See Bernanke et al (1999), p 220 for a discussion of the timing of the introduction of the Australian inflation-targeting regime.
2 These figures do not add to 21 due to rounding.
3 This estimate comes from Table 10 in Englander and Gurney (1994). Their regressions explain labour productivity growth in OECD countries over four time periods from 1960 to 1990, and control for growth in the capital-labour ratio as well as the rate of human-capital formation (proxied by secondary school enrolment rates). Across a range of specifications, the coefficient on labour force growth varies in the range, -0.68 to-0.42, and is always highly statistically significant. Bernanke and Grkaynak (2001) report similar results for total-factor-productivity growth regressions using a larger sample of countries.
4 The adjustment is to multiply the differences in relative employment and hours worked by the elasticity to determine the adjustment to relative productivity. The US is indexed to 100. For France for example, measured productivity is 107percent of US levels in 2002, average hours are 81percent (19*-0.35=-6.6percentage points) and employment rate is 86.5percent (13.5*-0.5=6.7percentage points) hence adjust productivity levels are 93.7percent of US levels. This ‘standardises’ productivity levels calculations to US employment rates and average hours worked.
5 Gross Expenditure on Research and Development, ABS, Research and Experimental Development,
All Sector Summary, Australia (cat. no. 8112.0), Statistics New Zealand, Research and Development in New Zealand, 2002, OECD, Main Science and Technology Indicators database, May 2003.
6 Statistics New Zealand, Research and Development in New Zealand, 2002, OECD, Main Science and Technology Indicators database, May 2003
7 According to Ewing and Battersby (2003), New Zealand is the most remote country in the world, being effectively 12,300 km from the rest-of-the-world GDP, compared to 10,183km for Australia (itself the 13th most remote country in the world).
