The Australian economy is forecast to grow by 2½ per cent in 2013-14 and 3 per cent in 2014-15. Against the backdrop of a still challenging global outlook, the Australian economy is expected to transition away from resource-investment led growth towards broader based growth, although this transition may not occur as smoothly as forecast.
Part of the transition is in the resources sector, with a shift from resources investment towards resources production and exports. This transition is proceeding broadly as expected, although the expected peak in investment is lower than at Budget, with the sector having become increasingly cautious in the allocation of capital. This follows increased uncertainty about global growth prospects, particularly in China and India, and rises in domestic costs.
While the shift towards higher exports will support growth, the net contribution of the resources sector to real GDP growth will fall. A rebalancing of growth towards the non-resource sectors is needed to deliver sustained economic growth. While this transition has commenced, it is now expected to take longer than at Budget. Still, sustained low interest rates and the lower Australian dollar are expected to underpin a return to around trend growth in 2014-15.
The outlook for the global economy remains challenging with growth expected to remain well below trend at 3 per cent in 2013. Strengthening activity in Japan and encouraging prospects for the United States are being offset by the ongoing recession and crisis in the euro area and moderating growth in emerging economies, including China and India. Nevertheless, global growth is expected to rise over the forecast period, underpinned by improving prospects in the advanced economies and solid growth in emerging Asia.
The terms of trade are expected to decline by 5¾ per cent in 2013-14 and 3¾ per cent in 2014-15, returning them to around their 2009-10 level (Box 1). The forecast decline in the terms of trade, alongside easing wage growth, is expected to lead to another two years of below average nominal GDP growth, of 3¾ per cent in 2013-14 and 4½ per cent in 2014-15.
Employment growth is expected to be below trend at 1 per cent through the year to the June quarter 2014, before rising to 1½ per cent through the year to the June quarter 2015 in line with gradually improving economic conditions. The unemployment rate is expected to increase from 5.6 per cent in the June quarter 2013 to 6¼ per cent in the June quarter 2014, and stabilise at that rate through to the June quarter 2015. Inflation is expected to ease and remain contained over the forecast period, reflecting ongoing spare capacity in the labour market and subdued wage growth.
There are both external and domestic risks to the outlook. The crisis in the euro area remains unresolved, and markets are anxious about how the eventual unwinding of US monetary policy will play out. There is also lingering uncertainty about the sustainability of Japan's recovery, while markets remain concerned about financial developments in China.
This uncertainty surrounding global growth prospects poses a risk to the terms of trade and nominal GDP forecasts. There is also a risk that the anticipated fall in resources investment following its peak could be sharper than expected, especially around the middle of the decade (Box 1). In addition, the transition to new sources of growth may not occur as smoothly as anticipated. Unexpected global or domestic developments could also generate further sharp movements in the exchange rate.
Box 1: Commodity prices, the terms of trade and resources investment
Over the past decade, strong growth in China and other emerging market economies generated a huge increase in the demand for energy and steel. Australia benefited from these developments, initially in the form of higher prices for resource exports, and later from the activity generated by the investment in new productive capacity. The next stage of the resources boom is upon us, as the construction of major projects is completed and the projects move into the production phase.
Forecasters, in both the public and private sectors, and both here and overseas, have found it difficult to consistently identify the timing and pace of these developments. As commodity prices were rising, forecasters were surprised on the upside, and as prices have fallen from their peak in 2011, the speed of the decline has been more rapid than many expected.
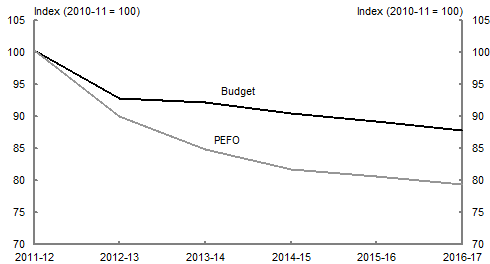
A combination of factors has driven a further downward revision to forecast commodity prices and the terms of trade since the 2013-14 Budget (Chart A). In particular, growth in China is expected to be more moderate and less commodity-intensive, in part due to a new policy approach adopted by Chinese authorities. The implications of these revisions for export earnings have, in part, been offset by the lower Australian dollar.
Source: ABS cat. no. 5206.0 and Treasury.
As always, there remains significant uncertainty around the profile of the terms of trade, in both the near and medium term. Commodity prices are inherently volatile and unexpected changes to the global demand or supply of commodities can have a significant impact on world commodity prices in either direction. What is important to recognise, though, is that while the terms of trade are in decline, the level at which they might settle, and at what point in the future, continues to be highly uncertain.
The volatility in commodity prices has also had a significant impact on the outlook for investment in the resources sector. Following the sharp falls in commodity prices in the middle of 2012, firms looked to reduce their capital spending, in some cases by delaying or cancelling decisions on projects under consideration and in other cases by containing costs and reducing investment in new capital.
There remains a sizeable amount of work in the pipeline yet to be done, in particular on LNG projects, although investment in iron ore and coal projects has passed its peak. While resources investment is expected to remain elevated over the next year, construction is expected to slow significantly as these projects move towards completion.
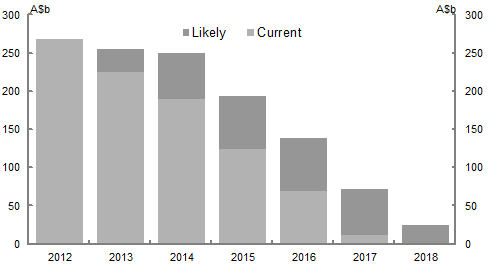
The latest update of the outlook for resource projects from the Bureau of Resource and Energy Economics (BREE) released in May demonstrates the magnitude of the transition likely to occur over the next half-decade, although the timing of this transition remains highly uncertain (Chart B). Investment could also fall more sharply than expected, particularly if future project commencements (those categorised by BREE as 'likely') fail to materialise.
Chart B: Outlook for resources projects
Source: Bureau of Resources and Energy Economics.
Table 2 presents the major economic parameters used in preparing the 2013 PEFO. Detailed forecasts of the economy are prepared for the budget year and the subsequent year. As always, there is a degree of uncertainty about the forecasts — this is discussed in Box 2.
| Forecasts | Projections | ||||
|---|---|---|---|---|---|
| 2013-14 | 2014-15 | 2015-16 | 2016-17 | ||
| Real GDP | 2 ½ | 3 | 3 | 3 | |
| Employment | 5 | 1 ½ | 1 ½ | 1 ½ | |
| Unemployment rate | 6 ¼ | 6 ¼ | 5 | 5 | |
| Consumer Price Index | 2 ½ | 2 | 2 ½ | 2 ½ | |
| Nominal GDP | 3 ¾ | 4 ½ | 5 ¼ | 5 ¼ | |
| Terms of trade | -5 ¾ | -3 ¾ | -1 ½ | -1 ½ | |
(a) Real GDP, nominal GDP and the terms of trade are year-average growth. Employment and CPI are through-the-year growth to the June quarter. The unemployment rate is the rate for the June quarter.
Note: The PEFO and the Economic Statement are based on the same technical assumptions, other than for the exchange rate which has been updated in line with recent market movements — a trade weighted index of 70 and a United States dollar exchange rate of around 91 US cents.
Source: ABS cat. no. 5206.0, 6202.0, 6345.0 and Treasury.
Beyond the forecast period, there is less information on which to prepare detailed forecasts, so Australian budgets and other economic statements have tended to rely on projections of high-level economic aggregates to underpin budget estimates of receipts and payments. Since the introduction of the Charter in 1998, PEFO documents have used broadly similar projection methodologies (see Box 3).
Box 2: Uncertainty around the GDP forecasts
The degree of uncertainty around forecasts can be estimated based on past forecast errors and presented using confidence intervals. Similar approaches for estimating uncertainty have been adopted by a number of monetary and fiscal authorities.
For GDP forecasts, confidence intervals could be presented around forecasts of annual growth rates or average annualised growth rates. While both measures have merit, providing a reasonable forecast of the level of GDP is important for fiscal variables. The average annualised growth rate is a better summary statistic, as it reflects cumulative growth. For a hypothetical example, if GDP is forecast to grow by 2 per cent in one year and 5 per cent in the next, the level of GDP will be forecast to be roughly 7 per cent higher after two years. This is more effectively summarised by the 3½ per cent average annualised growth rate over the two years than by the two separate annual growth rates.
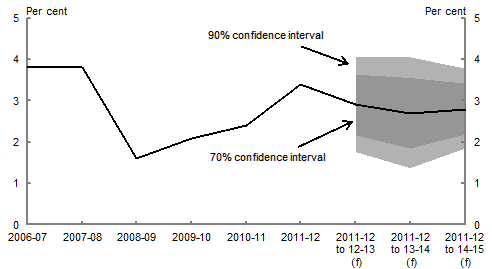
Chart A presents PEFO forecasts and confidence intervals for average annualised real GDP growth. For example, average annualised real GDP growth over the two years 2011-12 to 2013-14 is expected to be 2¾ per cent, with the 70 per cent confidence interval over the two years from 2 to 3½ per cent. In other words, if forecast errors are similar to those in the past, there is a 70 per cent probability that the average annualised growth rate will lie in this range.1
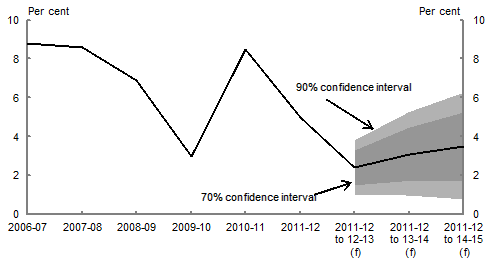
The uncertainty around nominal GDP growth forecasts is larger, reflecting the compounding nature of two sources of uncertainty; the outlook for real GDP and the outlook for prices or the GDP deflator. The average annualised nominal GDP growth over the two years 2011-12 to 2013-14 is expected to be a little over 3 per cent, with the 70 per cent confidence interval over the two years from 1¾ to 4½ per cent (Chart B).
Table 3.5 of the Review of Treasury Macroeconomic and Revenue Forecasting suggests that the Reserve Bank of Australia's forecast accuracy for real GDP is similar to that of Treasury, implying that the uncertainty around its forecasts is similar to Treasury's. Also the UK Office of Budget Responsibility estimates of uncertainty for real GDP growth, as reported in its March 2013 Economic and Fiscal Outlook, seem no smaller than those of the Treasury.
The Review of Treasury Macroeconomic and Revenue Forecasting found that Treasury's forecasts of GDP deflator growth are less accurate than those for real GDP growth. A major contributor to this is the difficulty in forecasting commodity prices and the terms of trade. The sensitivity of key components of receipts and payments to a 1 per cent fall in nominal GDP owing to a fall in the terms of trade is presented in Appendix D.
Note: The central line shows the outcomes and PEFO forecasts. Annual growth is reported for the outcomes. Annualised average growth rates from 2011-12 are reported from 2012-13 onwards. Confidence intervals are based on the root mean square error of budget percentage growth rate forecasts. (f) are forecasts. Before the 2009-10 Budget, a projection rather than a forecast was made for the year after the budget year. Reporting the average annualised growth rate moderates the impact of errors over longer horizons.
Source: ABS cat. no. 5206.0, Budget papers and Treasury.
Chart B: Nominal GDP growth rate
Note: See note to Chart A.
Source: ABS cat. no. 5206.0, Budget papers and Treasury.
Box 3: Economic forecasts and projections
The Charter of Budget Honesty requires that the PEFO contains information on the economic and other assumptions that have been used to prepare the fiscal estimates for the current year and the following three financial years.
The economic assumptions presented in this PEFO consist of economic forecasts for 2013-14 and 2014-15 (the forecast period) and economic projections for 2015-16 and 2016-17 (the projection period).
The economic projections are based on medium-term assumptions for growth that are consistent with underlying historical trends in the economy and long-term factors such as demographic change. As a result, the methodology used to prepare the projections has changed a little over time.
Since the introduction of the Charter in 1998, the practice of presenting economic forecasts and projections has evolved. In the period 1998-2008, governments published forecasts for the Budget year and projections for the following three years. From the 2009-10 Budget, the Government has published forecasts for the Budget year and the following year, and projections for the last two years of the forward estimates.
Each PEFO has followed the practice adopted by government in its most recent fiscal report. Similarly, the economic projections in each PEFO have been prepared using the same methodology as in the most recent fiscal report tabled by government.
In 1998, projected GDP growth was 3½ per cent. This was revised down to 3¼ per cent in 2005 and to 3 per cent in 2006. These downward revisions were driven by the effect of population ageing on the aggregate participation rate, and lower projected productivity growth. Projected GDP growth has remained at 3 per cent since then, apart from a temporary change in 2009.2
On the labour market, unemployment rate projections were not published until the 2002-03 Budget. In that budget, the economic forecasts and projections were described as being consistent with the unemployment rate gradually falling from its then current level of 6.3 per cent to 5 per cent by 2006-07 — one year beyond the projection period — and remaining at that level thereafter (Budget Paper No. 5, Intergenerational Report 2002-03, p. 28). Since then, the assumption that the unemployment rate would settle at around 5 per cent in the projection period has been maintained, with the exception of the 2009-10 Budget (see footnote).
This has been the case whether the unemployment rate has been above, or below, 5 per cent in the forecast period. For example, in the 2007-08 Mid-Year Economic and Fiscal Outlook (which underpinned the 2007 PEFO) the unemployment rate at the end of the forecast period was 4½ per cent, with the projection year assuming an unemployment rate of 5 per cent. In this PEFO, the unemployment rate is forecast to be 6¼ per cent in the last forecast year, with the first projection year assuming an unemployment rate of 5 per cent.
An alternative projection assumption would recognise that, with unemployment at 6¼ per cent, the economy is operating with an output gap. Gradually narrowing this output gap over the projection period generates above-trend real GDP growth and a gradually falling unemployment rate (Table A). This would be similar to the budget projection methodology used in the early 2000s, when the unemployment rate was considered to be above its longer-term sustainable level.
| Forecasts | Projections | ||||||
|---|---|---|---|---|---|---|---|
| PEFO | Alternative | ||||||
| 2013-14 | 2014-15 | 2015-16 | 2016-17 | 2015-16 | 2016-17 | ||
| Real GDP | 2 ½ | 3 | 3 | 3 | 3 ¼ | 3 ¼ | |
| Nominal GDP | 3 ¾ | 4 ½ | 5 ¼ | 5 ¼ | 5 ½ | 5 ½ | |
| Unemployment rate | 6 ¼ | 6 ¼ | 5 | 5 | 6 | 5 ¾ | |
(a) Real and nominal GDP are year-average growth. The unemployment rate is the rate for the June quarter.
Source: ABS cat. no. 5206.0, 6202.0 and Treasury.
Under this alternative projection assumption, the unemployment rate is assumed to fall gradually from 6¼ per cent at the end of the forecast period to 5¾ per cent at the end of the two-year projection period, adding around $1.5 billion to estimated payments in 2015-16 and $1.7 billion in 2016-17, overwhelmingly from higher benefits paid to unemployed persons.3 In contrast, the stronger GDP and employment growth adds around $0.7 billion to expected tax receipts net of GST in 2015-16 and $2.1 billion in 2016-17.
1 The confidence intervals in this box are derived from forecast errors based on budget forecasts from the 1998‑99 Budget onwards, with outcomes based on March 2013 National Accounts data. The results presented assume that budget forecast errors are normally distributed with an average of zero. As the PEFO is based on more up to date information than the 2013‑14 Budget, the confidence intervals shown likely overstate the degree of uncertainty, particularly for 2012‑13.
2 The 2009‑10 Budget was prepared during the global financial crisis. Projected GDP growth was temporarily lifted to 4½ per cent to reflect the economy's recovery from the expected impact of the crisis. At the time, the unemployment rate was expected to reach 8½ per cent by the end of the forecast period and remain elevated throughout the projection period. These forecasts and projections of the unemployment rate were subsequently shown to be too high.
3 There are lags between changes in the unemployment rate and the number of unemployment benefit recipients. The higher cost in 2016‑17 is a consequence of these lags.


