The Charter requires that the PEFO identify 'all other circumstances that may have a material effect on the fiscal and economic outlook'1.
This appendix contains projections of the underlying cash balance and net debt for the ten years beyond the budget year. Beyond the forward estimates, these projections are underpinned by a suite of models, using a similar approach to the modelling used for the Intergenerational Report2. This differs to the approach used for the forward estimates period, where fiscal estimates are based on detailed program level information.
Projections of economic parameters in the medium term are produced to underpin projections of receipts and payments. The projection methodology is based on medium‑term assumptions of growth consistent with historical experience adjusted, where appropriate, for long‑term factors such as demographic change. For example, Australia's long‑run potential real GDP growth rate is used to underpin economic parameters — this is assumed to decrease from 3 per cent to 2¾ per cent early next decade due to the impact on participation of an ageing population. As discussed in Appendix D, changes to economic parameters, such as the terms of trade, can also have significant implications for the fiscal projections. A more rapid decline in the terms of trade than currently incorporated into the projections would weaken the fiscal position, while a slower decline would have the opposite effect, all other things held constant.
Medium‑term tax receipts are projected by head of revenue using parameters for wages, profits and consumption linked to nominal GDP growth — similar to the revenue projections for the last two years of the forward estimates period.
Spending is projected using a suite of models, including models that project spending on health, income support payments, education and training, aged care, major superannuation defined benefit schemes, and defence. While the details of the various spending models differ, they are mainly driven by expected changes in demand (in most cases driven by demographic change) and prices. The demographic factors are modelled using population and labour force models.
Specific program estimates are included across the ten years for DisabilityCare Australia, the National Plan for School Improvement, and the Nation Building 2 and Nation Building 3 programs. Other spending, for example on housing programs, is assumed to grow in line with prices and incomes.
To produce balance sheet aggregates, a number of significant components of the balance sheet are modelled. These include the Commonwealth's superannuation liability, the Higher Education Loan Program, the Future Fund, the DisabilityCare Australia Fund and other Commonwealth funds, and Commonwealth Government Securities on issue. Some of these components also contribute to receipts or payments, for example through non‑tax receipts and interest payments.
The aggregate projections are modelled using an internally consistent cash and accrual framework, with interconnected operating and cash flow statements and balance sheet.
Two scenarios are modelled below. The first limits real growth in payments to 2 per cent a year, on average, until the surplus is at least 1 per cent of GDP, and while the economy is growing at or above trend (that is, from 2017‑18 to 2020‑21). It also places a ceiling on taxation revenue as a share of GDP of 23.7 per cent, which occurs from 2017‑18 in the scenario.
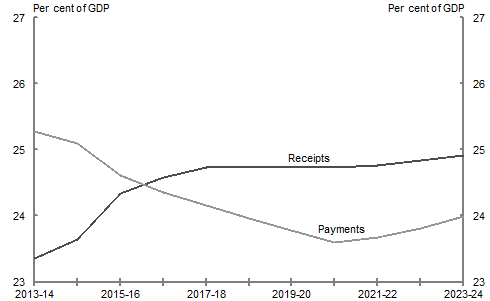
This no policy change scenario is consistent with the assumptions underpinning the medium‑term projection published in the 2013‑14 Budget (Chart F1).
Chart F1: Payments and receipts projected to 2023‑24, no policy change
Note: Payments and receipts (including non-tax receipts) are net of Future Fund payments and receipts.
Source: Treasury
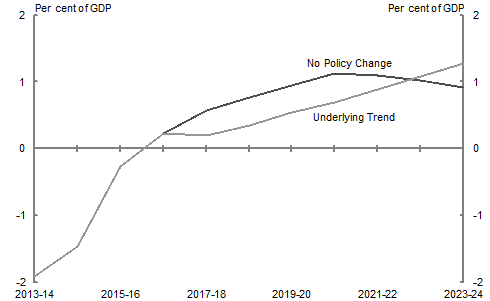
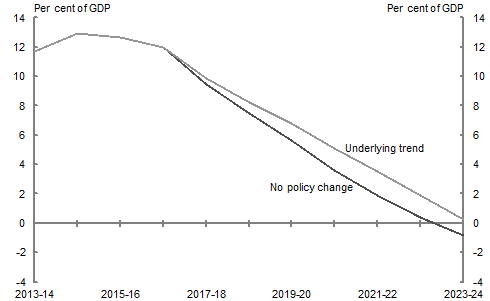
This no policy change medium‑term projection shows the underlying cash surplus growing after the forward estimates and reaching 1 per cent of GDP in 2020‑21. Net debt is projected to return to zero in 2023‑24.
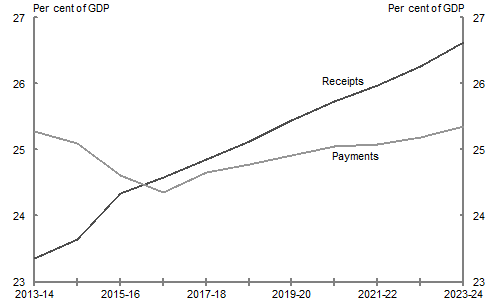
An alternative scenario is presented which removes the constraints on spending growth and the tax to GDP ratio. This 'underlying trend' scenario illustrates the medium‑term fiscal outlook if spending grows in line with the demand for existing functions and if the taxation system is unchanged, so that receipts are boosted by fiscal drag (Chart F2).
Chart F2: Payments and receipts projected to 2023‑24, underlying trend
Note: Payments and receipts (including non-tax receipts) are net of Future Fund payments and receipts.
Source: Treasury
The underlying trend medium‑term projections show that the underlying cash balance would initially be lower, reflecting higher payments, but that by the end of the decade higher taxes lead to a higher underlying cash balance than in the no policy change projections. Net debt would be slightly above zero in 2023‑24. Real payments growth would average 3½ per cent per annum from 2017‑18 to 2020‑21, compared to 2 per cent per annum under the no policy change projections. Tax receipts would reach around 25½ per cent of GDP in 2023‑24.
Charts F3 and F4 show the underlying cash balance and net debt profiles associated with the two scenarios.
Chart F3: Underlying cash balances projected to 2023‑24
Source: Treasury projections.
Chart F4: Government net debt projected to 2023‑24
Source: Treasury projections.
1Charter of Budget Honesty Act 1998, 24(2)(a).
2 For more information on the medium-term methodology see: Woods, D, Farrugia, M and Pirie, M, 'The Australian Treasury's fiscal aggregate projection model', Economic Roundup, Issue 3 2009, Treasury.


