Downloads
Introduction
I am grateful to the Australian Business Economists for the opportunity to speak to you today.*
I have chosen as my topic 'The Return of Fiscal Policy'. Of course, fiscal policy has always been with us; what has returned in the past couple of years is the use of active discretionary fiscal policy as a counter-cyclical tool to support aggregate demand.
Today, I will do three things. I will first examine Australia's recent discretionary fiscal response in some detail, and discuss its role in significantly reducing the severity of the current domestic downturn. Secondly, I will talk about the debate over the use of active discretionary fiscal policy. Having fallen out of favour over recent decades, active discretionary fiscal policy was embraced enthusiastically in response to the financial crisis, and I will discuss the economic reasons why this was so. And thirdly, I will discuss the longer-term fiscal challenges facing some of the advanced economies of the world.
Australia's discretionary fiscal response to the global financial crisis
Let me begin with Australia's discretionary fiscal response to the global financial crisis.
In the weeks following Lehman's collapse in mid September 2008, there was a strong, unequivocal signal that a severe contractionary shock was about to envelop the globe.
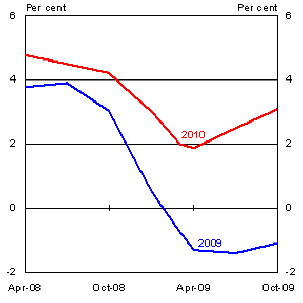
Chart 1 – IMF forecasts of GDP growth
World
Advanced economies
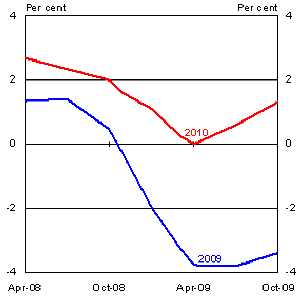
Almost immediately after Lehman's collapse, the IMF began to downgrade its forecasts for GDP growth, for the advanced economies and the world as a whole. Over the subsequent several months, these forecasts fell sharply and repeatedly (Chart 1).
As global prospects deteriorated, Australian macroeconomic policy, both monetary and fiscal, moved rapidly to support aggregate demand. Within a month of Lehman's collapse, we had seen the first 100bp cash rate cut, the first discretionary fiscal stimulus package (the Economic Security Strategy), and the announcement of government guarantees for bank deposits and term funding, with all these decisions finalised over the course of a week.1
By early December 2008, less than three months after Lehman's collapse, roughly $8½ billion in cash payments was being distributed to households — an extraordinarily rapid fiscal policy response.
Chart 2 – Timeline of events and policy announcements
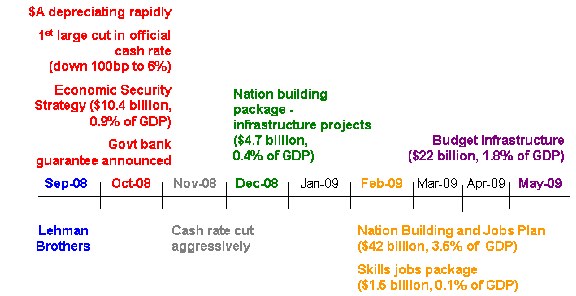
Chart 2 provides a timeline of the main events relevant to Australia's macroeconomic policy response in the months following Lehman's collapse. In particular, it shows details of the discretionary fiscal stimulus packages announced progressively through late 2008 and early 2009, as the global economic outlook continued to deteriorate.
Taking the fiscal stimulus packages together, Chart 3 disaggregates the spending between cash transfers and investment spending. To ensure rapid support for aggregate demand, most of the early spending was on cash transfers, provided to low and middle income individuals and households with dependent children. Of course, these are the people most likely to be liquidity-constrained and/or at that stage of their life-cycle when they are most likely to spend a sizeable share of any cash transfer. The remainder of the spending was on a range of investment projects, which provide a longer-term direct contribution to aggregate demand and also contribute to the economy's supply potential.
Chart 3 – Composition of fiscal stimulus
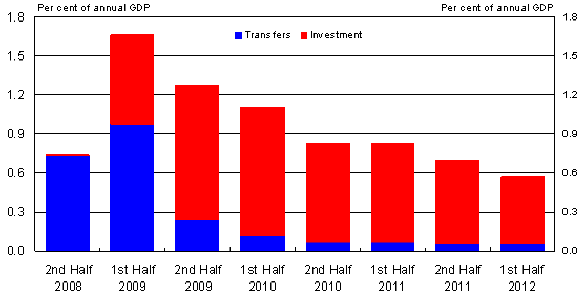
Chart 4 shows the allocation of spending for the largest of the fiscal stimulus packages, the 3.5 per cent of GDP Nation Building and Jobs Plan, announced in February 2009.
Chart 4 – Nation Building and Jobs Plan
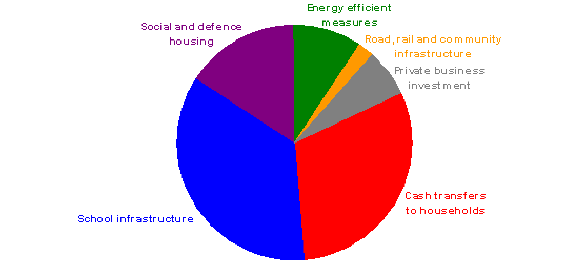
As with other packages, several elements of this package were designed to ensure that support was provided to the economy as quickly as possible. One element was, of course, the use of cash transfers. But further elements had to do with the particular types of investment spending, and detailed design features of the package that were chosen to ensure that spending could be undertaken as quickly as possible.2
Economic Responses to the Australian discretionary fiscal stimulus
Let me turn now to the economic responses to the Australian fiscal stimulus packages.
As discussed earlier, the first cash transfers to households were distributed in early December 2008. Retail trade jumped by 4 per cent in that month, having shown almost no growth earlier in 2008 (Chart 5). Since then, retail trade has remained relatively strong — supported by the additional cash payments distributed under the Nation Building and Jobs Plan. By October 2009, retail trade was 5.4 per cent higher than its pre-stimulus level in November 2008.
Chart 5 – Retail trade
(nominal, seasonally adjusted)
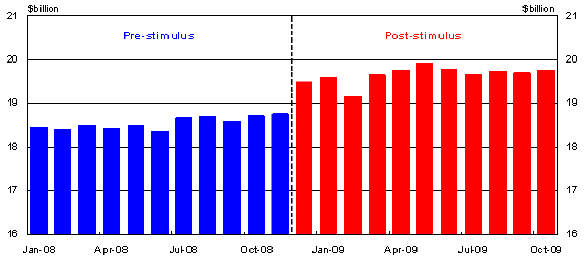
It is worth noting that the jump in retail sales occurred when the stimulus payments were received, rather than when they were announced in October. This suggests that the recipients of these payments were largely liquidity constrained (or that they were rule-of-thumb consumers whose spending adapted to the amount of money readily available for spending). This pattern of behaviour also fits with international evidence that consumption spending tends to rise on receipt of windfall income gains, rather than when consumers became aware that they will receive such windfalls.3
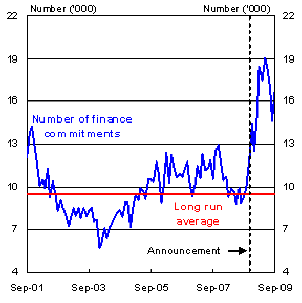
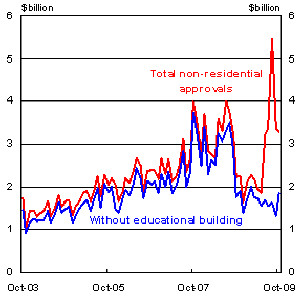
Combined with lower interest rates, the introduction of the First Home Owners Boost in October 2008 saw a huge rise in finance commitments by first home buyers (Chart 6). The non-residential building sector also saw a huge lift in building approvals, because of the school infrastructure program from the Nation Building and Jobs Plan.
Chart 6 – Construction sector
First home buyers
Non-residential building approvals
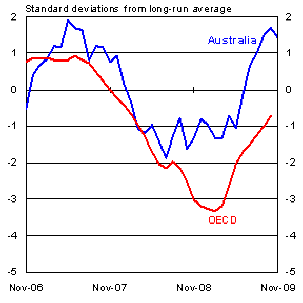
The behaviour of measures of confidence through the crisis was also instructive. In its early stages, both consumer and business confidence in Australia fell in a similar manner as in the rest of the OECD (Chart 7). But after that, confidence measures in Australia bounced back s
trongly as it became increasingly clear that the Australian economic slowdown was turning out to be much milder than those in the rest of the OECD.
The release of the March quarter 2009 National Accounts in early June was particularly influential for consumer confidence. Real GDP had fallen in the December quarter 2008, but with the release of the March quarter accounts, it became clear that Australia had avoided two consecutive quarters of falling real GDP. Consumer confidence rebounded sharply, and kept rising, so much so that the cumulative rise over the four months to September 2009 was the largest four-month rise in the thirty-five year history of the series.
Chart 7 – Confidence
Consumers
Business
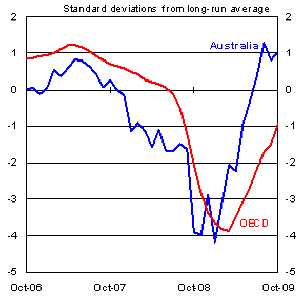
Note: For consumer confidence, the Australian series is the Westpac-Melbourne Institute Index of Consumer Sentiment and the OECD series is the OECD-total consumer confidence measure. For business confidence, the corresponding series are the NAB Monthly Business Survey and the OECD-total business (manufacturing) confidence measure.
It appears that the expansionary macroeconomic policy response was large enough and quick enough to convince the community — both consumers and businesses — that the slowdown would be relatively mild (indeed much milder than most forecasters, including the Australian Treasury, had earlier expected). If that inference is correct, it is also important. It implies that, on this occasion, expansionary macroeconomic policy was able to generate a favourable feedback loop in the economy. Macroeconomic policy supported economic activity, which in turn convinced consumers and businesses that the slowdown would be relatively mild. This in turn led consumers and businesses to continue to spend, and led businesses to cut workers' hours rather than laying them off, which in turn helped the economic slowdown to be relatively mild.
The alternative, with economic conditions deteriorating sharply, consumers and businesses 'hunkering down', raising their precautionary saving rather than spending, and businesses laying off workers rather than rationing hours because they anticipated a severe, protracted downturn, would have been a much more malign outcome. But it is an outcome to which Australia might have succumbed had both monetary and fiscal policy not acted as swiftly and substantially as they did.
Aggregate Effects of Fiscal and Monetary Stimulus
Let me now turn to estimates of the aggregate effects of the fiscal and monetary policy actions on domestic economic activity.
To estimate the aggregate effect of discretionary fiscal actions, we need estimates of the fiscal multipliers. To derive these multipliers, Treasury assumed that 70 per cent of the cash transfers would be spent over the horizon of the forecasts, with the remainder saved.4 By contrast, for government investment spending, the spending propensity was assumed to be 1.
To derive fiscal multipliers, these spending propensities were adjusted for the import share of the spending, assumed to be 15 per cent, which is the share of endogenous imports in Gross National Expenditure. This led to fiscal multipliers of 0.6 for cash transfer payments and 0.85 for government investment spending.5
These multiplier estimates are at the conservative end of the range suggested by the OECD and IMF. The OECD (2009) suggests multipliers for cash transfers for Australia of between 0.7 and 0.8 by the second year. For infrastructure spending, the comparable numbers are between 1.1 and 1.3, while the IMF (2009) estimates multipliers of between 0.5 and 1.8 for infrastructure spending across the G20 economies (Table 1).6
Table 1 – OECD and IMF estimates of fiscal multipliers

Based on the fiscal multipliers assumed by Treasury, Charts 8 and 9 show estimates from the May 2009 Budget of the effect of the discretionary fiscal stimulus packages on real GDP and unemployment. Also shown are actual outcomes since then.
Chart 8 – Effect of fiscal stimulus on real GDP
(forecasts from May 2009 Budget)
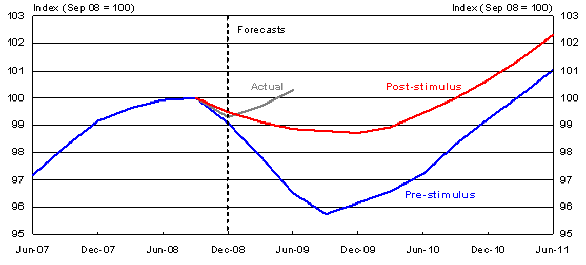
Chart 9 – Effect of fiscal stimulus on the unemployment rate
(forecasts from May 2009 Budget)
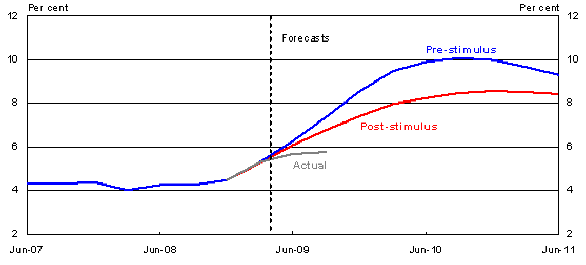
As everyone is aware, and as the Charts show, economic outcomes, for both real GDP and unemployment, have turned out much more favourably than was expected at the time of the May 2009 Budget.
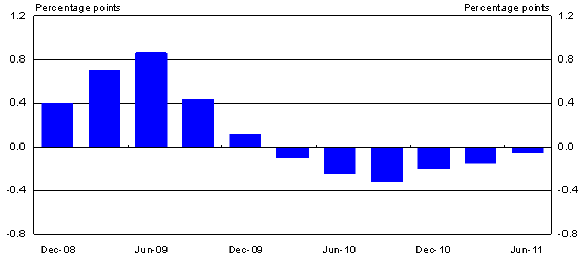
Chart 10 shows Treasury's estimates, from the 2009-10 MYEFO, released last month, of the effect of the discretionary fiscal stimulus packages on quarterly GDP growth. These estimates suggest that discretionary fiscal action provided substantial support to domestic economic growth in each quarter over the year to the September quarter 2009 – with its maximal effect in the June quarter – but that it will subtract from economic growth from the beginning of 2010.
The estimates imply that, absent the discretionary fiscal packages, real GDP would have contracted not only in the December quarter 2008 (which it did), but also in the March and June quarters of 2009, and therefore that the economy would have contracted significantly over the year to June 2009, rather than expanding by an estimated 0.6 per cent.
Chart 10 – Contribution of fiscal stimulus to quarterly growth
Note: Based on 2009-10 MYEFO estimates.
It is of interest to compare these estimated fiscal contributions to GDP growth with estimates of monetary policy's contribution. To derive these estimates, I rely on empirical work by Gruen, Romalis and Chandra (GRC) (1997), which examines how GDP growth responds over time to changes in short-term real interest rates. GRC conclude that real GDP growth rises by about one-third of one per cent in both the first and second years after a one percentage point fall in the short-term real interest rate, and by about one-sixth of one per cent in the third year.7
To use this result, we need an estimate of the change in the short-term real interest rate resulting from the monetary policy response to the crisis. Let me now derive this estimate.
From September 2008 to April 2009, the official cash rate was reduced by 4¼ percentage points from 7¼ per cent to 3 per cent. Bank lending rates fell by less than this, reflecting increased bank funding costs.
We estimate that the average bank lending rate fell by around 3 percentage points between September 2008 and April 2009, which implies a fall of about 2 percentage points in the real bank lending rate, since (year-ende
d) underlying inflation fell by around 1 percentage point over this time.
Based on the GRC result, this fall in real borrowing rates would have contributed less than 1 per cent to GDP growth over the year to the September quarter 2009, compared with the estimated contribution from the discretionary fiscal packages of about 2.4 per cent over the same period.8
The GRC result has a further implication relevant to the comparison between the impacts of fiscal and monetary policy. It supports one element of conventional macroeconomic wisdom — that there are relatively long lags in monetary policy's impact on economic activity.
As discussed earlier, GRC find that a cut in the short-term real interest rate has roughly the same impact on economic growth in the first and second years after the cut. It follows that, if the short-term real interest rate is cut at some time and then, a year later, is raised only part way back to its original level, the net impact of these interest rate changes is to provide continued positive stimulus to economic growth in the subsequent year (the year following the interest rate rise).9 It follows that, in the current circumstances, monetary policy is likely to continue contributing to economic growth into 2010, at a time when discretionary fiscal policy is expected to be subtracting from growth (as shown in Chart 10).
The debate over active discretionary fiscal policy
Let me now turn to the debate over the use of active discretionary fiscal policy. To set the scene, I seek your indulgence for an extended quote from a paper I wrote on this topic nearly a decade ago with the RBA's then Assistant Governor (Economic), Glenn Stevens:
"In discussing Australian fiscal policy …, it is convenient to separate its role as a counter-cyclical tool from analysis of its medium-term focus. There is general agreement that fiscal policy's automatic stabilisers should and do play an important counter-cyclical role. But beyond that, there has been growing disillusionment, both in Australia and elsewhere, about the capacity of discretionary fiscal policy to be genuinely counter-cyclical. The problem is not the transmission lag. Indeed, changes to fiscal policy, once implemented, should be expected to have a quick impact on economic activity — probably quicker than the impact of monetary policy. This is particularly true of changes to government expenditure, which feed directly into economic activity.
The problem, as has been widely understood, is instead the implementation lag. Fiscal policy is implemented, predominantly, on an annual cycle, with the timetable determined by the calendar rather than the state of the economy. Even in circumstances in which governments decide to provide a fiscal boost to the economy, the process of deciding exactly which expenditures and taxes to change, having the changes passed through the Parliament where that is necessary, and implementing them, leads to inevitable delay. For example, the Federal Government's main fiscal initiative in response to the early 1990s recession, One Nation, was announced in February 1992, when the economy was in its third quarter of expansion following the recession, but still growing quite slowly. While there were some small spending initiatives in the package that began immediately, the bulk of them were implemented in the following financial year, 1992/93, and beyond. They therefore came into effect when the economy had begun to expand robustly (growth over the 1992/93 financial year was 4.2 per cent, and over the 1993/94 year, 4.7 per cent). In contrast, monetary policy could, subject to the medium-term inflation target, respond counter-cyclically. Monetary policy decisions could be made and implemented quickly, even though the transmission lags were long."
Gruen and Stevens (2000).
The nature of most economic downturns renders it difficult to implement activist expansionary fiscal policy in a timely manner. As the downturn proceeds, evidence of its severity usually accumulates gradually, partly because of the unavoidable lags in the release of macroeconomic data. Only when the downturn is well advanced does it become clear how severe it is turning out to be.
Furthermore, as economic conditions deteriorate, it is rare for any specific event to provide a clear, unequivocal signal that a serious downturn is coming. As a consequence, there is usually no clear trigger to initiate an active fiscal response at a time when it is most needed.10
I do not want to overstate this argument. While recognition lags and the lack of a clear trigger were both important in the early 1990s recession, they do not account fully for the inordinate delay in implementing the discretionary fiscal response to that recession. However, policymakers and advisors learned from that experience, and were determined not to repeat it when another recession loomed.
In the current downturn, the events surrounding the collapse of Lehman Brothers, and then American Insurance Group, in mid September 2008, provided an unequivocal signal that a severe contractionary shock was about to envelop the globe.
That unequivocal signal, combined with policymakers and advisors determination to learn from the unsatisfactory experience of the early 1990s recession, led to an extremely rapid discretionary fiscal response. That fiscal response, along with the equally rapid monetary policy response, provided crucial support to the domestic economy over subsequent months and quarters, as we have seen.
Let me now spend some time responding to some of the critical arguments presented over the past year in reaction to aspects of the fiscal response.
One critical argument draws on a standard result from the Mundell-Fleming model. Fiscal multipliers tend to be larger for countries with fixed exchanges rates than for those with floating exchange rates. This result follows because, in response to a fiscal expansion, a floating exchange rate tends to appreciate, which partially crowds out the fiscal expansion (see, for example, the empirical study by Ilzetzki et al, 2009, which shows this pattern particularly clearly). Some commentators have used this result to argue that discretionary fiscal expansion in Australia is likely to be relatively ineffective.
There are two relevant responses. Firstly, this result becomes progressively more important the more open an economy is to trade. Unilateral fiscal expansions by countries that are particularly open to trade are indeed relatively ineffective. Ilzetzki et al, 2009 show that countries with trade shares (exports plus imports of goods and services) greater than 60 per cent of GDP have estimated fiscal multipliers that are much smaller than those for countries with trade shares of less than 60 per cent of GDP. The average trade share for countries in their less-open sample is 38 per cent of GDP, compared to 98 per cent of GDP for countries in their more-open sample (Ethan Ilzetzki, personal communication). Australia's trade share is about 47 per cent of GDP and so, based on this evidence, fiscal expansion in Australia should be relatively effective.
The second relevant response follows from the observation that there was a global fiscal policy response to the contractionary shock generated by the financial crisis. When all countries engage in coordinated fiscal expansion, the relevant fiscal multipliers are not those for an individual country, but the larger multipliers associated with the closed global economy.
Indeed, while monetary policy has a comparative advantage as a counter-cyclical tool when countries act unilaterally in response to a domestic shock to aggregate demand, the comparative advantage shifts to fiscal policy when the shock, and the policy response, are both global – provided the fiscal response can
be implemented at the right time.
Another critical argument follows from the observation that Australia was likely to be less adversely affected by the crisis than other advanced countries, for four main reasons. Thus, Australia had in its favour that: its financial system was not impaired; it is not a significant producer of high-end manufactured goods which suffered particularly badly during the crisis; the economy entered the crisis with significant momentum from the terms of trade boom; and finally, resource exports held up well through the crisis, largely because of China's rapid monetary and fiscal response to the crisis.
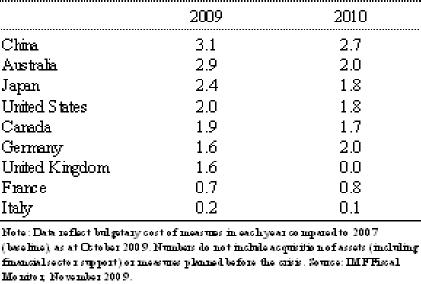
Since Australia was relatively well placed, the argument goes that the Australian discretionary fiscal response should have been smaller than those of other advanced countries that were worse hit by the crisis, rather than large relative to those of most of them, as was actually the case (Table 2).
Table 2 – Size of Discretionary Fiscal Expansions
(Per cent of GDP)
This argument would make some sense if there was a reason why all countries should aim for the same macroeconomic outcome (say, for example, the same rise in unemployment over the course of the crisis) whatever the size of the shock facing them. But, of course, there is no reason why all countries should aim for the same outcome.
Even with the discretionary fiscal responses actually implemented (along with rapid easing of monetary policy), most of the world's major advanced countries have suffered deep recessions, with output likely to remain well below its potential, and unemployment painfully high, for many years to come.
Australia was in a position to implement a fiscal response that was large relative to other advanced economies because it started in such a strong fiscal position. This in turn was because Australian Federal Governments of both political persuasions from the mid 1980s onwards demonstrated the resolve needed to bring deficit budgets back into surplus after the economy recovered from recession, and committed themselves to increasingly well-articulated medium-term frameworks for fiscal policy.
Thus, Australia was able to achieve a radically better macroeconomic outcome than was possible for other advanced countries. That outcome was achieved because Australia was relatively well placed for the reasons cited earlier, but also because both monetary and fiscal policy were in positions to respond as rapidly and substantially as they did.
A final critical argument is that the fiscal stimulus packages were not subject to explicit cost-benefit analyses. While it is beyond my scope here to provide such an analysis, it is worth spending a little time reflecting on what elements of the economic outcome would need to be taken into account to do justice to such an analysis.
Ergas and Robson (2009) present a cost-benefit analysis in which the sole benefit to the community of the fiscal packages is that they reduce consumption variability for the community's 'representative consumer'. Since aggregate private consumption is not very variable, Ergas and Robson conclude that the benefit of further reducing it is miniscule, and hence that counter-cyclical macroeconomic policy is largely misguided.11
But in contrast to this calculation, in my view, cost-benefit analyses of policies aimed at avoiding recessions need to take into account that recessions are disequilibria phenomena in which markets don't clear for extended periods of time.12 It is worth providing a brief summary of some of the benefits of avoiding a recession that would not be relevant if a recession was instead simply an equilibrium market outcome.
The first, and most obvious, benefit is that involuntary unemployment is lower than it would otherwise be. Among other things, lower involuntary unemployment implies less long-term unemployment and hence less skill atrophy and less general disaffection with society on the part of the long-term unemployed. The Treasury estimates presented in Chart 9 imply that the fiscal packages reduced the peak unemployment rate by 1½½ percentage points. I suspect, however, that this is an underestimate, both because it was calculated using conservative fiscal multiplier estimates, and because it takes insufficient account of the favourable feedback loop that I spoke about earlier when discussing the impact of expansionary macroeconomic policy on confidence.
But there are further benefits to avoiding a recession that would need to be taken into account in a realistic cost-benefit analysis of discretionary fiscal stimulus. Recessions break productive links between firms, and between firms and workers, when firms that would otherwise be viable over the long-term are driven into bankruptcy by a recession.13 In other words, plenty of the destruction that occurs in a recession is not creative destruction.
Finally, recessions do long-lasting damage, particularly to that cohort of people entering the labour market at the time the recession hits. Thus, for example, university graduates entering the labour market in a recession suffer sizeable initial earnings losses, losses that persist for a period estimated at between eight and fifteen years – that is, long after the recession has ended (Oreopoulos et al., 2006, Kahn 2009).
Long-term fiscal challenges in the major advanced countries
Let me turn now to the longer-term fiscal challenges facing the major advanced countries. Before the crisis, all major advanced countries had significant levels of government net debt. As a consequence of the crisis, their government net debt levels have risen substantially, because of a combination of the automatic fiscal stabilisers, discretionary fiscal packages and government-funded bailouts of financial systems. The IMF forecasts that government net debt for the G7 economies will rise to an average (PPP GDP-weighted) of over 90 per cent of GDP by 2014. Australian government net debt is forecast to be 10 per cent of GDP by then. Just to be completely clear then: my remarks in this section of the talk do not apply to Australia.
A high stock of government debt imposes costs on a country and its government. It leads to crowding out of private investment via higher real interest rates, imposes a continuing servicing burden on the government, and reduces its fiscal flexibility in dealing with unexpected adverse shocks. If government debt gets high enough, it can call into question the government's ability or willingness to service the debt. However, a strategy of reducing debt as quickly as possible without regard to the broader economic environment is likely to do more harm than good. With fragile recoveries in their own economies and high debt levels, the governments of the advanced countries are currently confronting a difficult trade-off. On the one hand, government debt as a share of GDP cannot be permitted to continue to rise indefinitely; on the other hand, too rapid fiscal consolidation could endanger the recovery.
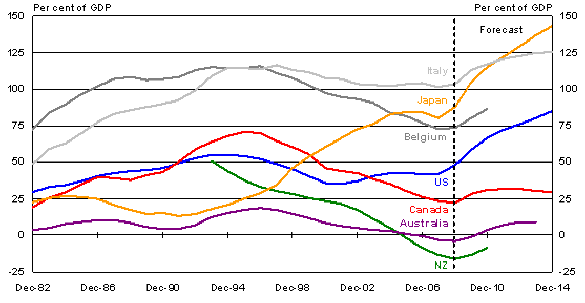
While it is prudent to remain concerned about rising government debt levels in the major advanced countries, the current and prospective debt levels are manageable. The historical record contains many examples of advanced countries that have demonstrated the resolve needed to stabilise government debt at these sorts of levels, and successfully reduce them over time (Chart 11).
During the 1990s, Italy and Belgium sustained net government debt above 100 per cent of GDP for several years, with government net debt in Italy still above 100 per cent. Around the same time, net debt in the US, Canada and New Zealand was between 40 and 60 per
cent of GDP.
Chart 11 – General Government Net Debt
Note: Data are as at end of calendar year, except for the Australian Government where data refer to financial years beginning 1981-82. Data are for all levels of government with the exception of Australia, which is central government only.
Source: IMF World Economic Outlook, OECD Economic Outlook and Treasury calculations
The experiences of Belgium, Canada and New Zealand since the mid 1990s are testament to the capacity of countries starting with large initial stocks of government debt to stabilise them as a share of GDP and then reduce them over time.
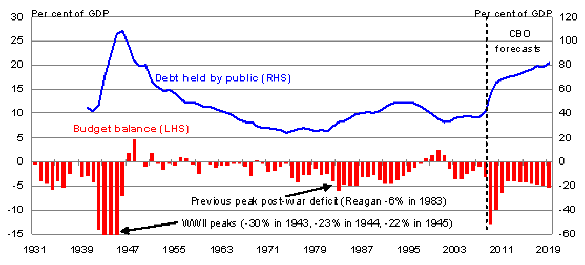
Looking over a longer time period, the US had public debt levels in excess of 100 per cent of GDP after World War II (as did Australia), significantly higher than US Federal government debt is expected to reach as a share of GDP by 2019 (Chart 12).
Chart 12 – US Federal Government Debt
Note: Forecasts from CBO's June Estimate of the President's Budget.
Source: OMB, CBO, Thomson Reuters.
The United States' experience after World War II provides a good example of a country running up a large stock of government debt over a short period of time, and then reducing it as a share of GDP gradually — though eventually very substantially — over subsequent decades.
As Chart 12 shows, this fiscal consolidation was achieved with a long period of close-to-balanced budgets. But balancing the budget was made easier because the average rate of US economic growth over the 30 years of fiscal consolidation was significantly higher than the average interest rate paid on government debt, and so the debt dynamics were particularly favourable (nominal GDP growth averaged 7.3 per cent per annum, while the nominal interest rate on long-term US government debt averaged 4.4 per cent per annum).
There are a few aspects of the current situation that make fiscal consolidation more challenging this time around. First, demographics are now working against governments, with ageing populations raising dependency ratios, and associated rising public health care and pension costs. Second, with many major governments increasing their call on the global pool of savings, long-term real interest rates are likely to rise as the recovery takes hold and investors regain an appetite for more risky assets. And third, as the events in Dubai last week remind us, undoubtedly there will be intermittent alarms about some countries' capacity or willingness to continue to service their debts, again with possible implications for interest rates.
Although the environment for fiscal consolidation in the major advanced countries is a challenging one, prospects for successful consolidation can be enhanced by countries agreeing to be bound by transparent fiscal rules. For such rules to become credible over time, it is particularly important that there be broad political agreement about the desirability of fiscal consolidation, and the steps that will be needed to achieve it. Such agreement has been a feature of the Australian federal political landscape for the past quarter century, and has been at least partly responsible for Australia's favourable fiscal outcomes over this time. Fiscal rules will gradually gain credibility provided countries demonstrate a resolve to adhere to them.14
Table 3 – Largest Debt Reductions through Fiscal Consolidation since 1980
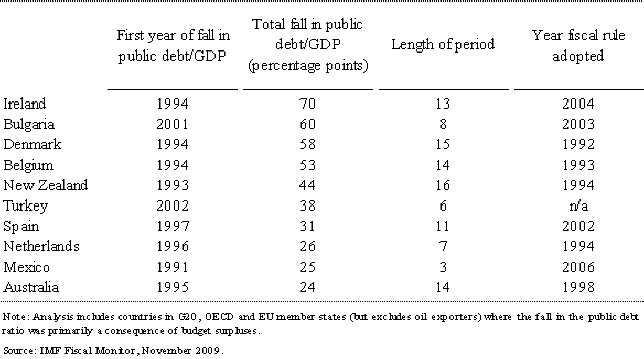
Recent IMF research (from which Table 3 is taken) supports this line of argument. On average, countries with fiscal rules have been able to achieve larger public debt reductions than those without.15 The IMF also notes that these rules can be successful when they are either enshrined in legislation or simply the result of a political agreement, with rules that specify budget targets and are consistent with a medium-term fiscal goal generally the most effective.
Conclusion
Several features of the global financial crisis conspired to make discretionary fiscal policy a particularly appropriate policy response. The contractionary shock was severe and highly synchronised across countries, which generated economic conditions particularly suited to a global fiscal policy response. The events surrounding the collapse of Lehman Brothers in mid September 2008 provided an unequivocal signal that a big contractionary shock was coming, and gave policymakers time to design and implement fiscal and monetary responses, without waiting for confirmation from macroeconomic data that the downturn had arrived.
For Australia, the evidence suggests that, without the discretionary fiscal action, the economy would have contracted not only in the December quarter 2008 (which it did) but also in the March and June quarters 2009, and that unemployment would have risen significantly more than it is now projected to do. The discretionary fiscal action appears to have contributed more to economic growth over the past year than did monetary policy, but its contribution to growth is expected to turn negative from early 2010 when, because of its longer lags, monetary policy will still be contributing to growth.
But it is also interesting to ask what the events of the past couple of years imply for the earlier consensus that discretionary fiscal policy is not well suited to playing a counter-cyclical role.
To my mind, that earlier consensus needs to be modified, but not abandoned. Recent events have been unusual, in ways that implied a particularly important role for discretionary fiscal action.
But that does not mean that large discretionary fiscal actions will be appropriate in response to all economic downturns. For more usual economic downturns – which are not likely to be associated with severe financial crises – the original consensus continues to apply. Monetary policy (in combination with the automatic fiscal stabilisers) is well suited to respond to such downturns, with discretionary fiscal action continuing to play a role, but a less prominent one. For such downturns, the difficulty of getting the timing right for sizeable discretionary fiscal policy responses remains a relevant policy consideration.
Australian Federal Governments of both political persuasions from the mid 1980s onwards demonstrated the resolve needed to bring deficit budgets back into surplus after the economy recovered from recession, and committed themselves to increasingly well-articulated medium-term frameworks for fiscal policy. That sustained fiscal discipline paid dividends. It meant that Australia retained a high degree of fiscal flexibility so that, when a once-in-80-year global financial shock arrived, Australia was in a position to implement a large fiscal response.
Australian government net debt has remained low over the past quarter century, and is projected to continue to do so over the next decade. By contrast, net government debt in most of the major advanced economies was quite high at the start of the financial crisis, and is projected to rise to an average (for the G7 countries) of over 90 per cent of GDP by 2014. Net government debt at these levels is manageable, but it cannot be permitted to continue to rise. Well-articulated fiscal policy frameworks offer the best hope for sustained fiscal consolidation in these countries, but these frameworks will n
ot be of much use unless they come with broad political and community support.
References
Agarwal S, Liu, C & Souleles, NS 2007, 'The Reaction of Consumer Spending and Debt to Tax Rebates - Evidence from Consumer Credit Data', Journal of Political Economy, vol. 115, no. 6, pp. 986-1018.
Berkelmans, L 2005, 'Credit and Monetary Policy: An Australian SVAR', RBA Research Discussion Paper, no. 2005-06, Sydney.
Broda, C & Parker JA 2008, 'The Impact of the 2008 Tax Rebates on Consumer Spending: Preliminary Evidence', viewed November 2009, http://faculty.chicagogsb.edu/christian.broda/.
Dungey, M & Pagan, A 2000, 'A Structural VAR Model of the Australian Economy', Economic Record, vol. 76, no. 235, pp. 321-342.
Epley, N, Mak, D & Idson, LC 2006, 'Bonus or Rebate?: The Impact of Income Framing on Spending and Saving', Journal of Behavioral Decision Making, vol. 19, no. 3, pp. 213-227.
Ergas, H & Robson, A 2009, 'The 2008-09 Fiscal Stimulus Packages: A Cost Benefit Analysis', Submission to the Senate Inquiry into the Government's Economic Stimulus Initiatives, September.
Frijters, P & Antic, N 2009, 'They seek him here, they seek him there: The missing production factor in economic downturns.', mimeo.
Gruen, D 2008, 'Opening Statement', Senate Standing Committee on Economics, 22 October, Canberra.
Gruen, D, Romalis, J & Chandra, N 1997, 'The Lags of Monetary Policy', RBA Research Discussion Paper, no. 1997-02.
Gruen, D & Stevens, G 2000, 'Australian Macroeconomic Performance and Policies in the 1990s', in Proceedings of a Conference – The Australian Economy in the 1990s, Reserve Bank of Australia, Sydney, pp. 32-72.
Ilzetski, E, Mendoza, EG & Vegh, CA 2009, 'How big are fiscal multipliers?', Centre for Economic Policy Research, Policy Insight, no. 39.
IMF 2009, 'Group of Twenty', paper prepared by the staff of the IMF for the G-20 Meeting of Deputies, 31 January-1 February, London.
Johnson, DS, Parker, JA & Souleles, NS 2006, 'Household Expenditure and the Income Tax Rebates of 2001', American Economic Review, vol. 96, no. 5, pp. 1589-1610.
Kahn, LB 2009, 'The Long-Term Labor Market Consequences of Graduating from College in a Bad Economy', draft of 13 August, Yale School of Management, viewed November 2009, http://mba.yale.edu/faculty/pdf/kahn_longtermlabor.pdf.
Kennedy, S 2009, 'Australia's response to the global financial crisis', speech to the Australia Israel Leadership Forum, 24 June.
Lawson, J & Rees, D 2008, 'A Sectoral Model of the Australian Economy', RBA Research Discussion Paper, no. 2008-01, Sydney.
OECD 2009, Interim Economic Outlook, Chapter 3: The Effectiveness and Scope of Fiscal Stimulus, OECD, Paris.
Oreopoulos, P, von Wachter, T & Heisz, A 2006, 'The Short- and Long-Term Career Effects of Graduating in a Recession: Hysteresis and Heterogeneity in the Market for College Graduates', National Bureau of Economic Research Working Paper, no. 12159.
Wilcox, DW 1989, 'Social Security Benefits, Consumption Expenditure, and the Life Cycle Hypothesis', Journal of Political Economy, vol. 97, no. 2, pp. 288-304.
* I am grateful to Anthony Brassil, Shane Brittle and Leigh Soding for much help in preparing this speech, and to Nicholas Gruen, Andrew Leigh, Tony McDonald and Steve Morling for helpful comments.
1 Elsewhere, I have provided a detailed chronology of the events leading up to the announcement of the first fiscal stimulus package on 14 October, 2008 (Gruen, 2008).
2 The largest component of the investment spending, the school-based infrastructure spending, has a number of elements to enable speedy construction. School land is available immediately without the need for planning approval; hence no planning delays. Further, schools chose from standard designs rather than developing their own, to speed up construction. School-based infrastructure spending has the advantage of providing stimulus to almost every population area of the country; useful because the economic slowdown was expected to be geographically widespread. Finally, school infrastructure projects have low import content, which raises the domestic stimulatory impact. Kennedy (2009) provides more detail on features of the stimulus package designed to ensure that it translated into spending in the economy as rapidly as possible.
3 Wilcox (1989) finds that anticipated increases in income influence consumption when the income is received, rather than when it is announced. Epley, Mak and Idson (2006) find that the way a windfall gain is 'framed' (described) affects the marginal propensity to consume. Windfall gains described as a 'bonus' (as the cash payments distributed under the Nation Building and Jobs Plan were described) rather than a 'tax rebate' induce people to spend more out of the additional income.
4 The 70 per cent assumption was chosen to accord with empirical evidence on spending out of temporary tax rebates (see Johnson et. al. 2006; Agarwal et. al. 2007 and Broda and Parker, 2008). This evidence is, of course, at odds with the permanent income hypothesis which predicts that spending from a one-off tax rebate would be spread evenly over consumers' lifetimes. It is also at odds with widespread 'Ricardian' behaviour by consumers, which would imply little or no rise in aggregate private consumption in response to cash transfers from the government.
5 In a standard Keynesian-style analysis (associated with the Keynesian cross diagram), these would be first-round fiscal multipliers. This spending would induce a rise in output, which would then stimulate consumption (and investment), further raising output, etc., leading to a larger overall fiscal multiplier. However, factors ignored in a standard Keynesian cross analysis, in particular, exchange rate appreciation and monetary policy response, would tend to limit the extent to which the fiscal multipliers were larger than the first-round estimates.
6 OECD multipliers are based on averages from various macro models surveyed for OECD countries, using simulations in which monetary policy is assumed to be accommodative. Adjustments are then made to allow for differences in openness across countries, and for the unique circumstances of the global financial crisis. These include the possibility of dysfunctional credit markets resulting in a larger number of credit constrained individuals — leading to higher marginal propensities to consume and larger multipliers. Offsetting this is the possibility of an increase in precautionary saving — leading to lower multipliers. The OECD judges the balance of these two factors to be on the downside and adjusts the multipliers accordingly. The range in year 2 includes a 'high' multiplier estimate which adjusts only for openness.
7 GRC also survey results from a range of models estimated for the Australian and US economies, which imply similar monetary policy lags. All suggest that output growth rises significantly in both the first and second years after a fall in the short-term real interest rate. More recent studies by Dungey and Pagan (2000), Berkelmans (2005) and Lawson and Rees (2008) provide similar results.
8 Of course, all these point estimates have significant margins of error. On another point, the GRC model was estimated using data from 1980 to 1996. Since then, household debt has risen significant
ly as a share of household disposable income. This increased indebtedness may have increased households' sensitivity to interest rate changes which, in turn, would have increased the impact of monetary policy on economic activity. Acting in the opposite direction, the global nature of interest rates cuts during the financial crisis implies that the exchange rate channel of monetary policy would have been muted.
9 This conclusion follows because interest rate rises and falls have equal but opposite effects on GDP growth in the GRC analysis. The reason for considering the pattern of interest rate changes in the text is that it accords quite closely with recent experience. The big cuts in the RBA cash rate in response to the financial crisis occurred between October 2008 and February 2009, over which time the cash rate fell by 3¾ per cent. (There were also ¼ per cent cuts either side of this period, in September 2008 and April 2009.) The first rate rise, by ¼ per cent, was a year later in October 2009, with subsequent ¼ per cent rises in the following two months.
10 The contrast with monetary policy is clear. The RBA Board meets monthly, and is in a position to change interest rates at any of those meetings, with or without any specific trigger.
11 Ergas and Robson do point out some of the shortcomings of their calculation, but they nevertheless regard their approach "as the most sensible starting point for thinking seriously about the possible benefits of countercyclical macroeconomic policy from an aggregate welfare-analytic point of view."
12 Anyone doubting that recessions are long-lived disequilibria phenomena needs to explain why the unemployment rate in the US is currently 10 per cent and is expected to remain well above most estimates of full employment for the next several years. (The reader can take as given that I do not accept that, en masse, millions of former US workers have voluntarily taken extended holidays.)
13 See Fritjers and Antic (2009) for more on this.
14 An obvious analogy is with independent central banks with mandated inflation targets finding it easier to achieve those targets over time, as credibility is built and inflation expectations are conditioned by the target.
15 The IMF notes, however, that most of these fiscal consolidations were also supported by robust real GDP growth and structural reform. That is, the reduction in public debt wasn't solely a result of fiscal rules.