Downloads
I am grateful to Jim Thomson for much help in preparing this talk, and to Gerry Antioch, John Edwards, Tony McDonald, Adam McKissack, Steve Morling and Bruce Paine for helpful comments. The views expressed are those of the author and not necessarily those of the Australian Treasury or the Australian Government.
Introduction
Thank you for the opportunity to speak to you today.
It is a pleasure to be again addressing the Australian Business Economists. I am reminded of the last time I spoke to you, at the Australian Business Economists Forecasting Conference in October 2006, about eighteen months ago.
At that time, the topics I addressed were the rapid cooling of the US housing market, and the continuing strong growth in China and its implications for Australia's resource sector and terms of trade. Sound familiar? I am also going to talk about those topics today.
I have found it instructive to re-read the speech I gave eighteen months ago. At that time I was reasonably optimistic that the rapid cooling of the US housing market that was underway would probably not lead to anything worse than a slowing in US economic growth. That is not my assessment today.
And it is particularly revealing, and humbling, to note that my speech eighteen months ago does not contain the term 'sub-prime'. While there were some wise heads at the time warning about developments in the US sub-prime mortgage market (most notably Ned Gramlich, Governor at the Board of the US Federal Reserve from 1997 to 2005) those warnings were not yet prominent in the mainstream analysis of the US macroeconomic outlook that I had read.
At the risk of plagiarising Donald Rumsfeld, it is sometimes the things you don't know you don't know that turn out to be of crucial importance. And it is also what makes macroeconomic forecasting as difficult, and as fascinating, as it is.
Today, my task is to give a broad overview of the developments likely to have a material impact on the Australian macroeconomy, and macroeconomic policy, over the next year or so.
Let me begin with international developments.
The slowdown in the United States
World economic growth is expected to slow from the high rates experienced in 2007, reflecting the sharp slowdown in the US economy, and the associated slowing in the rest of the developed world. The outlook for 2008 is for global growth around or a little below trend, supported by continuing strength in the large developing economies. This is a relatively benign central forecast, but global economic risks have obviously become more pronounced and represent a clear risk for the Australian economy.
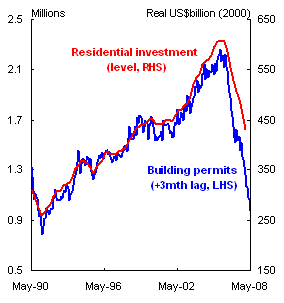
Thus far, the major dampening influence on US growth has been the huge contraction in housing construction, reflecting the unwinding of an oversupply of houses. Data on building permits (Chart 1) as well as housing starts and new home sales all suggest that residential investment has yet to bottom out.
Chart 1: The US Housing Market
Building Permits
Source: Bureau of Economic Analysis, Census Bureau
House Prices
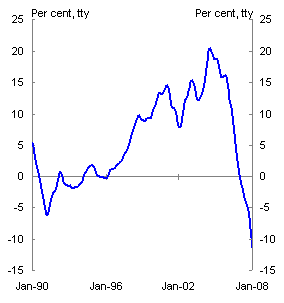
Source: Case-Shiller 10-City House Price Index
The construction downturn is being exacerbated by rising mortgage default rates, particularly in the sub-prime sector, and house prices that are now falling quite rapidly (Chart 1). This, along with other adverse developments, is feeding into a significant slowing in consumption growth.
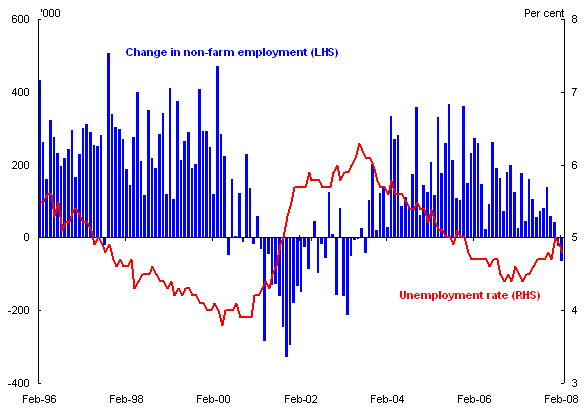
Non-farm employment in the US has started to fall in recent months, and the unemployment rate has been rising since the middle of 2007. At least thus far, the deterioration in the US labour market appears to be occurring more gradually than in the early 2000s (Chart 2). Notwithstanding this, it is clear that US economic growth has slowed sharply and many commentators think that the US is currently either in recession or close to it. The question is now: for how long is this sharp slowdown likely to persist?
Chart 2: The US Labour Market
Source: Bureau of Labor Statistics and Ecowin
None of us can give a confident answer to that question, but we can at least examine the factors that will have a material influence on the outcome.
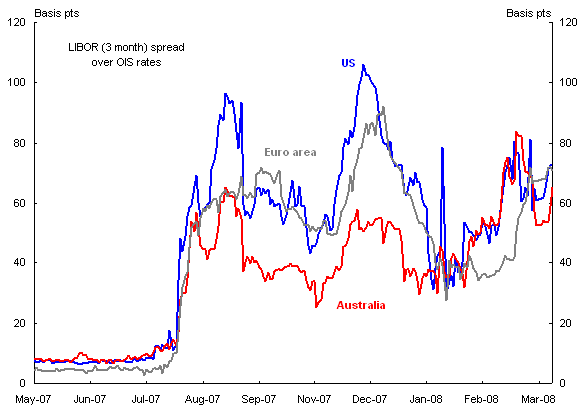
The factor most likely to prolong the slowdown is the spread of problems associated with rising defaults in the US sub-prime mortgage market to credit markets around the developed world, and the extent to which this leads to quantitative restrictions on the availability of credit. The Federal Reserve's Senior Loan Officer's Survey on Bank Lending Practices suggests that there had already been a substantial tightening of credit standards in the US by the middle of January, not only for sub-prime and non-traditional mortgages, but also for prime mortgages and commercial loans to medium and large firms.
Chart 3: Inter-bank Lending Spreads
(As at close 31 March 2008)
Source: Reuters
The drying up of liquidity in financial markets, and the associated sharp rise in spreads, which began in earnest in July-August of last year, is yet to show any convincing signs of abating (Chart 3). Furthermore, the historical record suggests that economic slowdowns that involve significant disruptions to the financial system and big falls in house prices tend to last longer than those that do not (see Reinhart and Rogoff, 2008).
On the more optimistic side, however, is the energetic response of US policymakers to the gathering economic and financial market problems. With almost unprecedented speed, Congress enacted, and the Administration approved, a fiscal stimulus package equivalent to about 1 per cent of GDP. While counter-cyclical fiscal policy is often viewed with scepticism, this example appears to be both big enough to make a material difference and particularly well-timed.
Having spent much of his distinguished academic career studying the Great Depression, the Federal Reserve Chairman, Ben Bernanke, is acutely aware of the dangers that a serious weakening of the financial system pose for the wider economy. Chairman Bernanke's intellectual background has undoubtedly contributed to the Federal Reserve's determination to move decisively, on a range of fronts, in response to the worsening conditions. The Federal Reserve has cut the Fed funds rate quickly, by 3 percentage points since September 2007, from a cyclical peak of 5¼ per cent to 2¼ per cent. The only time the Fed funds rate has been lower in recent history was following the bursting of the dot-com bubble at the start of the decade, when there were fears of deflation.
As well, the Federal Reserve has taken a series of steps to maintain liquidity in financial markets, and to demonstrate its willingness to prevent the collapse of any financial institution that it judges to be systemically important, even those, like Bear Stearns, beyond the usual purview of financial regulators.
And it is as well to remember that not all parts of the US economy are doing poorly. The continuing depreciation of the US dollar has generated a boom in US exports which, even
with the relatively low US export share, is currently contributing about 1 percentage point to through-the-year US economic growth.
China, the terms of trade and inflation
At the same time that economic growth has been slowing sharply in the US, China recorded its fastest growth in over a decade in 2007. Urbanisation and infrastructure development are continuing apace, driving rising demand for energy and raw materials. With rising incomes, consumption growth in China is accelerating.
China is facing an intensification of domestic inflationary pressures, and the authorities are acting to moderate economic growth. Nevertheless, continued strong growth in China is a political imperative, and the Chinese government has ample financial resources to support domestic growth should the US slowdown have a more serious adverse impact than is currently anticipated. Furthermore, the absence of highly sophisticated financial markets in China, as well as the relatively closed capital account, provides considerable insulation from the current financial turmoil, although China will not remain immune from spill-overs that arise from trade linkages with the developed world.
The rapid growth in China has fuelled a global boom in energy and raw materials prices that has benefited major commodity-exporting emerging economies such as Brazil and Russia. India is also expected to continue to grow strongly with strong net foreign investment supporting investment growth and the services sector continuing to expand.
It is a striking illustration of how much the world has changed over the past few decades that the contribution to world growth in 2007 from these four developing economies, Brazil, Russia, India and China (the BRICs) was roughly double the combined contribution from the three largest economic blocks in the developed world: the US, Japan and the Euro area (Chart 4). At this stage, there is every indication that this pattern of relative contributions to world growth will be repeated in 2008.
Chart 4: Economic Growth
(Annual per cent change)
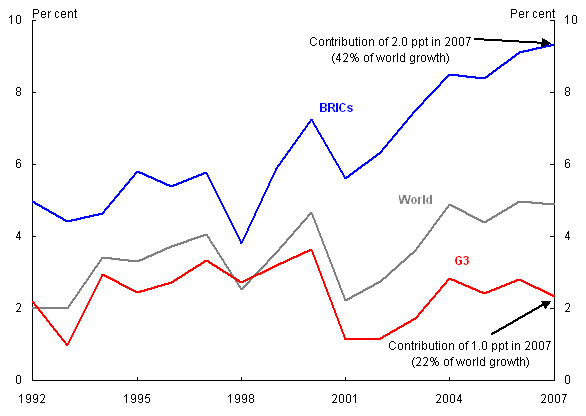
Note: G3 is US, Japan and Euro area; BRICs is Brazil, Russia, India and China. Growth rates use the new World Bank weights released in the IMF January WEO update.
Source: International Monetary Fund
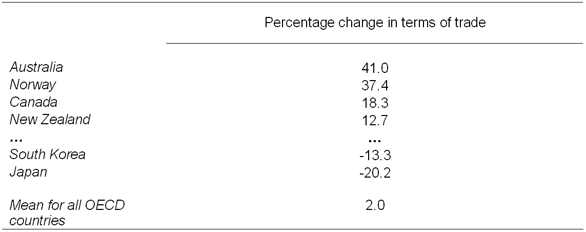
Australia has benefited more than any other developed country from the global boom in energy and raw materials prices. Ranking the 30 OECD countries in order of the size of their terms of trade gains over the past five years, Australia is at the top of the list with a rise of 41 per cent, closely followed by Norway, with 37.4 per cent, and then by Canada and New Zealand with rises between 10 and 20 per cent. At the bottom of the list are the commodity importers, South Korea and Japan, who have suffered quite sizeable falls in their terms of trade (Table 1).
It should be little wonder, then, that Australia's macroeconomic circumstances differ so substantially from those of most of the developed world.
Table 1: OECD countries ranked by the size of their terms of trade gains over the past five years (March qtr 2003 to Dec qtr 2007)
Source: OECD Economic Outlook, Export and Import Deflators
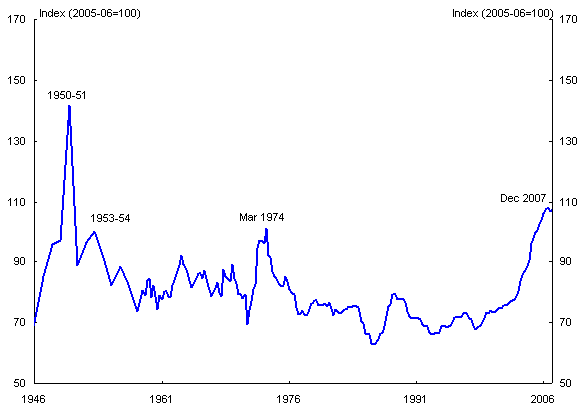
As a consequence of the big rises over the past five years, Australia's terms of trade are now at their highest level since the wool boom associated with the Korean War at the start of the 1950s (Chart 5).
Chart 5: Australia's Terms of Trade
Source: ABS Catalogue Number 5206.0 and Reserve Bank of Australia
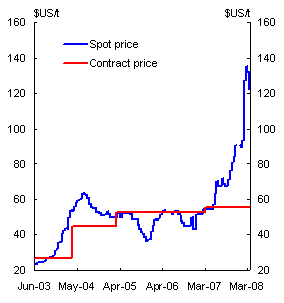
And there is significantly more to come. Huge rises in bulk commodity prices are now in prospect for mid 2008. Spot prices for iron ore and coal have risen sharply to be well above contract prices (Chart 6). Recent overseas contract prices settled for iron ore have involved $US price increases of around 65 per cent, and market analysts are predicting something like a further doubling of $US coal prices. New Australian contracts for both iron ore and coal are likely to be settled sometime between now and the end of June, and will apply from the beginning of April. By themselves, these could add more than 10 per cent to the terms of trade by the end of the year (Chart 7).
Chart 6: Contract and Spot Prices for Bulk Commodities
Iron Ore Thermal
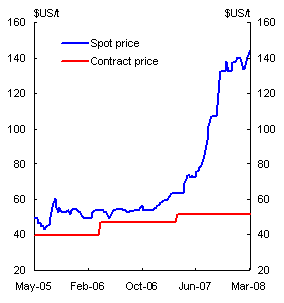
Source: ABARE and CCCMC
Coal (Newcastle)
Source: ABARE and Ecowin
Note: Spot price represents CCCMC spot price for Indian imports.
Chart 7: Estimated Impact of New Iron Ore and Coal Contract Prices on Australia's Terms of Trade
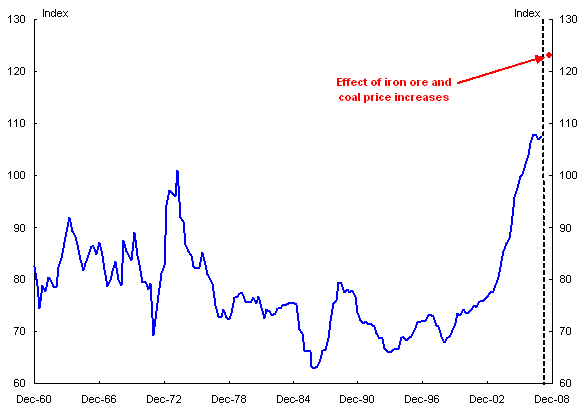
Note: Incorporates a doubling in the $US price of coal and a 65 per cent increase in the $US price of iron ore
Source: ABS Catalogue Number 5302.0 and Treasury
Rises in the terms of trade have contributed to rising capital inflow (and hence a larger current account deficit) and a higher exchange rate. The higher exchange rate plays a shock-absorber role for the domestic economy, imposing restraint on the non-mining export and import-competing sectors of the economy — manufacturing, services and agriculture (though the agricultural sector has been cushioned by rural commodity prices rising faster than non-rural commodity prices over the past year). The higher exchange rate also facilitates the reallocation of labour and capital to higher value uses in the economy.
Even with the higher exchange rate, the further terms-of-trade rises are likely to provide significant stimulus to the Australian economy. They will have direct impacts on the mining sector — leading to even higher profits and a firming up of commitments to investments that are currently in the planning stage.
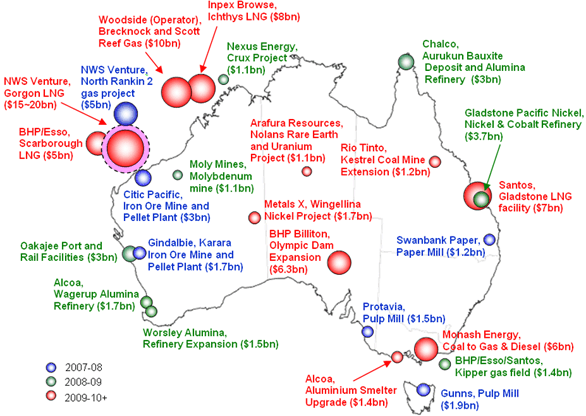
Chart 8: Selected Upcoming Mining Projects
Source: December 2007 Access Economics Investment Monitor (where possible a check has been undertaken)
A feeling for the vast scale of these projects is given in Chart 8. The Chart shows only those projects that have yet to enter the construction phase. Some of the projects are due to be completed over the next couple of years, but some will not begin until early in the next decade. Of course, the continued strength in the terms of trade will act to bring further projects onto the drawing board and, over time, from the drawing board to the construction phase, at which time they will make th
e most intensive demands on labour and capital as inputs into the projects.
There will be broader effects on the economy as higher investment stimulates employment and wages in a tight labour market. These stimulatory effects will occur even with the Government's commitment to bank any increases in government revenue associated with the stronger terms of trade. The stimulus will come at a time when inflationary pressures have been building.
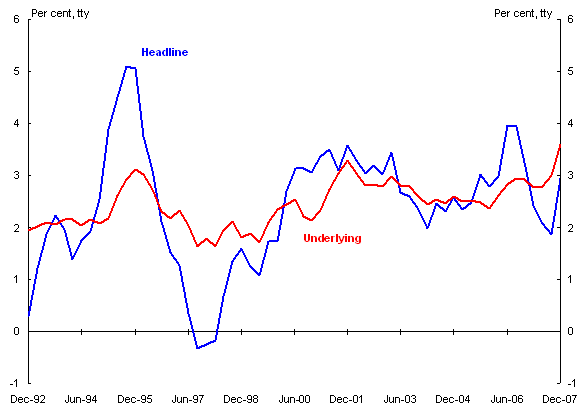
Under the medium-term inflation target, the Reserve Bank and the Government agree on the objective of keeping (headline) CPI inflation between 2 and 3 per cent, on average, over the cycle. As is widely understood, headline CPI inflation is subject to considerable short-run fluctuations due to one-off factors, and so the RBA looks to other measures to get a better feel for the rate of core or underlying inflation, particularly the trimmed mean and weighted median, which abstract from the largest price rises and falls in the component series that make up the CPI. Chart 9 shows headline inflation and the average of these two underlying measures over the low-inflation period that began in the aftermath of the early 1990s recession.
Chart 9: Headline and Underlying Inflation (ex. GST)
Note: Underlying inflation is an average of the RBA's trimmed mean and weighted median measures.
Source: ABS Catalogue Number 6401.0, Reserve Bank of Australia and Treasury
With the benefit of the most recent data, it is now clear that underlying inflationary pressures have been building for some time. Over the year-and-a-half from December 2003 to June 2005, underlying inflation (the average of the two measures) was running at an annual rate of 2½ per cent; over the subsequent year-and-a-half from June 2005 to December 2006, it was running at 2¾ per cent, while over the latest year, it has been running at 3.6 per cent.
Inflationary pressures reflect strong demand in the economy, and are currently also being exacerbated by a range of others factors including high oil, food, and financial services prices. Strong demand in the economy is broadly based, with particular strength in business investment (which is near 33-year highs as a proportion of nominal GDP) led by the mining sector. Continuing rises in the terms of trade are contributing to strong domestic demand and strong growth in disposable incomes. This is providing firm support for household consumption, although household saving is also rising. Strong income growth is also supporting strong growth in government revenues, which has been generating strong growth in demand from the public sector.
Strong investment is obviously a favourable development for the economy — additional capacity is being built that will raise the economy's growth potential. This will eventually take pressure off inflation, although the current strength of demand and the prospect of further rises in the terms of trade mean that demand pressures are likely to dominate in the near term.
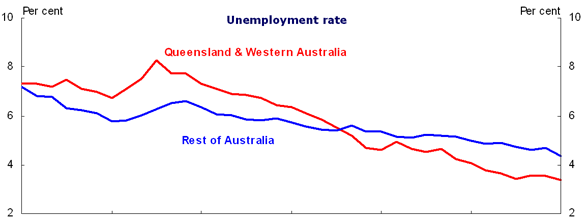
Sustained economic growth has seen the national unemployment rate fall to 4.0 per cent in February this year, its lowest level in 33 years. In the resource-rich states, unemployment has fallen faster and further – to 2.8 per cent in WA and 3.6 per cent in Queensland, but these unemployment rates have been accompanied by unsustainably rapid wage growth in those states (Chart 10).
Chart 10: Unemployment and wage inflation
Unemployment
Wage Inflation
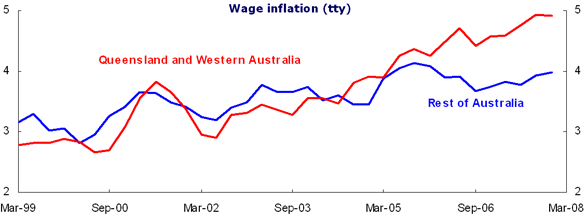
Note: The March quarter 2008 unemployment rate is an estimate based on January and February outcomes. Wage inflation is measured by the Wage Price Index.
Source: ABS Catalogue Numbers 6202.0 and 6345.0
To meet rising labour demand, immigration has become an increasingly important source of labour supply. Rapid increases in the number of immigrants in the skill stream have taken some pressure off wages and continued immigration flows will help to meet future labour demand. There are limits, however, to how quickly these migrants can be absorbed into the economy given the associated pressures on demand for housing and public infrastructure. Net overseas migration has added more than 650,000 people to the population in the past five years and on our projections a further 350,000 will be added in the next two years — a net addition of more than one million migrants to a total population of 21 million.
Implications for macro policy
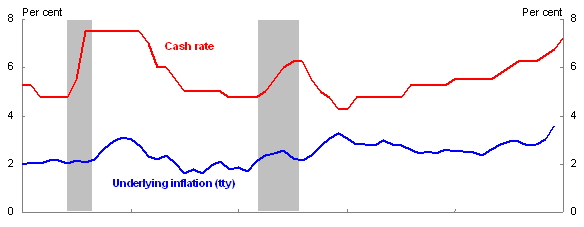
The gathering strength in inflationary pressures has prompted a series of interest rate rises by the RBA (Chart 11). Including the rise in the spread between official rates and borrowing rates imposed by Australian financial institutions in response to rises in their borrowing costs, borrowing rates for households and businesses have risen by around 1.3 to 1.4 percentage points since the beginning of August 2007.
Chart 11: Interest Rates, Inflation and Unemployment
Interest Rates and Inflation
Unemployment
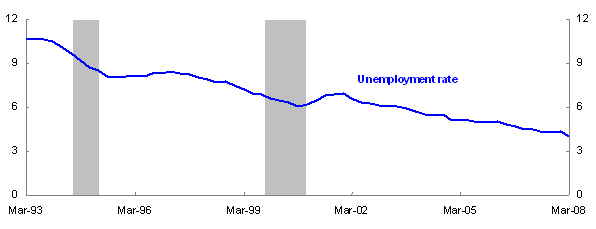
Note: The March quarter 2008 unemployment rate is an estimate based on January and February outcomes. Underlying inflation is an average of the RBA's trimmed mean and weighted median measures. The shading shows the previous two tightening phases.
Source: ABS Catalogue Numbers 6401.0, 6202.0, Reserve Bank of Australia and Treasury
This is a significant rise in borrowing rates, especially at a time when households are more highly indebted than ever before, which raises the potency of any given rise in borrowing rates. The ratio of household debt to annual disposable income is now around 160 per cent, up from around 100 per cent at the time of the 1999–2000 tightening, and around 65 per cent when interest rates were being raised in 1994.
Monetary policy is often described as a blunt instrument, but in many ways 'blunt' is not a particularly informative adjective. 'Blunt' might lead one to think that monetary policy acts across the economy in a roughly even fashion. In reality, however, monetary policy acts disproportionately on heavily indebted households and firms, and on housing investment. In the current environment, it also acts disproportionately on the non-resource export and import-competing sectors, via the higher exchange rate that goes with higher interest rates.
While monetary policy plays the primary counter-cyclical role in managing the macroeconomy, in the current environment, with a once-in-fifty-year surge in the terms of trade, fiscal policy also has a role to play. Tightening fiscal policy does not reduce the total amount of restraint required across the economy to contain inflationary pressures, but it can spread the necessary restraint more widely, and hence more evenly, taking some pressure off interest rates and the exchange rate. The Government's commitment to a surplus of at least 1.5 per cent of GDP and the ban
king of revenue surprises represents a discretionary tightening relative to last year's MYEFO of at least 0.3 per cent of GDP, which will assist monetary policy in managing demand pressures and spread some of the adjustment more broadly across the economy.
The aim of this tightening of macroeconomic policy is to slow the economy from its recent pace of growth — which has seen the unemployment rate fall at an average rate of about ½ a percentage point per annum over the past four years — in order to return inflation gradually to the 2–3 per cent medium-term target band.
Even with tighter macroeconomic policy, we can expect to see the mining sector continue to boom on the back of strong commodity prices, with flow-on benefits to other sectors, particularly construction. Furthermore, recent rains improve the prospect that the farm sector will bounce back from drought. With these sectors expanding briskly, the rest of the economy — that is, the non-mining non-farm economy — will need to grow quite slowly.
The aim, of course, is to achieve a soft landing for the economy overall. Soft landings require careful judgement, but achieving them should not be regarded as beyond the wit of policymakers. In the decade and a half since the introduction of the inflation targeting regime in the early 1990s, there have been two occasions when monetary policy tightening has led to a soft landing. These two occasions were in the periods following the 2¾ percentage point tightening over four months in 1994, and the 1½ percentage point tightening over nine months in 1999–2000.
On the first of these occasions, the unemployment rate, having fallen by about 2¼ percentage points over 1994 and the first half of 1995, rose by about ⅓ of a percentage point over the next eighteen months before beginning to decline again (Chart 11). On the second occasion, the unemployment rate, having fallen at an average rate of about ¾ percentage points per annum between mid-1997 and mid-2000, rose by about ¾ of a percentage point over the next year. In this case, this was partly due to other factors, including the end of construction for the Sydney Olympic Games and the whipsawing of dwelling investment in 2000 associated with the introduction of the GST in July of that year.
Conclusion
So, how can we sum up the economic outlook?
As a result of wide-ranging economic reforms over the past quarter-century to both the microeconomic structure of the economy and the macroeconomic policy frameworks, the Australian economy is probably more flexible and more resilient to economic shocks than it has ever been.
Notwithstanding this improved flexibility and resilience, however, I think it is fair to say that macroeconomic management of the Australian economy may be more challenging over the next couple of years than it has been at any time in the current economic expansion, now in its seventeenth year.
The key domestic policy challenge is to apply sufficient monetary and fiscal restraint to address the near-term inflationary pressures without generating too severe a slowdown. This requires careful judgement at the best of times, and these are not the best of times. The task is being complicated by the powerful international economic forces that are pushing the Australian economy in opposing directions. On the one hand is the worsening economic outlook in the US, and the associated financial turmoil, which is yet to show any convincing signs of abating. On the other hand is the continuing economic strength in much of the developing world, particularly China, which is supercharging resource prices, and which benefits Australia's terms of trade more than those of any other developed country.
These are indeed challenging times for domestic macroeconomic policy.
Reference
Reinhart, Carmen M. and Kenneth S. Rogoff (2008), "Is the 2007 U.S. Sub-Prime Financial Crisis So Different? An International Historical Comparison", NBER Working Paper 13761, January.