Downloads
Thank you for the opportunity to speak to you today about the Treasury modelling on the economics of reducing greenhouse gas emissions. The report, Australia's Low Pollution Future, was released by the Treasurer and the Minister for Climate Change and Water on 30 October.
1. The report is a serious analytical piece. It is more comprehensive than any previous Australian study. It deserves to be taken seriously.
Treasury's climate change modelling exercise is the most extensive modelling exercise ever undertaken by the Australian Treasury.
It began eighteen months ago, when the Treasury established a climate change modelling team which gradually built to a strength of eighteen dedicated staff. We drew on resources from across the public sector, including the Productivity Commission, ABARE, the Reserve Bank and the Department of Climate Change. Much of the work was done in partnership with the Garnaut Climate Change Review, with expert input from Professor Garnaut and his team.
Eight external consultants contributed to the modelling, including national and international experts in economic modelling of climate change policy such as Professor Warwick McKibbin and Professor Philip Adams. The Treasury also received invaluable input from industry and environmental groups.
The team consulted with and received support from international experts, including in the OECD, International Energy Agency, and the IMF.
The report presents integrated economic modelling of climate change policy across global, national, sectoral and household scales.
This is a first for Australia. Previous studies have generally focused on one dimension in isolation from the others. But the links are crucial.
Australia is a small open economy, so will be significantly affected by what other countries do. Emission and energy-intensive commodities comprise a large share of Australia's exports, so trends in global demand for these commodities have important implications for us. The Government plans to link Australia's Carbon Pollution Reduction Scheme (CPRS) to other emission markets around the world. This will allow Australia to access mitigation in other countries, reducing the cost of our contribution to the global mitigation effort.2
Whole-of-world and whole-of-economy analysis takes account of the dynamic interactions between supply and demand, and the competition for resources.
Sectoral analysis provides detailed insights into the transformational process, including possible pathways for technological transformation of key emission-intensive sectors.
Household impacts often get much less attention. The Treasury used its own models to examine the potential initial distributional impacts of the CPRS.
With insufficient time to build a completely new Computable General Equilibrium (CGE) model, Treasury drew on a suite of existing models. Through a rigorous quality assurance process, the team worked with the consultants to update databases, restructure and expand the coverage of the models, and incorporate the latest research on mitigation potential across the economy. This investment improved the quality of the study, and will also improve the quality of future analysis.
We are, therefore, confident that the report provides a comprehensive and robust account of the potential impact on the Australian economy of national, global and sectoral action to reduce emissions.
Nevertheless, like most economic analysis of policies to reduce emissions, the Treasury modelling does not incorporate the potential impacts of climate change itself.
None of the scenarios modelled incorporate the costs of climate policy uncertainty, the impacts of climate change, or the costs of adapting to a changing environment. Nor do the policy scenarios incorporate how these costs and impacts might change if emissions are reduced.
The report is not a cost-benefit analysis, so it needs to be evaluated in the broader context of all the costs and benefits of reducing greenhouse gas emissions.
2. Based on current scientific understanding, on the balance of probabilities, reducing global emissions will reduce the risk of dangerous climate change.
Let me say a few words about the science of climate change before returning to the economic modelling.
I am not a climate scientist. I do have an honours degree and a PhD in science, so I have some idea of the scientific method and the nature of scientific evidence. And I have taken a keen interest in the debate about the science of climate change in the eighteen months I have been involved with the climate modelling exercise within Treasury.
Climate change is clearly a complex and evolving area of scientific enquiry. Given its complexity, as well as the far-reaching implications of alternative possible judgements about the scientific evidence, it is not surprising that there are some significant differences between climate scientists about precisely what we know, and with what level of confidence we know it.
But how should non-experts like you or I assess the scientific evidence on climate change? On this question, I agree wholeheartedly with Ross Garnaut, when he says:
"The [Garnaut Climate Change] Review takes as its starting point, on the balance of probabilities and not as a matter of belief, the majority opinion of the Australian and international scientific communities that human activities resulted in substantial global warming from the mid-20th century, and that continued growth in greenhouse gas concentrations caused by human-induced emissions would generate high risks of dangerous climate change."3
I agree with Professor Garnaut that the relevant yardstick with which to assess the scientific evidence on climate change is not what we know for sure, but what we know on the balance of probabilities. And, on the balance of probabilities, continued growth in greenhouse gas concentrations would generate high and rising risks of dangerous and potentially irreversible climate change.
This seems to me the appropriate place to begin the economic analysis.
If we accept the majority scientific opinion as a reasonable starting point, then it seems appropriate to presume that the world will eventually act to decisively slow and then reverse the increase in greenhouse gas emissions (although none of us can be sure precisely when the world will act decisively).
To assume otherwise – that is to presume that the world's major emitters will not act at any time to decisively reduce greenhouse gas emissions – is to presume that the world will gradually succumb to potentially catastrophic damage to the global environment.4 And that is not a presumption with which any of us should feel comfortable.
This line of logic leads to the conclusion that it makes sense to model the economic costs to Australia of reducing greenhouse gas emissions in a world in which there is a global limit, imposed gradually over time, on the concentration of greenhouse gases. And that is precisely the framework in which the Treasury modelling has been conducted.
This framework has important implications for what the modelling tells us about the relative costs of early as opposed to delayed action.
3. Assuming that the world eventually acts on climate change, there are economic advantages to acting early.
Assuming that the world eventually acts on climate change, the modelling shows it makes economic sense for Australia to act early.
Economies that defer action face higher long-term costs. This is because more emission-intensive infrastructure is locked in place in the meantime. As a result, late movers face a greater adjustment task when they do act. Global investment is then redirected to early mov
ers.
In the scenarios modelled, economic costs in 2050 for early movers are around 15 per cent lower than when everyone acts together, while costs for late movers are around 20 per cent higher.5
This finding might come as a surprise to some, who expect that Australia will lose competitiveness and face high costs if it acts ahead of other economies.
But this finding is in fact analogous to Australia's experience with tariff reductions. Imposing an emissions price gradually changes the orientation of the economy towards lower emission sectors. These are the sectors that will provide the basis for Australia's long-term comparative advantage in a world in which an eventual global constraint is imposed on greenhouse gas emissions – just like tariff cuts which move the economy towards its true comparative advantage.
No doubt, we will see a lot of competing analysis released in the coming days, months and years.
We welcome this analysis. Ideas are ultimately contestable. Economic modelling of climate change policy, particularly over the long term, requires concrete assumptions in areas in which there is genuine and profound uncertainty. Expert opinion will vary, and this will be reflected in differences across studies.
This brings me to my next point. Despite different opinions about the timing and nature of global action, the availability and cost of technologies, and the precise details of Australia's CPRS, differences between estimates of the aggregate economic impacts of mitigation policy aren't as great as you might think.
4. Estimates of the economic cost of reducing emissions are not that different across studies. What varies most is not the results, but how they are presented.
There is a lot more consistency across studies – including the Treasury's – than the headlines suggest. Differences are often more to do with presentation than substance. Consider the following example:
- GNP is 4.7 per cent lower at 2050;
- GNP is $208 billion lower at 2050;
- Annual GNP growth slows by 1/10th of 1 per cent out to 2050;
- GNP is 4.4 times higher than 2000 levels in 2052 instead of 2050, a delay of two years.
These are different ways of presenting the same result.
Economic modelling results are often presented as a change relative to a reference case – the "4.7 per cent lower at 2050" measure. This is a sensible approach when you're interested in how a particular policy could influence the economy in isolation from other events. It indicates the scale of the impact, and allows comparisons across years and across studies.
However, a reduction from the reference case is not the same thing as a reduction from today's levels. Where the reference scenario projects growth, the reduction generally corresponds to slower growth rather than an absolute reduction.
For long-term analysis, differences in growth rates can be more informative, and less prone to misunderstanding.
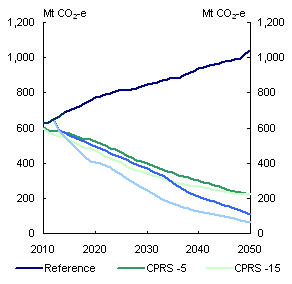
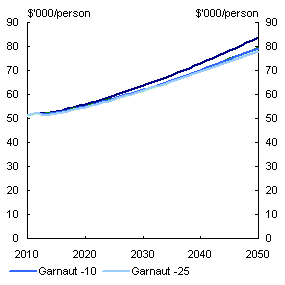
The report finds that Australia and the world continue to enjoy robust economic growth while making the emission cuts required to reduce the risks of dangerous climate change. Even ambitious emission reduction goals have limited impact on national and global economic growth (Chart 1).
Chart 1: Headline Results
Emissions
Real GNP per capita
Source: Treasury estimates from MMRF.
GNP per capita grows at an annual rate of 1.1 per cent in the policy scenarios, 1/10th of 1 per cent less than the 1.2 per cent annual growth in the reference scenario.6
Gross world output grows at 3.3-3.4 per cent per year in the policy scenarios, compared to 3.5 per cent in the reference scenario.
This is wholly consistent with the results of previous studies.7
The Treasury report does not examine unilateral action by Australia. Unilateral action is not consistent with the Government's policy, nor with what can already be observed internationally (as was detailed earlier).
How does a decline in annual growth in GNP per capita of 1/10th of 1 per cent compare to other challenges facing the Australian economy?
Treasury's analysis of the likely impact of Australia's ageing population provides an interesting point of comparison. The Intergenerational Report (2007) projected that the big fall in fertility in the 1960s and 1970s, combined with continual increases in life expectancies, will lead to an annual growth rate of GNP (or GDP) per capita over the next 40 years that is ½ per cent slower than over the past 40 years.
Thus, the effect of changed demographics in the Australian population is projected to lead to a slowdown in annual per capita growth five times larger than the slowdown projected here. As the Intergenerational Report made clear, adjusting to demographic change will require economic and social adjustments in the Australian economy, but these adjustments should prove manageable. Much the same comment applies to the economics of significantly reducing greenhouse gas emissions.
It is important to keep in mind the magnitude of these aggregate economic costs when evaluating the sectoral impacts of mitigation policy, and in particular, structural adjustment needs.
The Australian economy will adjust gradually from its current structure. Mitigation policies introduced in coming years will change the pattern of future economic activity, so the reference scenario economy of 2050 will not eventuate. Today's economy provides a useful reference point from which to evaluate sectoral impacts.
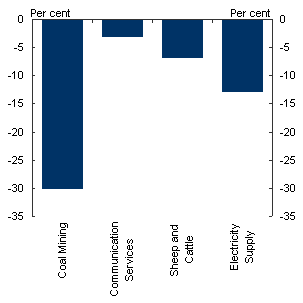
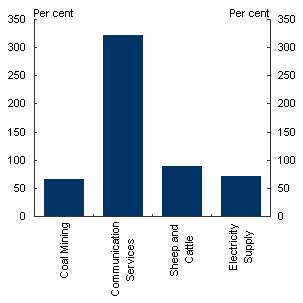
For example, the modelling indicates that the gross output of many sectors in the economy falls relative to the reference scenario, but rises significantly relative to current (2008) levels (Chart 2).8
Chart 2: Sectoral Output in 2050
Change from reference
Change from 2008
Source: Treasury estimates from MMRF.
For these sectors – and for most others that fall relative to the reference scenario – growth continues, albeit at a slower pace than we might expect in a world without emission pricing.
Growth in other sectors – such as iron ore mining, other animals, forestry and renewable electricity generation – accelerates.
Only aluminium production, petroleum refining and coal-fired electricity are projected to contract relative to today's levels of production, because of emission pricing.9
5. We've taken great care in developing the modelling assumptions. The assumptions used represent the Treasury's best assessment of plausible central estimates within the range of possible values.
Models cannot clear away the fog of ignorance through which we all gaze at the future. They are not crystal balls.
Models need firm assumptions and these assumptions become more difficult t
he further out we look. Imagine trying to foresee the current state of the world from the perspective of 1908. 1908 saw the beginning of the popular use of cars, with the production of the Model T Ford. The first two-person plane flew in May of that year. Australia's GDP per capita was around the same level as China's is today. Agriculture accounted for over 15 per cent of Australian employment.
In 2008, Australia and the world looks very different from this. Likewise, it is impossible today to foresee the state of the world in 2050 or 2100. But from the perspective of today, economic models, while clearly imperfect, are the best analytical tools available.10
Treasury consulted widely with government, industry and other non-government stakeholders to gather information about input assumptions, did extensive research, and drew on domestic and international experts.
Expert opinion on many relevant issues varies widely. The assumptions represent Treasury's best assessment of plausible central estimates within the range of possible values. Where possible, we used sensitivity analysis to explore how different assumptions – including for resource prices, timing and coverage of policy action, and the cost and performance of key technologies – might change the cost estimates.
Our assumptions regarding carbon capture and storage (or CCS) technologies have attracted some attention, and I have included an appendix on this issue.
Clearly, the particular mix of mitigation activities projected in the modelling reflects the assumptions made. Supply-side opportunities to reduce emissions, and demand-side responses to changes in relative prices, are uncertain, particularly over the longer term. As a result, it is impossible to accurately predict how much mitigation will occur in each sector and in each year.
This is precisely why it is more efficient to create mitigation incentives across the whole economy, rather than target specific emission sources or sectors. Broadly-based market-oriented policies, such as the Carbon Pollution Reduction Scheme, allow the market to respond as new information becomes available.
This brings me to my final point.
6. The modelling is not diminished by the global financial crisis.
Like much long-term analysis, including that presented in the Intergenerational Report, the modelling focuses on medium to long-term trends in the economy rather than shorter run fluctuations.
The actual path of Australian and global economic growth from now out to 2050 will be affected by a wide range of factors. Business cycles and economic shocks, such as the current global financial crisis, will have significant impacts on the economy in the short term.
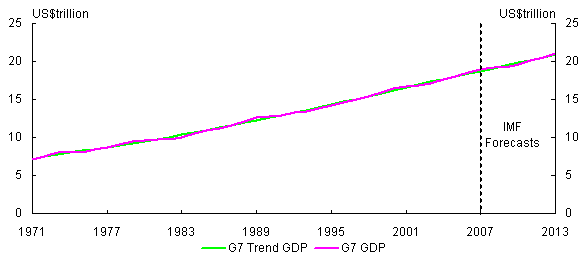
However, this should not materially affect the analysis in this report. This is because, over long time frames, trends provide a reasonable approximation of actual economic growth.
Chart 3: G7 Economic Output
Actual and Trend
Source: IMF World Economic Outlook October 2008 and Treasury.
As Chart 3 shows, actual growth in the G7 economies rises and falls as economic shocks – such as the oil shock of the mid-1970s, the global recession of the 1980s, and the dot com boom and bust of the early 2000s – work their way through the economy. On the far right hand side of the chart, you can see the IMF's October 2008 forecasts for the next five years. The global financial crisis means that G7 economic growth is forecast to be clearly below trend – but only for a few years.
But it's the trend, not the wiggles, which is important in assessing climate change mitigation. It is the trend in economic activity over the next four decades, not the next four months or four years, along with a myriad of other detail about the longer-term structure of the Australian and global economies, which is important for assessing what profile for emission prices is required to generate any given environmental outcome. And it is economic analysis over these time scales that is relevant for an assessment of the longer-term economic costs of reducing greenhouse gas emissions.
Treasury's climate change modelling exercise represents a major undertaking, with input from a wide range of experts. We have taken great care to use assumptions that represent our best assessment of plausible central estimates within the range of possible values.
No modelling exercise can offer the last word on an issue as complex as the economics of reducing greenhouse gas emissions. But we are confident that the report provides a comprehensive and robust account of the potential impact on the Australian economy of national, global and sectoral action to reduce these emissions.
Thank you for your attention.
Appendix: Carbon Capture and Storage (CCS) Technology Costs
The availability, cost and performance of low-emission technologies are an important determinant of economic costs. For Australia, CCS technologies are particularly important, as they are likely to underpin future global demand for our coal resources.
The Treasury consulted widely in developing its assumptions for this key technology, including with industry, the International Energy Agency, international experts such as the Electric Power Research Institute, and local experts such as the Cooperative Research Centre for Greenhouse Gas Technologies. The Treasury contracted with MMA and ACIL-Tasman to provide specific research, and we also reviewed a wide range of published studies on the topic.
The results of this research are reflected in the modelling assumptions regarding when CCS technologies become available, the performance of those technologies, and the emission price at which they become competitive with other low-emission options.
The modelling finds that CCS for coal in Australia is deployed when the emission price reaches a value in the range $45-$80/t CO2-e (Australian dollars, 2005 prices), growing at 4 per cent per year. (The exact initial price within this range varies by scenario.)
A recent response to Treasury's report asserts that the Treasury modelling assumes "that coal CCS technology is generally deployed at a carbon price of $45 per tonne of CO2-e", and that "[w]ork by Concept Economics suggests a more realistic carbon price spectrum of between $60-$90 per tonne before such technology is economically viable."11
In fact, the Treasury modelling range of $45-$80/t CO2-e (Australian dollars, 2005 prices) is within the range of industry estimates and significantly overlaps the Concept Economics range of $60-$90/t.
The Concept Economics' critique also states that:
"[t]he International Energy Agency has estimated the cost of carbon capture and storage to be between USD40 (AUD57) and USD90 (AUD128) per tonne of CO2 captured and stored."
In fact, the cited source states that:
"The IEA has noted that the cost of CCS is estimated to be between USD 40 and USD 90 per tonne of CO2 captured and stored; and that with the most cost-effective technologies, capture costs are as low as USD 20-40 per tonne of CO2 (IEA, 2006a). Transport would add as much as a further USD 10/tonne. The IEA concluded that the future cost for CCS will depend on which technologies are used, how they are applied and how far costs fall as a result of R&D and learning realised during market uptake."12
Given the importance of CCS technologies, and the range of expert views, the Treasury modelling includes sensitivity analysis which explores the pos
sibility of improved performance, and the possibility that CCS might not prove commercially viable. If CCS does not prove commercially viable, other technologies are deployed. Global mitigation costs in 2050 are around 10 per cent higher, and Australia's costs are around 25 per cent higher than under central assumptions.13
1 I am extremely grateful to Kath Rowley and Robert Ewing for their help with this speech.
2 There has been some critical commentary about our modelling of the timing and extent of mitigation efforts by other countries across the globe. There will always be disagreement about exact details. But in our view the assumptions about global action are consistent with current international trends. Emission trading is already operating in 27 European countries, New Zealand is introducing emission trading this year, around 30 states and provinces in the United States and Canada are introducing emission trading, United States President-elect Obama has committed to introducing schemes to reduce emissions, and Japan is trialling emission trading and intends to introduce a full-scale domestic scheme in 2010 or 2011. For developing countries, constraints on emissions in the policy scenarios are imposed gradually over time. In the CPRS policy scenarios, China's allocation of emissions continues to rise until around 2030, and India's until around 2040.
3 Garnaut Climate Change Review (2008) p23.
4 The prehistoric peoples of Easter Island took this path, and paid the price (Collapse, Jared Diamond, 2005). We would do well not to follow their lead. Another logical possibility is that majority scientific opinion is simply misguided and will turn out to be a fad. However, to invoke such a possibility as a basis for deciding on public policy seems to me extraordinarily foolhardy.
5Australia's Low Pollution Future, Box 5.4, p104. Early action could also bring other benefits not captured in the economic models, like reducing policy uncertainty and allowing a more planned and gradual adjustment for capital and labour. Delay means you need to do more in a shorter time to secure the same environmental outcome.
6 To be precise, the annual growth rate of GNP per capita is slightly different across the four policy scenarios but rounds to 1.1 per cent when expressed to one decimal place. Results are rounded to avoid implying a false sense of precision.
7 Even worst-case scenarios in previous studies indicate deep cuts in emissions are consistent with robust economic growth. In July 2006, ABARE published a study which included a scenario in which Australia unilaterally takes much stronger mitigation action than all other countries (Economic impact of climate change policy: the role of technology and economic instruments, ABARE research report 06.7). All of the additional action is done within Australia, rather than through international emissions trading. It also assumes fairly limited mitigation opportunities, and no technology cost reductions stemming from learning-by-doing. The emission price in Australia rises to over A$600/tCO2-e in 2005 prices, and Australia's GDP is 10.7 per cent below the reference scenario in 2050. This corresponds to average annual GDP growth of 2¼ per cent over the 2010-2050 period, compared to 2½ per cent in the reference case. In other words, annual GDP growth falls by ¼ of 1 per cent.
8 Results from Table 6.11, Australia's Low Pollution Future, p164.
9 The contraction in aluminium reflects the relatively high emission-intensity of aluminium production in Australia. With an effective global response to climate change, low-emission producers will gain a comparative advantage. Australia is likely to lose competitiveness in aluminium production, so its share of global trade in aluminium declines. The contraction in coal-fired electricity (a domestic rather than trade-exposed sector) reflects the shift to lower emission technologies, such as gas in the medium term and renewables in the longer term.
10 I sometimes imagine the choices we face like this: You can inform policy decisions by using admittedly fallible economic models, or you can ask your uncle. I, for one, have never hesitated over this choice. (With apologies to Alan Blinder, The Lionel Robbins Lecture, 1998.)
11 Concept Economics, 2008. "Treasury Modelling Assumptions on Climate Change Mitigation Policy: Key Issues", prepared for the Minerals Council of Australia.
12 http://www.iea.org/Textbase/work/2008/asean_training_coal/Clean_Coal_CIAB_2008_WEB.PDF
13Australia's Low Pollution Future, Table 6.9, p158.