Downloads
***Check against delivery***
Introduction
Thank you for the invitation to be with you today. This is my fourth, and last, ABE Post-Budget address as Treasury Secretary. They have been among the highlights of the year in terms of public presentations for me, providing an opportunity to reflect on some of the big issues confronting Australia. I hope my successor continues the tradition started more than two decades ago by Ted Evans.
Since becoming Treasury Secretary, there have been three constant themes in my public speeches:
- the drivers of change that are reshaping the globe, and changing the environment in which Australia is operating, with all the opportunities and challenges that presents;
- the risks to future living standards resulting from an ageing population, declining terms of trade, and weak productivity performance; and
- the importance of ensuring fiscal sustainability and, in particular, of addressing the two significant gaps between what the public expects of government and what governments can actually do, and between what people expect of government and what they’re actually willing to pay for.
Last Tuesday’s Budget has attempted to tackle head-on the sustainability challenge and these two gaps.
Restoring Australia’s fiscal sustainability cannot be wished into being, nor can we rely on growth to drive us to surplus — the underlying momentum of expenditure, both actual and promised, is too rapid. And we cannot simply hold on to fiscal drag over the coming decade and beyond as that will cruel participation incentives.
As I noted at the Sydney Institute in early April, returning the Budget to surplus must be underpinned by policy change — by individual, hard decisions – not assumptions.
The story of this Budget has distinct elements, three of which I want to touch on today.
- First, the measured pace of fiscal consolidation, which reflects both the short-term economic realities and a conscious decision to focus on structural reforms to build fiscal resilience. Some of these structural reforms go to the heart of the two sustainability gaps.
- Second, a compositional switch in expenditure, with current consumption being reduced and investment in new assets being prioritised.
- Third, a decision to ensure headroom for future tax cuts to offset the effects of fiscal drag, which is damaging for workforce participation and reduces the progressivity of the tax system.
In addition, I want to step back and look again at the challenges to productivity and living standards that confront Australia. In doing so, I want also to reflect not just on the income benefits from improving productivity, but also on the distribution of those gains.
The measured pace of fiscal consolidation
The backdrop for last week’s Budget and the Government’s fiscal consolidation efforts is an economy that is growing at a below-trend rate as we transition from the largest resources investment boom in our history to broader-based growth.
Over the past decade, investment in the resources sector has more than quadrupled as a share of GDP and its capital stock is now three times larger. However, from 2014-15, resources investment is expected to start sharply subtracting from growth.
With the resources boom continuing its transition to the production phase, resources exports (particularly iron ore and LNG) will begin to make up a greater share of real GDP growth, but the reality is that we need other sectors of the economy to grow more rapidly to keep unemployment low.
We are seeing some positive signs, particularly in the household sector. But with businesses in the non-resources sectors continuing to exercise caution in their investment and hiring decisions, the forward indicators suggest that it will be at least another year or two before strong broad-based growth takes hold.
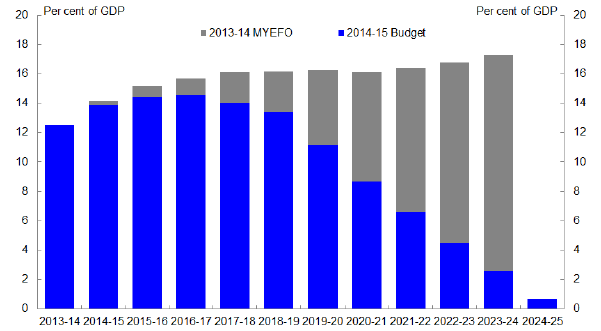
Against this backdrop, the Government’s fiscal consolidation measures are weighted towards medium-term structural savings that build over time, with the 2014-15 Budget imposing modest additional fiscal consolidation over the next three years relative to the 2013-14 MYEFO.
Chart 1: Improvement to the underlying cash balance since the 2013-14 MYEFO
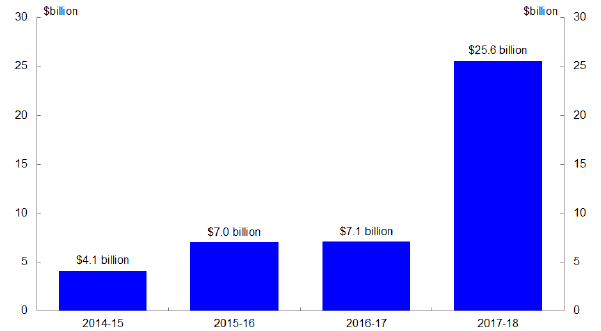
Note: The 2017-18 figure is based on the difference between the 2013-14 MYEFO medium-term projection for 2017-18 and the 2014-15 Budget estimate.
Source: Treasury.
This aims to strike a balance between restoring the structural integrity of the budget and not placing excessive pressure on the economy as we transition to broader-based growth.
Relative to the MYEFO, the pace of consolidation picks up significantly from 2017-18 when the transition to broader-based growth is expected to be well-established and on a timeframe where monetary policy can operate to keep the economy close to full employment and inflation within the target band.
Chart 2: Net impact of policy decisions on the budget balance
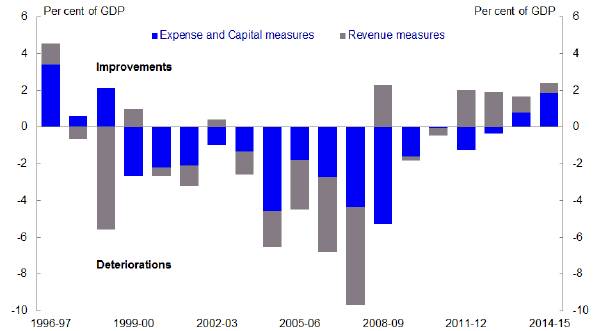
Note: Each column represents the four-year impact of policy decisions made that year, based on data at time of publication. It assumes policy decision were implemented. Columns up to 1999-2000 include impacts on public debt interest. Columns up to 1999-2000 reflect cash impacts; subsequent columns reflect fiscal impacts.
Source: Treasury.
Another way to demonstrate the measured pace of fiscal consolidation is to look at the net impact of policy decisions in the 2014-15 Budget over the four years of the forward estimates. As you can see from the chart, examined from this perspective, last week’s Budget implies considerably less near term fiscal consolidation than intended in 1996-97.
While the pace of fiscal consolidation is measured, the Government’s focus on long-term savings that build over time means that the structural payoff is large.
Chart 3: Structural budget balance estimates – 2014-15 Budget
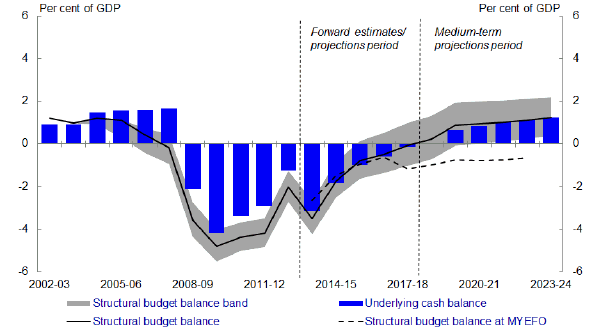
Note: The structural budget balance at MYEFO (dashed line) differs from the estimates published in the 2013-14 MYEFO as it reflects the impact of the change to the medium-term economic projections methodology made at the 2014-15 Budget to ensure comparability.
Source: 2014-15 Budget Paper No. 1, Statement 3 and Treasury.
At the MYEFO, the budget was projected to remain in structural deficit indefinitely – in other words, when we stripped out temporary economic factors that affect the budget bottom line (such as the terms of trade and where we are in the economic cycle), the prevailing expenditure and taxation policies would have resulted in persistent budget deficits.
With the focus on structural savings in last week’s Budget, the projections now are for the budget to return to structural balance by around 2017-18 and to be in structural surplus beyond that – an important turnaround that will place us in a better position to respond to future economic shocks.
The compositional switch in expenditure
The second feature of last week’s Budget that I want to highlight is the compositional shift in government expenditure from transfer payments that flow into consumption to support for infrastructure inves
tment.
Based on current forecasts, by the end of 2015-16, the economy will have grown slower than potential for seven of the past eight years.
As a result, it is estimated that the economy will be operating at that time with a gap between potential output and actual output of about 2 percentage points — the largest output gap since the mid-1990s.
Chart 4: Output and unemployment gap estimates
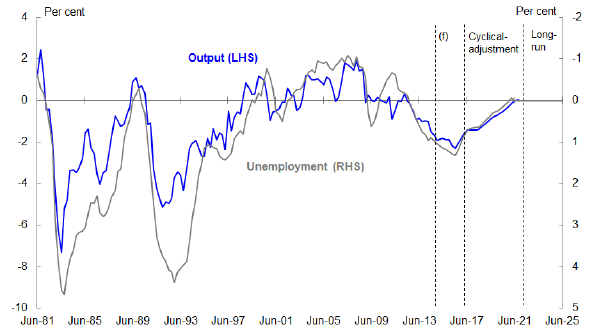
Source: Treasury.
The Government’s infrastructure initiatives are timely in this context as they will support growth at a time when there is expected to be excess capacity in the economy, particularly in the engineering construction sector as large resource sector projects reach completion.
This new investment will be financed in the context of an improving budget bottom line by reducing spending in areas that have lower fiscal multipliers. This infrastructure investment is good for economic growth in the short term and can help support higher productivity over time.
This places the Budget squarely in the post-GFC international consensus (not often followed in practice) of how fiscal consolidation should be conducted.
Headroom for tax cuts
The third element of the Budget story that I want to touch on is the decision to allow for future tax cuts.
Chart 5: Underlying cash balance projections
Note: The underlying cash balance excludes Future Fund earnings and payments.
Source: Treasury.
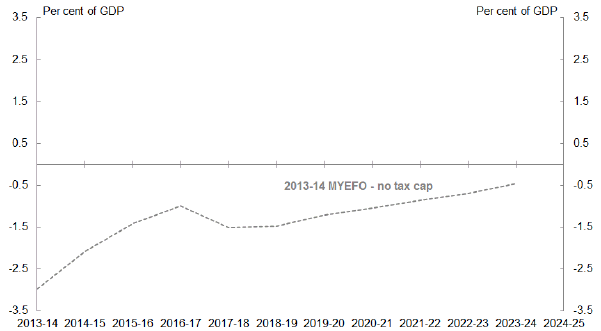
The 2013-14 MYEFO projections assumed no personal income tax cuts for well over a decade. As you can see in the chart, the result was a projected improvement in the budget bottom line from a deficit of 1½ per cent of GDP in 2018-19 to a deficit of ½ per cent of GDP in 2023-24.
What drove this projected improvement was fiscal drag. Fiscal drag involves the increase in personal tax revenue that results from taxpayers facing higher average tax rates as their nominal wages rise, even if their real wages remain constant.
As I have noted previously, fiscal drag will pull someone on average full time earnings into the 37 per cent tax bracket from 2015-16, and will increase the average tax rate faced by a taxpayer earning the projected average from 23 to 28 per cent by 2023-24 — an increase in their tax burden of around a fifth.
Chart 6: Average full-time employee earnings and personal income tax thresholds
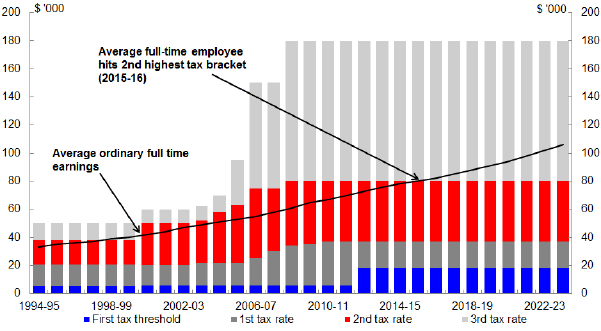
Notes: Based on 2014-15 Budget parameters.
Source: ABS cat. no. 6302.0 and Treasury.
Keeping fiscal drag for well over a decade is unlikely to be politically feasible. Moreover, in the context of an ageing population, it is not economically desirable given the likelihood of adverse participation impacts from rising tax rates.
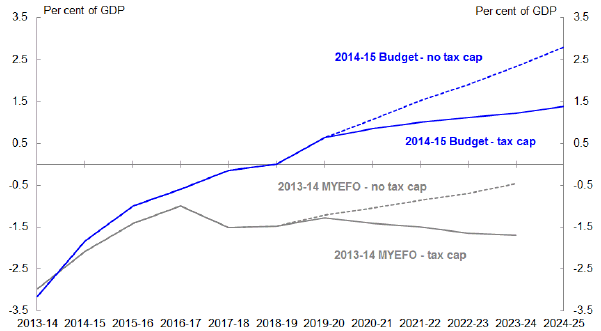
Recognising this, the Government’s medium-term fiscal projections presented in last week’s Budget place a cap on the tax-to-GDP ratio at the long-run average of 23.9 per cent. The impact can be seen in the chart, which shows the Budget and MYEFO projections with and without the tax cap.
Chart 7: Underlying cash balance projections
Note: The underlying cash balance excludes Future Fund earnings and payments. MYEFO tax cap projection was not published in MYEFO.
Source: Treasury.
With the tax cap, the MYEFO projections would have shown no improvement in the budget bottom line after 2018-19. By contrast, the Budget projections with the tax cap show an improvement in the budget bottom line of almost 1½ percentage points of GDP between 2018-19 and the end of the projections period.
As you can see in my next chart, this has significant implications for projections of net debt.
Chart 8: Net debt projections
Note: A tax-to-GDP cap of 23.9 per cent has been applied to these projections. 2013-14 MYEFO tax cap projection was not published at MYEFO.
Source: Treasury.
This again illustrates the point I made earlier about many of the policy decisions taken in the Budget being structural in nature and building over time.
Providing for future tax cuts is not only prudent budgeting and sound economics, it could also potentially have positive distributional implications when you consider that fiscal drag has the biggest impact on the average and marginal tax rates that apply to those on lower incomes.
Chart 9: Effects of fiscal drag on the average tax rate
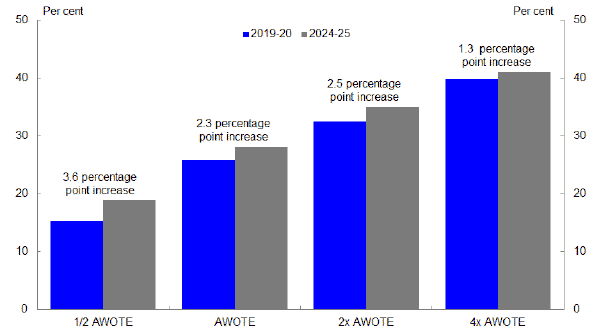
Note: AWOTE refers to average weekly ordinary time earnings.
Source: Treasury.
This chart uses the currently legislated tax scale to show what the average tax rate at four different pay points could be in 2019-20 and 2024-25, covering the period in the medium term projections over which we project the tax cap to be binding.
The rise in the average tax take simply reflects fiscal drag. While the progressivity of the income tax system is clear, you will notice that as incomes increase, the rise, in percentage points, in the average tax rate falls. Thus, fiscal drag makes the personal income tax system less progressive.
Through spending restraint, the Budget provides the fiscal space for the forthcoming Tax and Federation White Papers to consider options that reduce reliance on fiscal drag in the design of Australia’s tax system.
The need for improved productivity
While the 2014-15 Budget is a significant step towards addressing Australia’s fiscal challenges, placing government finances on a sustainable path, the Budget also includes measures that seek to raise productivity and workforce participation.
As I mentioned at the start of my remarks, one of the key themes of my public speeches since becoming Treasury Secretary is that sustaining reasonable growth in living standards in the context of our declining terms of trade and aging population will require a significant improvement in our productivity growth performance.
One way to think about the link between productivity and living standards is through real wages.
Real wages are the wages workers receive, adjusted for the prices that they pay for goods and services.
It is a measure of the real purchasing power of our wages and hence movements in the real wage are closely associated with changes in material living standards.
As you can see from the chart, Australian real wages over the past decade have grown faster than our productivity, after having grown at roughly the same rate over the previous decade.
Chart 10: Labour productivity and real wages in Australia
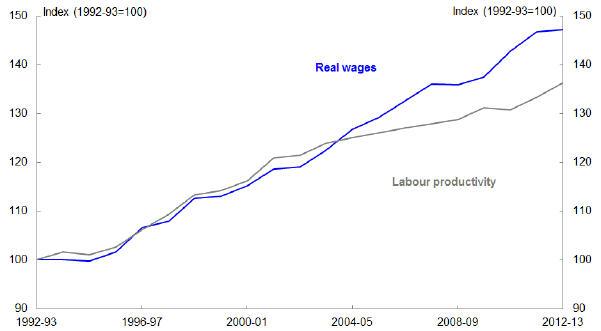
Note: Real wages are nominal hourly wages deflated by the consu
mption deflator. In contrast, nominal wages deflated by the GDP deflator, known as the real producer wage (not shown) have grown in line with labour productivity throughout the whole period.
Source: ABS cat. no. 5206.0 and Treasury.
Why is that? It largely reflects the rising terms of trade and associated appreciation of the exchange rate over much of this period.
There were other things going on of course, but these were the key forces.
Rising prices for Australia’s key commodity exports supported strong nominal wage growth in some parts of the economy, while the appreciation of the exchange rate increased the purchasing power of all households, in particular by pushing down the price of imports and constraining prices of domestic goods and services that compete with imports.
Both factors supported strong growth in real wages in aggregate.
What we’re seeing now though is a turnaround in these trends as the terms of trade decline.
This will depress, in aggregate, the prices Australian businesses receive for their production and lead to slower nominal wage growth (or even declines) in the resources and related sectors.
At the same time, if the historical relationship with the terms of trade holds, we might expect to see the exchange rate depreciate further. This would support the needed transition to non-resources sources but also weigh further on the real wage by pushing up prices of imports and import-competing domestic production, and hence decrease the purchasing power of households.
As the terms of trade decline continues, productivity growth will again determine the potential for real wage increases over the next decade, as it did in the 1990s.
Given this, it’s important to consider what might drive productivity growth in the future, including because it can provide insights into where policies intended to improve Australia’s productivity outlook might focus.
There are four contributors to measured labour productivity growth:
- increased physical capital;
- increased human capital;
- improved multifactor productivity; and
- shifting resources from low to high productivity industries.
I’ll briefly step through the outlook for each of these drivers in turn.
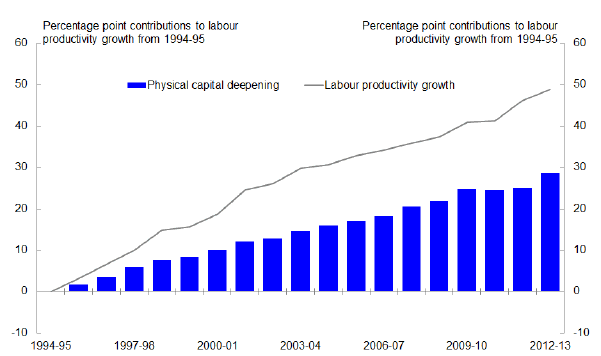
Physical capital
In my written remarks I discuss physical and human capital deepening in detail.
In Australia, labour productivity in the market sector has grown nearly 50 per cent since 1995. More than half of this growth is due to capital deepening occurring within individual industries.
Chart 11: Market sector labour productivity
Note: Data relate to the 16 industry market sector. Results are derived using a Tornqvist index to aggregate nominal value-added shares across industries.
Source: Unpublished ABS data and Treasury.
Capital deepening represents the contribution from a rising ratio of physical capital to labour – in the example of a production line, the more machines at a worker’s disposal, the more they are able to produce per hour.
The capital deepening component of productivity growth demonstrates the importance of infrastructure and business investment for improvements in incomes and living standards.
Relative to its pre-boom level, the capital stock in the resources sector is expected to have roughly quadrupled by 2015-16. Now, with resources investment expected to decline sharply in the years ahead, an improvement in non-resources investment is required for further capital deepening to boost productivity.
The Government’s Infrastructure Growth Package is significant in this regard, providing for an additional $11.6 billion of new infrastructure investment and raising total infrastructure investment by the Commonwealth, State and local governments and the private sector to more than $125 billion out to the end of the decade.
We estimate that when completed, the projects will result in GDP being around 1 percentage point higher over the longer term.
For businesses outside the resources sector, surveys of investment intentions are yet to indicate a significant pick up. Nonetheless, the Budget forecasts are for investment to pick up outside the resources sector from 2015-16 as firms start to respond to improving demand and existing levels of spare capacity are absorbed.
Such a pick up will be important, as any prolonged weakness in business investment would have an echo effect for productivity growth for several years.
Human capital
Increasing human capital – the knowledge, skills and competencies of our labour force – can also improve productivity.
The chart below may suggest that the contribution of human capital improvements within individual industries to aggregate labour productivity growth has been limited, but this is partly a reflection of the embryonic stage of our efforts to measure the quality of labour.
Chart 12: Market sector labour productivity

Note: Data relate to the 16 industry market sector. Results are derived using a Tornqvist index to aggregate nominal value-added shares across industries. Human capital deepening reflects changes in quality-adjusted labour inputs relative to hours worked.
Source: Unpublished ABS data and Treasury.
The contribution of human capital depicted in this chart arises from changes in the education, gender and age characteristics of the workforce. The human capital contribution is based on an assumption that a worker’s human capital is reflected in their wage.
Like all assumptions, this one risks simplifying reality too much. For example, one consequence of this assumption is that rising female participation in the workforce detracts from quality-adjusted labour inputs. This is because the lower wages of women, on average, are assumed to reflect a lower quality of work on average, highlighting a significant shortcoming of this approach.
A key contributor to the accumulation of human capital of course is education.
A simple measure of school and tertiary completions suggests that the average level of education among Australian workers is currently below that of US workers. The chart depicts data for males, but data for females show a similar pattern. The different education levels (along with geography) are often cited as a key explanator of Australia’s lower productivity level.
Chart 13: Proportion of males completing secondary and tertiary education
Secondary
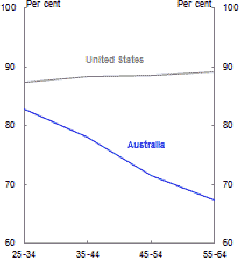
Tertiary
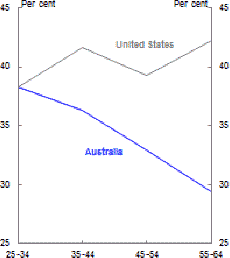
Note: Data are as of 2011.
Source: OECD.
The gap in education levels largely reflects differences among older generations, rather than differences among the current younger generations.
For instance, whereas completion of secondary education became common in Australia through the 1970s and 1980s, the majority of young Americans were high-school graduates as early as 1
940.
The duration of formal education now differs little between the two countries. Less educated older cohorts will continue to retire, and younger cohorts, with education levels in line with their US counterparts, will continue to fill the ranks. So the contribution of education to productivity growth and a ‘catch-up’ to the US will continue for a time.
To the extent there is a gap at younger age groups, the Government’s higher education reforms, which will expand demand driven funding to all students undertaking higher education bachelor and sub-bachelor courses, should help. In particular, demand driven funding for sub-bachelor courses (for example, higher education diplomas), will support less well prepared students to pursue alternative pathways to bachelor degrees.2
Comparisons of Australian and US school and university completions are of course limited as they do not account for the quality of the education.
The OECD’s program for assessing the performance of 15 year olds in mathematics, reading and science, known as PISA, - while not a definitive measure of school quality - reports higher mean scores for Australian than the US, a lower proportion of students rated as low achievers in Australia compared to the US, and that student performance depends less on the student’s socio-economic status in Australia than in the US.
However, these results may say more about the US than they do about Australia. Australia’s mean PISA scores have deteriorated over the past decade, with many countries, including a number in our region, achieving superior results.
Doing better than this – in other words, extracting as much human capital from our education systems as possible – means continuing to focus on the quality of Australian education, noting that there is no simple relationship between education spending and results.
Increases in education expenditure in Australia over recent decades, much of which has focussed on reducing class sizes, appears at first glance to have made little impact on student performance, at least for the average performance, suggesting that increased resources may not been used as effectively as possible.3
The quality of education in part depends on whether the education matches the demands of students and businesses. The full deregulation of the higher education sector announced by the Government will allow - and indeed encourage - Australian universities and other higher education providers to offer what students and businesses require, at a standard that suits the needs of the future workplace.
But it is not just training that is important. Experience in the workforce also matters.
Over the past thirty years we have enjoyed human capital deepening — not just through more education, but also through more experience. It is over this period that the baby boomers have reached the top of their careers to achieve their peak productivity and earning capacity.
But the retirement of the baby boomers will see the retirement from the workforce of some of our human capital. So, in addition to the impact on the size of the labour force as a share of the population, the retirement of baby boomers will have a detrimental effect on the quality of the labour force, which will detract from labour productivity growth.
This highlights the importance of removing impediments to workforce participation for baby boomers who wish to continue to participate, and of measures to bring older workers back into the workforce. Decisions to increase the retirement age from 65 to 67 and then to 70 will help sustain participation in the workforce. In addition, the Government’s Restart programme announced in the Budget, which will pay employers up to $10,000 if they hire a mature age job seeker who has been on income support for at least six months, will provide a strong incentive to employers to take on mature-age jobseekers.
Multifactor productivity
Thus far I’ve spoken about the relationship between the quality and quantity of capital and labour.
What also matters for our future productivity growth prospects is how efficiently we are able to combine these inputs in the production process, which is driven by innovation in products and the processes for making them.
Chart 14: Market sector labour productivity
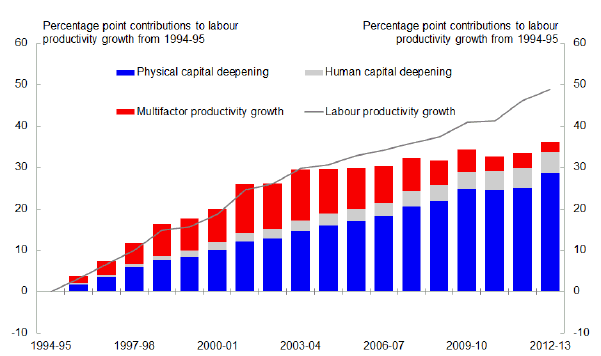
Note: Data relate to the 16 industry market sector. Results are derived using a Tornqvist index to aggregate nominal value-added shares across industries. Human capital deepening reflects changes in quality-adjusted labour inputs relative to hours worked.
Source: Unpublished ABS data and Treasury.
As the chart indicates, multifactor productivity growth within individual industries made a significant contribution to labour productivity growth from 1995 through to the early 2000s.
However, multifactor productivity growth within individual industries has been extraordinarily poor since then, with its contribution to labour productivity growth being negative over the past decade (the red bars have shrunk).
As I mentioned earlier, Australia’s weak productivity growth performance can partly be attributed to very high investment in the resources and utilities sectors.
This investment of capital and labour has long lead times before increased output comes on line, resulting in a temporary reduction in productivity.
High prices for commodities also made the extraction of deeper ores and lower yielding resources financially attractive, even at high unit costs.
Together, these factors have driven a cumulative 19 per cent decrease in labour productivity in the resources sector over the past five years.
Looking ahead, labour productivity in the resources sector is projected to return soon to positive rates of growth as more projects come on line and move towards full production.
The resources sector generates around 16 per cent of Australia’s production and therefore this productivity turnaround will have a sizable impact on national productivity growth.4
Importantly though, this will not lead to a commensurate increase in national average incomes as a large part of the resource investment boom (around four-fifths) has been funded from foreign sources.5
Moreover, even if we exclude the mining and utilities sectors, multifactor productivity growth has fallen over the past decade, with 9 of 12 Australian industries for which we have complete data recording lower multifactor productivity growth over the past decade than the previous one. This suggests something more fundamental is at play.
Some argue that Australia’s poor multifactor productivity growth is part of a long term trend and that the rate of innovation is slowing globally, with long term impacts on global productivity growth.
Prominent economists such as Professor Robert Gordon of Northwestern University and Professor Tyler Cowen of George Mason University argue that this global slowdown in productivity may be structural in nature, with profound implications for future growth.
At their root these arguments are inherently sceptical about the productivity benefits associated with what Gordon calls the ‘third wave’ of the industrial revolution – the revolution in communications and information technology.
This argument is supported by the relatively weak productivity performance of the US and other leading advanced economies over recent decades even as these new technologies have moved ahead in leaps and bo
unds.
Of course, it is possible to take a more optimistic view. Professor Brad de Long of University of California, Berkeley, emphasises the cyclical, and hence temporary, factors behind recent productivity performance.
This includes the observation that productivity growth typically declines during economic downturns as firms hold onto labour and capital even as productivity falls, in anticipation of an improvement in economic conditions in future.
Moreover, just as contemporary observers have sometimes underestimated the impact of technological innovations in the past, it may be that that we have barely scratched the surface of the productive potential of emerging technologies. Looking at the remarkable advances across the whole frontier of science – advances that are mutually reinforcing – one could perhaps harbour some optimism.6
Clearly, it is important to foster a competitive environment in which the incentive and flexibility to innovate is maximised.
To that end, the Government’s independent competition policy review provides an opportunity to leverage further gains from competition - work done by the IMF, OECD and World Bank in the G20 context has highlighted this as an area where potentially significant gains could be made internationally.7 In his public comments, Professor Harper has signalled that he will use the wide remit of the Review to push competition into new areas, while also exploring ways to reinvigorate competition in sectors covered by the Hilmer Review.8
The Financial System Inquiry is also looking at how to ensure the financial system is positioned well to respond to the structural challenges facing Australia, which is critical to the efficient allocation of capital — a key underpinning of future growth prospects — as well as the efficient and safe management of the nation’s savings.
The challenge of improving multifactor productivity growth is important across all areas of the economy, but is particularly evident in Australia’s small business sector. Small businesses employ around 43 per cent of the private sector workforce, but are responsible for only 34 per cent of private-sector output.9 Going forward, it will be important to put in place the broad frameworks to facilitate small business productivity, and to remove any impediments to small business innovation and growth.
Structural change
Even if each industry experienced weak productivity growth, it is possible for the overall economy to experience strong productivity growth if industries with high levels of productivity expand to make up a greater share of the economy at the expense of industries with low levels of productivity.
Over the past decade we have seen such a shift from low to high productivity industries such as mining.
Chart 15: Market sector labour productivity
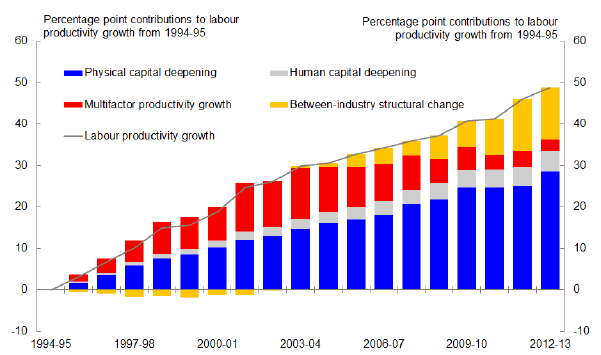
Note: Data relate to the 16 industry market sector. Results are derived using a Tornqvist index to aggregate nominal value-added shares across industries. Human capital deepening reflects changes in quality-adjusted labour inputs relative to hours worked.
Source: Unpublished ABS data and Treasury.
The reverse is also possible. A negative contribution to productivity growth can arise if industries with low levels of productivity expand to make up a greater share of the economy at the expense of industries with high productivity. Such a shift from high to low productivity industries occurred in the late 1990s and early 2000s, as can be seen from the negative contributions in the chart at that time.
Over the coming decades we may see such a negative contribution again. Modelling by Treasury and the Productivity Commission suggests a shift in the industry shares of the economy towards services sectors like health and aged care over the coming decades, driven in part by the aging of the population.
These sectors have historically generated lower measured productivity growth than the economy-wide average. Based on these historical measured productivity growth rates, we project that shifting industry composition towards services will detract around 0.3 of a percentage point from Australia’s annual labour productivity growth over the next decade.
You’ll notice that I emphasised the word measured when talking about the productivity growth rates of the services sector. This is because there are grounds for believing that we may not be capturing productivity in the services sector very well. That’s not a criticism of the ABS, rather it’s a reflection of the practical difficulties in measuring productivity in the services sector.
Part of this reflects the difficulty of capturing improvements in quality in the measure of services, be they services provided by the public or private sector. In principle, an improvement in quality should (all else being equal) be measured as an improvement in productivity. However, capturing the quality of services in areas such as health and aging is challenging – both conceptually and in practice10.
Another challenge measuring the productivity of the services sector involves the absence of prices for many services provided by the public sector. Without a price, the most common way to measure the output of a service can be to measure the inputs, such as hours worked by, and wages paid to, police officers, doctors and teachers.
This can have the quirk of causing low measures of productivity growth for the public sector, as any increase in the measure of the outputs is matched by an increase in the measure of the inputs.
Irrespective of the measured productivity consequences, the importance of improving efficiency in service sectors remains paramount, particularly in sectors with a strong public sector presence such as health.
As State and Territory Governments are the main operators in these sectors, measures that give the States greater incentives to improve efficiency will be particularly important. In this regard, the Budget flags that potentially significant changes in the distribution of responsibilities for schools and hospitals could arise from the forthcoming Federation and Tax White Papers.
Notwithstanding our inability to capture efficiency improvements in our standard productivity measures, a more efficient services sector producing higher quality outputs will become increasingly important for our standard of living as it becomes a larger part of our economy.
The distribution of gains from productivity growth
In discussing the productivity outlook, I have touched on some ways to improve our productivity prospects.
But it is also important to consider who benefits from the improved productivity performance of the economy.
You’ll recall that one of my earlier charts showed that real wages in Australia have more than kept pace with productivity growth over the past two decades. There has also been little change in the share of income paid to workers over this period.
But this is not an iron clad rule of economics.
Chart 16: Labour productivity and real wages in Australia and the G20 advanced economies
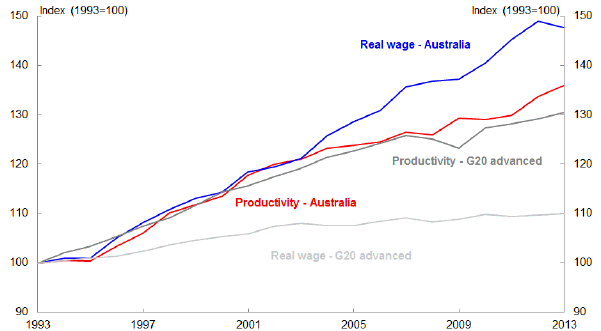
Note: The methodology used t
o calculate G20 advanced aggregates is described in Appendix I of ILO’s Global Wage Report 2012-13.
Source: ABS cat. no. 5206.0 and unpublished International Labour Organisation estimates.
As you can see in this chart, in the G20 advanced economies as a whole, growth in real wages was less than a third of labour productivity growth from 1992 to 2011 (the latest data point available).
A stark example is the US, where labour’s share of income fell by around 4 percentage points over this period. At the same time as the labour share of income has fallen, the US has also experienced a significant increase in income inequality, with income gains disproportionately captured by a small proportion of those at the top of the income distribution.11
In fact, if we look over a longer time period, not only has there been an increase in income inequality in the US, but real wages have fallen for the lowest decile and for more than half of the male workforce in the US since 1979.
Chart 17: US hourly real wages growth by decile – 1979-2011
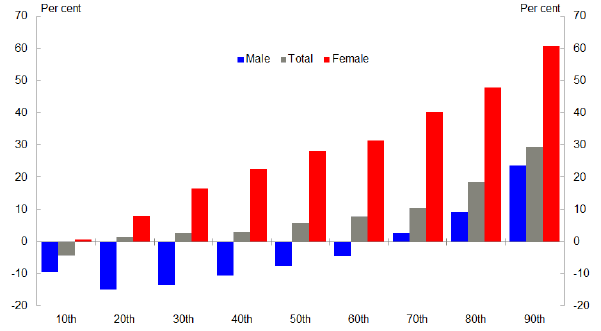
Source: Economic Policy Institute, The State of Working America, 12th Edition.
After we factor in taxes and transfers, income inequality has increased only slightly in Australia over the past two decades against the backdrop of very strong growth in incomes across the entire income distribution.12 This means that the income gains we’ve enjoyed over the past two decades have been shared much more broadly.
Chart 18: Australian real disposable household income growth from 1994-95 to 2011-12
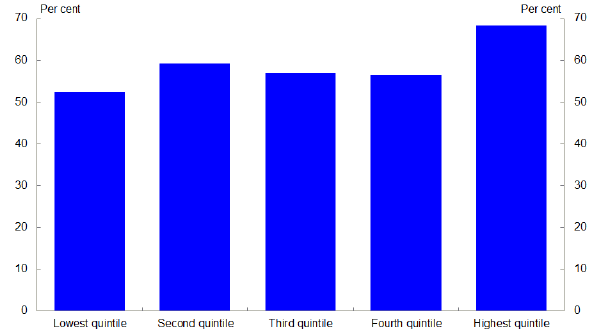
Source: ABS cat. no. 6523.0
This reflects, among other things, the access provided right across the community to good quality education, training and healthcare. These are the essential pre-requisites to securing well paid employment. A key motivation for the Government in shaping the Budget has been reinforcing sustainability and access to high quality health and education well into the future.
Sustaining the reforms needed to boost productivity is always a public-policy challenge. But it is a challenge with a much greater prospect of success when the economic benefits of the productivity boost are broadly shared across the community.
Conclusion
Australia’s twin challenges of restoring fiscal sustainability and driving strong growth in living standards are not unique to us.
Indeed, much of our domestic policy agenda has echoes in the G20 policy agenda.
Internationally, there is now agreement on the need to run sound medium-term macroeconomic policies which are sensitive to near term conditions. But unlike many other countries, Australia has the freedom to actually do this.
Similarly, the G20 jobs and growth agenda has a clear focus on the need for structural reform across a wide range of areas — especially infrastructure, competition and labour markets. Embarking on a comprehensive set of reforms is also seen as a positive-sum game — internationally, benefits are maximised by spillovers between countries; domestically, the effectiveness of reforms in one area is reinforced and leveraged by reforms elsewhere.
Reform — international and domestic — also helps reduce the likelihood and impact of adverse shocks — and the world offers many opportunities for shocks that could derail Australian economic prosperity.
This in turn reinforces the case for improving our fiscal sustainability in order to buy us the insurance we need to be able to respond to any adverse external shocks.
It is, therefore, squarely in Australia’s national interest to pursue macroeconomic, structural and fiscal strategies which deliver these outcomes.
Moreover, it is squarely in Australia’s national interest to use our G20 Presidency to highlight the importance of such reforms globally, and to set an example through implementation. If the G20 is to deliver a 2 per cent boost to world GDP over the next five years, Australia needs to play its part.
We need to recognise that Budget measures that aim to increase Australia’s economic potential through productivity growth and workforce participation are only the first step, though, if we are to sustain reasonable growth in living standards.
It is also important that we realise the full potential of the opportunities that will be presented by current and forthcoming inquiries and White Paper processes in areas such as competition, the financial system, workplace relations, tax and the Federation.
Finally, it is also useful to recall that the economic reforms during the 1980s and 1990s faced stiff opposition at the time, but ultimately transformed Australia into a globally competitive economy and set us up for more than two decades of continuous economic growth, the benefits of which have been broadly shared.
As we look to the challenges before us, we again find ourselves at a critical juncture where it is only through ambitious reforms pursued in the national interest that Australians will continue to enjoy amongst the highest living standards in the world.
Thank you.
1 I thank Simon Duggan and Duncan Spender for their assistance in preparing these remarks. David Gruen, Jan Harris, Rob Heferen, Emily Hurley, Nigel Ray and Barry Sterland have all provided helpful comments. All errors remain my own work! Note that the delivered remarks are an edited version of this presentation due to timing constraints.
2 In addition, Trade Support Loans of up to $20,000 over a four year apprenticeship are being introduced with a view to improve apprenticeship completion rates. The programme provides a completion incentive of a 20 per cent discount on the loan. Currently apprenticeship completion rates are below 50 per cent.
3 Leigh, A and Ryan, C (2011) ‘Long-run trends in school productivity: Evidence from Australia’ Education Finance and Policy, 6 (1), Winter, pp 105-35.
4 Were labour productivity in the resources sector simply to stop falling, it would raise aggregate labour productivity growth by 0.6 per cent per annum relative to the past five years. Given the sharp increases in output in prospect in the next few years, detailed in Budget Statement 2 of the 2014-15 Budget, the sector’s contribution to aggregate productivity could be significantly larger than this. The resources sector consists of mining (including those components of the metals manufacturing industry that are included in the ABS definition of non-rural commodity exports) and mining-related industries (including those parts of the domestic manufacturing, construction and services industries that directly contribute to mining production and investment). Methodology for constructing resources sector data as in Gruen, D (2011) The Macroeconomic and Structural Implications of a Once-in-a-Lifetime Boom in the Terms of Trade. Address to Australian Business Economists Annual Conference.
5 The estimate of foreign investment funding in the sector is from Arsov, I, B Shanahan and T Williams (2013) Funding the Australian Resources Investment Boom, Reserve Bank
Bulletin, March.
6 Even if technology pessimists are correct, global average incomes could still rise sharply as more countries move closer to the technology frontier, although income growth in those at the frontier would grow more slowly than at present.
7 IMF (2014) Macroeconomic and reform priorities. Paper prepared by IMF Staff with inputs from the OECD and the World Bank, for the February 2014 Meetings of G-20 Finance Ministers and Central Bank Governors.
8 Hilmer, F (chair) (1993) National Competition Policy Review, 25 August.
9 When small business management practices are compared with those in other countries, Australia ranks well below the best performers such as the United States, Germany and Sweden — see Green, R (2009) Management matters in Australia: just how productive are we?, Report commissioned by the Department of Innovation, Industry, Science and Research.
10 For a discussion of this, see Atkinson, A (2005) The Atkinson Review: Final Report. Measurement of Government Output and Productivity for the National Accounts.
11 OECD Income Distribution and Poverty database (2013).
12 Fletcher, M and B Guttman (2013) Income Inequality in Australia, Treasury Economic Roundup 2.