Downloads
Thank you Sarah for that kind introduction.
It is a pleasure to present at my third Tax Institute event in the past two years, and the first in Brisbanei.
In talking on the topic of “tax reform and policy for an economy in transition”, I want to talk about two main things:
First, what is happening in the economy, and what that means for the tax system, particularly tax revenue.
Second, what the tax agenda is going forward, and how Treasury fits into that.
I want to start with some take-out messages:
- The Australian economy is recording good growth relative to other advanced economies and is transitioning away from the boom in mining investment towards broader growth. However, growth in living standards is not projected to return to mining boom levels. This has implications for the revenue our tax system will generate. It means that, for a given share of tax to the overall economy, the annual growth in revenue is not expected to be as strong as in the past.
- Changes in the composition of the economy, and technological developments, will continue to affect the composition of tax revenues. Predicting the magnitude and speed, and in some cases even the direction, of these developments is very difficult. Nevertheless, it is important that these developments continue to be watched very carefully for their revenue implications over time.
- The Government has a large and important tax agenda. The reforms will boost our international competitiveness, while improving the integrity and sustainability of the tax system. Treasury is working on the policy and legislative products needed to implement those policies.
- Treasury is also focussing on simplification proposals, working particularly with the Board of Taxation.
- To ensure that a whole-of-tax approach is brought to bear on key issues, Treasury is establishing a new Tax Framework Division. We are also continuing to build our internal capacity and our engagement with stakeholders.
Let me now provide you with some detail on each of these points, starting with how Treasury sees the global economic context. The importance of global events for Australia (and Queensland) cannot be underestimated. As a small open economy dependent on foreign capital and with a commodities-focused export base, the performance of our economy and our standard of living is heavily influenced by global events.
The economic backdrop
The global outlook
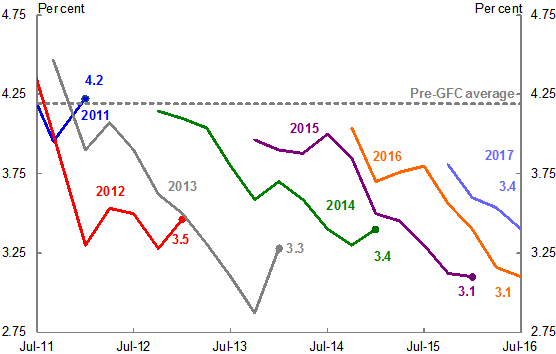
We face a challenging global economic outlook. The recovery following the global financial crisis has been much slower than expected and indeed the legacies of the crisis continue to weigh on the growth outlook. World growth averaged 4.2 per cent in the decade prior to the GFC, but since 2012 growth has been at or below 3½ per cent, and for 2015 it was just 3.1 per cent.
While there are reasons to expect a slower-than-normal recovery from the GFC, the weakness has nonetheless been more pronounced than anticipated. Forecasts for global growth have been regularly revised downwards in recent years which you can see from Chart 1.
Chart 1: Evolution of IMF forecasts of global growth
Source: IMF World Economic Outlook
The question is how much of this continued weakness is cyclical, and how much is ongoing.
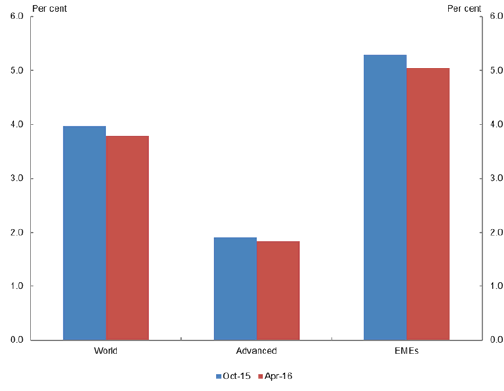
Chart 2 shows the IMF’s estimates of medium-term potential growth 5 years out. Forecasts have been revised down since last October. Relative to a pre-GFC average of just under 4¼ per cent, medium term potential growth is estimated at 3.8 per cent.
Chart 2: Medium-term potential growth
Source: IMF April 2016 World Economic Outlook
These revisions reflect unresolved crisis legacies, low productivity growth and unfavourable demographics (particularly in advanced economies). I want to spend a bit of time on the productivity and demographic aspects.
Productivity
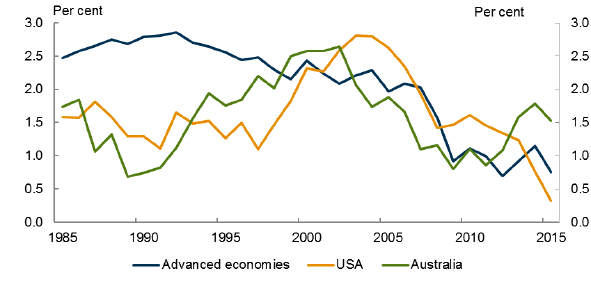
In terms of productivity, advanced economies have experienced a long-run trend decline in productivity growth (Chart 3). Australia and the US had a brief period of strong productivity growth in the late 1990s and early 2000s (due to a combination of microeconomic reform and gains from information and communications technology but growth has since slowed).
Chart 3: Productivity growth rates – Australia, USA and advanced economies
Source: Treasury
Note: Productivity growth rates are presented as a rolling five-year average to minimise annual volatility and highlight more persistent trends.
As you can see from this chart, we are not alone. Indeed the OECD estimates that almost all of its member countries have experienced a slowing of productivity growth since 2000, coupled with an increased divergence between the productivity growth rates of leading businesses and other businesses.
What explains this poor productivity performance among advanced economies? How do we reconcile it with dramatic changes in technology, including the sweeping changes we all experience from the digital economy? This is one of the big issues facing economists and so far there is no consensus on why it has happened. This matters a lot to Australia – in the long run, our potential productivity growth is constrained by the global ‘productivity frontier’.
Demographics
Demographic pressures, including slower population growth and ageing populations are already having a profound effect on the global economy and this will continue.
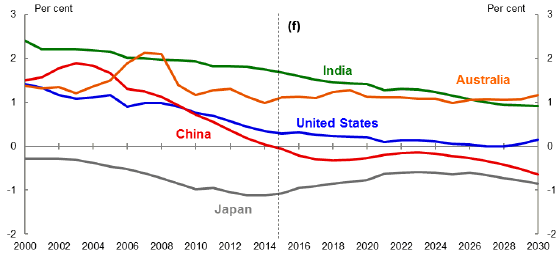
Ageing populations in many advanced economies are likely to lead to a decrease in participation rates in coming decades and as a result, there will be a smaller share of the population active in the workforce. This trend is already evident in the two largest advanced economies of the world – the US and Japan. The traditional working age populations (people aged 15 to 64) of our top two export destinations, China and Japan, are shrinking (Chart 4).
A key question is: to what extent the effects of an ageing population are offset by higher participation rates. In Japan, for example, the labour force participation rate has fallen from 64 per cent in 1992, when the working age population peaked as a proportion of the total population, to 59.6 per cent in 2015. This is despite an increase in the participation rate of the working age population, primarily driven by an increase in female labour force participation in this age group from 58.3 per cent to 66.7 over the same period.
Chart 4: Growth in working age populations
Source: 2015 UN Population Prospects, ABS, Treasury
Inflation outlook and monetary policy
Two final issues I would like to briefly touch on are the inflation outlook and monetary policy.
Global inflation has been weak since the financial crisis. In part, this probably reflects some cyclical economic weakness as the global economy continues its slow post-crisis recovery. But it is also likely to reflect, at least in part, the longer-run drags on global growth I noted earlier.
In this environment, inflation-targeting central banks in advanced economies have been forced to lower interest rates to ever lower nominal levels in order to underpin eco
nomic growth and inflation.
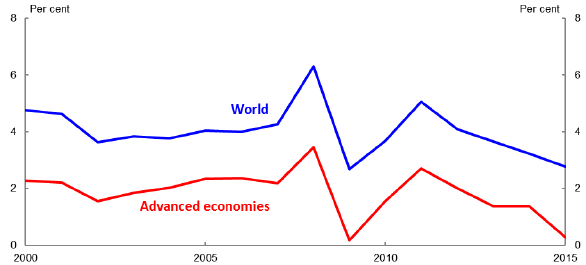
But, as you can see from Chart 5, global inflationary pressures remain low and below central bank targets in most advanced economies.
Chart 5: Global Inflation
Source: IMF April 2016 World Economic Outlook
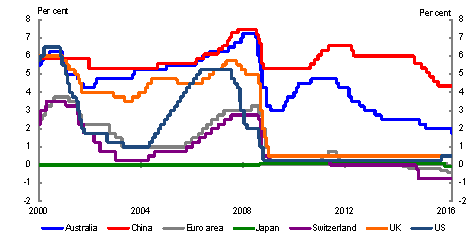
As a direct result, many advanced economies have run out of conventional monetary policy space with policy interest rates falling to historic lows and in some cases even being set at negative levels (Chart 6). A number of major central banks – particularly those in Europe and Japan – have resorted to unconventional measures, including purchasing an increasingly broad range of assets. Yet there is little sign to date that this is generating a recovery in inflation pressures.
Chart 6: Central bank policy interest rates
Source: Bloomberg Asia
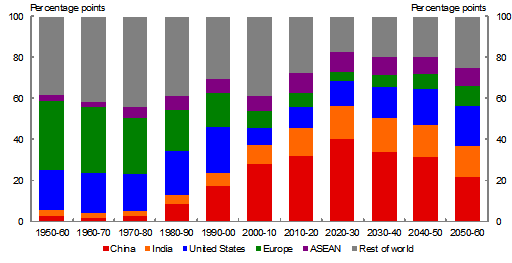
Sitting within the Asian region, we here are well aware of the importance of Asia to the performance of the global economy, and in particular, our economy. The IMF expects the Asian region to contribute more than 60 per cent of global growth through to 2021 (Chart 7).
The strong performance of the Asian economies means that growth in our major trading partners is expected to continue to outstrip global growth through the forecast period. Given around 60 per cent of the world’s population lives in Asia and it is expected to be home to 5 billion people in 2035, there are substantial benefits to Australia from even closer integration into these rapidly expanding markets. In particular, there are opportunities to export goods and services that will be in higher demand as incomes rise – education, tourism and food products to mention just a few.
Chart 7: Shares of global growth
Source: IMF; Treasury
Note: Treasury projections used beyond 2021
Australia’s economic transition
Against this backdrop, the Australian economy is in the midst of a transition from mining investment to broader based drivers of growth.
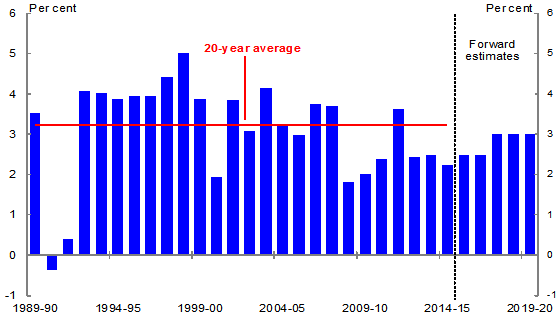
In 2011-12 mining investment contributed 2.8 percentage points to GDP growth. At Budget, mining investment was expected to detract around 1½ percentage points from growth in 2015-16. Rather, household consumption, dwelling investment and exports have been supporting activity and this is expected to continue in the near term. The Budget forecast real GDP to grow 2 ½ per cent in both 2015-16 and 2016-17 before strengthening to 3 per cent in 2017-18. This is a little lower than the 20 year average of 3.2 per cent (Chart 8).
Chart 8: Real GDP growth
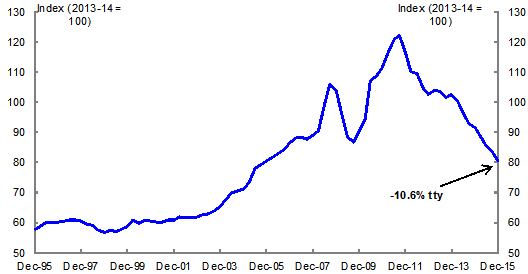
Real GDP measures the volume of goods and services we produce. However, our national income depends not only on the volume of what we produce, but also our terms of trade. During the 2000s, commodity export prices rose much faster than import prices, leading to an unprecedented surge in the terms of trade, and strong growth in incomes (Chart 9). After the financial crisis, strong Chinese demand for our mining exports pushed up commodity prices and helped insulate Australia from the weak growth experienced in many parts of the world. Following a peak in the terms of trade in September 2011, steep falls in commodity prices have weighed on national income since that time.
Chart 9: Terms of trade
Source: ABS Cat. No. 5206.0
Over recent years, large increases in supply, including from Australia, combined with moderating global demand, primarily from China, has seen commodity prices fall significantly from their peaks. This has caused the terms of trade to decline and the Australian dollar to depreciate.
The lower nominal exchange rate has facilitated the transitions taking place by providing significant support for firms producing tradeable goods and services. Indeed services exports have expanded noticeably over the past few years, especially in tourism, education and business services.
This is combining with low wage growth to put downward pressure on the real exchange rate and help improve Australia’s competitiveness internationally. These forces should continue to assist the adjustments taking place in the economy and encourage firms to employ more workers. This has been aided by strong growth in the economy’s labour-intensive services industries, as well as workforce flexibility - which has allowed firms to adjust labour input through changes in hours rather than employment levels.
As with any adjustment, the economic transition may not be smooth and is subject to uncertainty. Non-mining business investment is taking longer than anticipated to pick up, despite accommodative conditions being in place.
The most recent measure of business’ expected capital expenditure shows that non-mining businesses have not yet committed to significant new investment plans in 2016-17.
The pipeline of dwelling investment means it should continue to grow strongly over the next year but beyond that time it is not expected to contribute significantly to growth.
The expected continued growth in consumption spending is also dependent upon the savings rate continuing to fall. While the savings rate has been trending down since its peak in 2011-12, it is unclear where it will settle.
Demographics
In the medium term, Australia’s economic growth will be determined by the size of the labour force – both population growth and rates of labour force participation – and labour productivity.
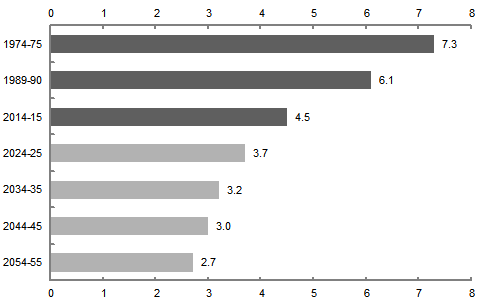
In terms of Australia’s demographics, our story is similar to that in many parts of the world. Our population is ageing, reflecting continued gains in life expectancy and declines in fertility rates. This means that in the future, there will be a significantly smaller share of people of traditional working age, that is, between 15 and 64 years of age (Chart 10)ii. The Intergenerational Report (IGR) released in March 2015 noted that in 1974-75 there were 7.3 people in this age group for every person aged 65 and over. This decreased to 4.5 people by 2014-15 and is projected to decrease even further to 2.7 people by 2054-55.
Chart 10: Number of people aged from 15 to 64 relative to the number of people aged 65 and over
Source: 2015 Intergenerational Report.
This will place downward pressure on workforce participation which will detract from economic growth and growth in living standards.
By 2054-55, the participation rate for Australians aged 15 years and over is projected to fall to 62.4 per cent in 2054-55, compared with 64.6 per cent in 2014-15.
Despite this broad trend, there have been some positive trends in participation amongst older Australians and wo
men.
Between 1978-79 and 2013-14 the participation rate of people aged 55 to 64 increased from 45.6 per cent to 63.8 per cent. Older people have been able to extend their labour force participation as a result of the improvements that have led to longer life expectancy, the rise of less physically demanding work and new technologies.
In addition, there has been strong growth in female participation over the past 40 years. In 1975, only 46 per cent of women aged 15 to 64 had a job. Today around 66 per cent of women aged 15 to 64 are employed. By 2054-55, female employment is projected to increase to around 70 per cent. The increase in female participation rates has been the result of increased levels of education, changing social attitudes towards gender roles, declining fertility rates, better access to childcare services and more flexible working arrangements.
While this is positive, at 70 per cent there are quite clearly further gains that can be made on this front.
For this reason, there has been, and will likely continue to be, a focus on the drivers of participation among groups with lower participation rates, including women and older Australians, and the role for policy.
Productivity
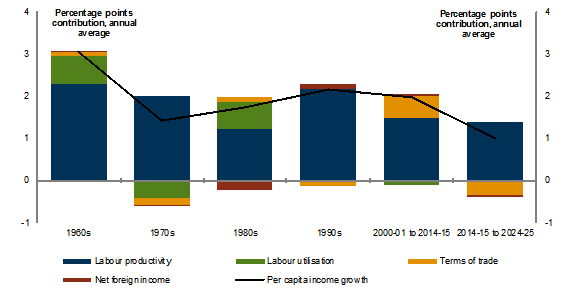
While lifting participation will deliver a growth dividend, it is widely acknowledged that improvements in productivity will be the key driver of Australia’s medium term growth prospects and indeed living standards.
Chart 11 shows the sources of our national income growth over the past five decades. Productivity growth has played the leading role in increasing our prosperity. However, as the chart makes clear, challenges are ahead.
Chart 11: Contribution to per capita income growth
Source: Treasury
In a period of falling terms of trade and labour force participation, future growth in living standards will again rely more heavily on labour productivity growth.
Economic developments and the tax system
Let me turn now to what these economic developments mean for the tax system.
Understanding these developments is a very important task for Treasury. Clearly, it is critical for the Government and the community that we have a tax system that raises revenue in a robust way to enable effective government budgeting. So we collectively have a keen interest in how changes in the economy and the way business operate will affect our revenue base over time.
While this is very important, it is also very challenging. The economy is always evolving in ways that are hard to predict. Even looking at past data, it can be hard to divine what will be a long term trend and what may be a cyclical phenomenon that will have only a transitory effect. Even where there are some relatively easy-to-predict structural changes, accurately quantifying the magnitude of the effect and the time horizon over which it will occur can be fraught.
So, with those caveats in mind, let’s look at what has happened to tax trends and what may happen going forward.
Let’s first look at the aggregate story for Commonwealth revenue – the tax:GDP ratio.
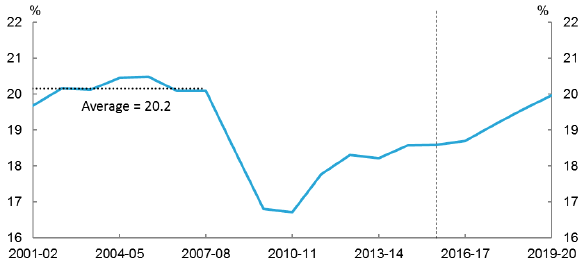
Chart 12 shows the evolution of the Commonwealth’s tax:GDP ratio since 2001-02 (excluding the GST). Following a sustained period where the ratio was around 20 per cent, it fell to below 17 per cent. This fall was more severe than at any time since the 1950s. The ratio has slowly increased to be almost 19 per cent, and is projected to reach around 20 per cent by 2019-20.
Chart 12: Total Taxation Receipts as a proportion of GDP (excluding GST)
Source: Treasury
It is important to note that the tax:GDP ratio is not only a function of tax policy but also changes in the structure of the economy, changes in asset prices, changes in consumption patterns and so on.
In terms of cyclical influences on the Commonwealth’s tax receipts, high equity and commodity prices during the mid-2000s saw the tax-to-GDP ratio rise to a record high of 24.3 per cent (or 20.5 per cent excluding GST as shown in Chart 10), before falling during the global financial crisis as corporate profitability fell and asset prices fell dramatically. The economic recovery has helped lift the tax:GDP ratio subsequently.
Changes in the pattern of consumption and activity have also contributed to the underlying trend decline in the tax:GDP ratio. The relative declines in consumption of tobacco and beer, and the trend towards more fuel efficient vehicles have all had an effect.
Structural changes to the tax base as a result of Government policy also contributed to changes in the tax-to-GDP ratio. This includes personal income tax cuts and bracket creep, the non-indexation (and now re-indexation) of fuel excise, tariff reductions and a host of specific incentives and base broadening measures.
By definition, the rise in the tax:GDP ratio in recent years means that tax receipts have grown faster than nominal GDP. However the growth in tax receipts has nonetheless been lower than during the mining boom when tax receipts were not growing faster than GDP. From 2000-01 to 2007-08, tax receipts recorded annual average growth of 7.3 per cent. From 2009-10 to 2014-15, growth averaged only 6.2 per cent.
Put another way, because GDP growth is lower, for a given tax:GDP ratio, annual revenue growth is lower. In fact, the only way to maintain revenue growth of the level experienced with the mining boom would be to have tax receipts continue to outstrip nominal GDP indefinitely.
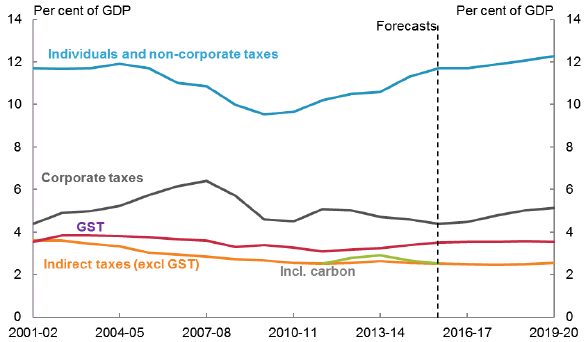
Looking at the aggregate picture is important, but our tax system depends on the effectiveness of each of the specific revenue heads. I don’t have time to talk about all of them today, but I wanted to focus on company tax, CGT, indirect taxes and individuals income tax. While our tax:GDP ratio is projected at the end of this decade to be roughly the same as it was during the pre-GFC 2000s period, the composition will be different. Corporate tax and indirect tax will be lower, while individuals income tax is expected to be a little higher. You can see these trends in Chart 13.
Chart 13: Australia’s evolving tax mix
Source: Treasury
Note: Corporate taxes includes company tax, superannuation fund taxes, Minerals Resource Rent Tax and Petroleum Resource Rent Tax.
While cyclical and structural factors have impacted on all heads of revenue, the impact of Australia’s transitioning economy on the company tax base is perhaps most stark.
Company tax
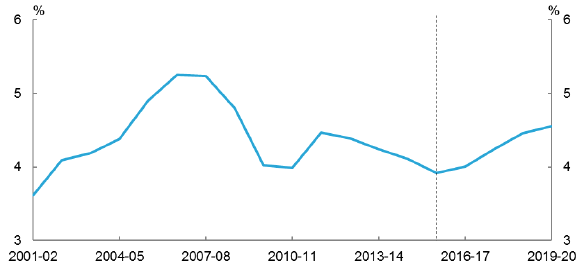
Company tax peaked during mining boom mark one, rising from an average of 3.1 per cent of GDP over the 1990s to 5.3 per cent in 2006-07. This high point largely reflected gains to the mining industry from high commodity prices. As the 2008 crisis hit, corporate profitability fell rapidly, with corresponding falls in corporate tax liabilities as a share of GDP. Company tax fell from 5.2 per cent of GDP in 2007-08 to 4 per cent of GDP in 2009-10, a fall of around 20 per cent. Following the GFC, company tax recovered strongly in 2011-12 to be around 4.5 per cent of GDP. It has since tailed off to 4.1 per cent of GDP in 2014-15 and is expected to grow to 4.6 per cent at the end of the forward estimates.
You can see these trends in Chart 14.
Chart 14: Company tax a
s a proportion of GDP
Source: Treasury
Moving away from the influence on the mining boom and the GFC, a big question to ask is: how will the digital economy, base erosion and profit shifting affect the company tax base in the future. It is a reasonable question, but very difficult to answer with any precision!
Clearly, some of the characteristics that give rise to profit shifting have been around for some time, but it is reasonable to think that the digital economy and the rise of intangibles have further to go. On the other hand, we have tough rules against profit shifting, which are being made tougher and the ATO is increasing its resources in this area. In our company tax projections, we assume tax receipts broadly grow in line with projected corporate profitability (having regard for policy measures, timing of payments, utilisation of losses etc). We do not lower forecast company tax receipts on the basis that the base will be further eroded from BEPS. However, it is clearly a risk, more so over the medium term.
Turning to the impact of changing economic circumstances on other heads of revenue, it is worth briefly looking at capital gains, indirect and personal income taxes.
CGT
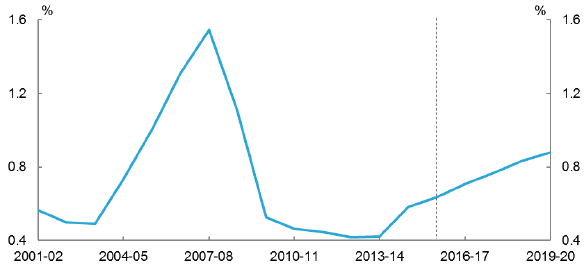
CGT is a component of individuals, company and superannuation funds taxes. It raises a relatively small amount of revenue, but it is highly volatile, driven by unpredictable factors including changes in asset prices, utilisation of past losses, and asset holding periods. In 2007-08, CGT peaked at 1.5 per cent of GDP (Chart 15). This was driven by strong asset price growth in the period before the crisis.
Chart 15: Capital gains tax as a proportion of GDP
Source: Treasury
The increase in the CGT-to-GDP ratio and subsequent drop off corresponds with the changes in corporate tax receipts and will have been a contributing factor to changes in the corporate tax take.
Indirect taxes
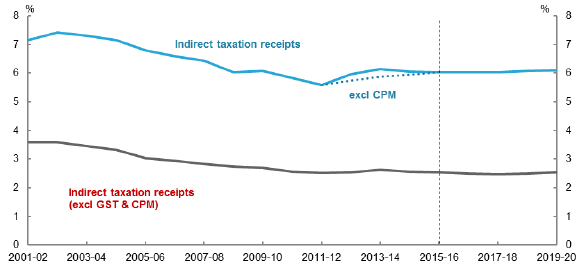
The indirect tax base has been in steady decline for some time. Indirect tax collections (excluding GST and the effect of the carbon pricing mechanism) have fallen from 3.6 per cent of GDP in 2000-01 to 2.6 per cent of GDP in 2012-13. This is a fall of around 1.0 percentage points (around 35 per cent) (Chart 16). Structural factors surrounding alcohol, fuel and tobacco excise as well as customs tariffs have contributed to this long run decline. The re-introduction of fuel excise indexation will help to slow the long-term decline in the non-GST indirect tax base.
Chart 16: Indirect taxation receipts including/excluding GST and CPM as a proportion of GDP
Source: Treasury
Individuals income tax
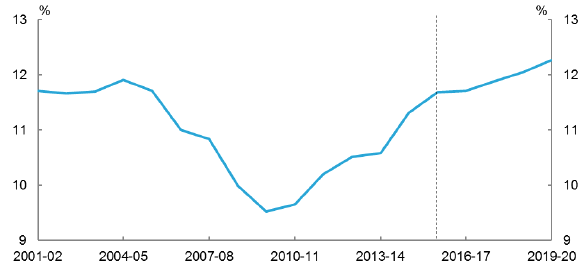
As a share of GDP, between 2004-05 and 2010-11 individuals income tax (including FBT) fell significantly (see Chart 17).
Chart 17: Individuals and other withholding taxes + fringe benefits tax as a percentage of GDP
Source: Treasury
This was largely structural, driven by a succession of individuals income tax rate reductions. Taxes on wages fell from 11.9 per cent of GDP in 2004-05 to 9.6 per cent of GDP in 2010-11, a decrease to the tax-to-GDP ratio of around 2.3 percentage points (19 per cent).
Following the crisis, the individuals income tax-to-GDP ratio has recovered and is forecast to grow as a share of GDP over the period ahead. Recognising the impact that individuals income tax can have on participation, investment in human and physical capital and entrepreneurship, the Government announced that it will increase the 32.5 per cent threshold from $80000 to $87000. It further indicated that it would consider options to reduce the burden of tax on individuals over time as fiscal settings allow.
Trends in State tax revenueiii
So far I have spoken about Commonwealth taxes, excluding the GST. What is the situation with regard to States taxes and the GST?
As with the Commonwealth, States revenue bases have come under pressure in recent years.
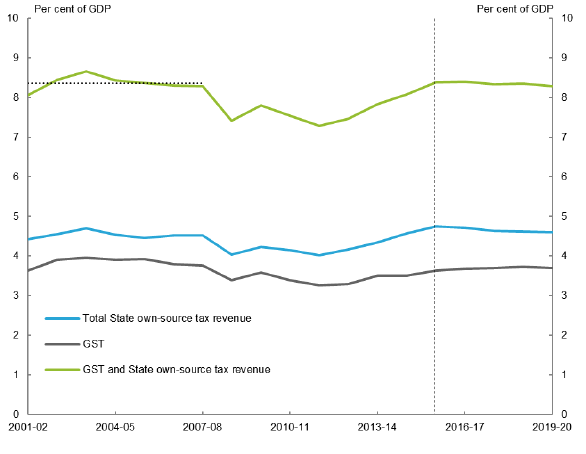
Chart 18 shows state own-source tax revenue and GST as a percentage of GDP. In aggregate, you can see how these declined during the financial crisis and the steady recovery since 2012-13. Over the forward estimates the total of state own-source tax revenue and GST as a percentage of GDP is projected to remain relatively flat.
Chart 18: State own-source tax revenue and GST as a percentage of GDP
Source: ABS GFS, State Budgets and 2016-17 Commonwealth Budget parameters
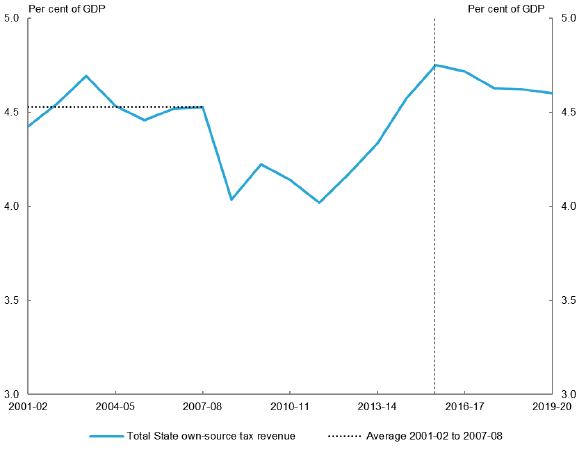
After the GFC, state own-source tax revenue fell by around 0.5 per cent of GDP, before beginning to recover in 2012-13. By 2014-15, it had risen to be a little above the 2001-02 to GFC average level. However, the growth in average own-source revenue from 2009-10 to 2014-15 has averaged 6.1 per cent, lower than 8.1 per cent recorded between 2001-02 and the GFC.
An important contributor to this recent growth in own-source revenue has been residential property stamp duties, which historically have been a volatile revenue source. States forecast their own-source revenue to remain close to current levels over the near term.
Chart 19: Total state own source tax revenue as a proportion of GDP
Source: ABS GFS, State Budgets and 2016-17 Commonwealth Budget parameters
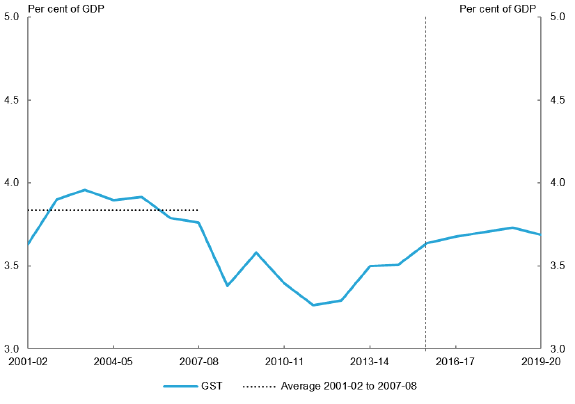
Of course, because GST payments from the Commonwealth make up such a big proportion of state revenues, it is important to also look at what has been happening to GST, as in Chart 20.
Chart 20: GST as a proportion of GDP, 2000-01 to 2019-20
Source: ABS GFS, State Budgets and 2016-17 Commonwealth Budget parameters
In this case, GST as a share of GDP has recovered from its low point, but is projected to remain below the pre-GFC highs.
The tax agenda
I’d like to turn now to the tax agenda over the next few years. The agenda will be a busy one, with significant tax reforms announced in the 2016-17 Budget, and legislation to be enacted to give effect to other Government priorities.
I don’t want to go into the detail on these measures, but will discuss how they relate to the economic and revenue circumstances I’ve described already – namely constrained revenue growth, rapid technological change and challenging global economic conditions.
The Government’s Budget announcements comprised reforms to reduce the tax burden on business, including: cutting the company tax rate to 25 per cent over time; a suite of tax integrity measures; a superannuation reform package; some targeted reforms to improve the operation of parts of the tax system; and an increase in tobacco taxes. Collectively, these measures are expected to improve productivity, participation and living standards, and improve the sustainability and integrity of the tax system. Treasury estimates that the Governmen
t’s tax package will permanently lift annual GDP by around 1 per cent in the long term, compared with no policy changes. This is substantial and compares to the 1¼ per cent estimated GDP gain associated with the combined reforms to telecommunications, ports and rail in the 1990s. In today’s dollars, the gain associated with the Government’s tax reforms equates to $16 billion of additional production in the Australian economy.
Treasury estimates that the Government’s cut to the company tax rate to 25 per cent will increase business investment by 2.7 per cent in the long term. Naturally, shareholders expect a return on that investment, so payments to shareholders, including foreign shareholders, will also increase.
Taking that into account, Treasury estimates that the package would lead to a permanent increase in national income of 0.6 per cent per annum over the long-term – this is the gain to Australians. Higher investment leads to higher productivity and in turn higher wages.
The 2016-17 Budget measures come on top of last year’s National Innovation and Science Agenda which contains a number of initiatives to help align the tax system with a culture of entrepreneurship and innovation. This includes tax incentives to encourage investment in early stage innovation companies and early stage venture capital limited partnerships, as well as reforms to make the venture capital regime more attractive. These initiatives came into effect on 1 July 2016, with eligible investors able to claim the tax concessions from the 2016-17 tax year.
Policies, such as these, that encourage firms to innovate or adopt world leading processes or practices will be important in lifting Australia’s future productivity performance.
Along with the business tax relief announced in the Budget, were a number of business tax integrity measures, including enhanced resourcing for the Tax Office. The combination of these measures will help reduce the vulnerability of the business tax base.
Also announced in the Budget were changes to personal income tax which I mentioned earlier.
These reforms were accompanied by a number of changes to Australia’s superannuation settings. These changes are designed to make our superannuation system (and thus our whole tax system) more sustainable – by better targeting concessions. They are also intended to give greater flexibility to individuals, particularly those who work part time, take time out of work or who have lumpy incomes.
Tax simplification
Another important part of the tax agenda is to make progress on tax simplification. Again, the Government announced a number of measures in the 2016-17 Budget to help address complexity in the tax system.
First, to help streamline the tax system, the Government will introduce designated regulatory reform bills. These will be a vehicle to package measures that support the ongoing maintenance and renewal of existing tax laws, including the removal of unnecessary provisions. It will advance proposals initiated by the Board of Taxation’s ‘Sounding Board’. The Sounding Board is an online collaboration platform that allows users to submit, discuss and vote on ideas to improve the tax system. This will give stakeholders with day-to-day experience in navigating the system to submit ideas. The Board of Taxation will give the Government a regulatory reform priority list to consider, which will be drafted from the ideas, feedback and suggestions received from stakeholders using the Sounding Board.
Second, the ATO will produce public guidelines on the meaning of new tax laws concurrently with new legislation. This will provide greater certainty for taxpayers as to the implications of new law and will reduce the need for the law itself to contain complex detail. The guidelines will not have the same formal status as legislation, but will help taxpayers understand how to comply with the new laws.
Third, the Government announced a number of measures to simplify aspects of the law following Board of Taxation reports.
During the period ahead, Treasury will continue to work with the Board, the ATO and private sector stakeholders to provide advice to Government on further simplification opportunities.
Treasury’s new Tax Framework Division
As we enter a new tax policy phase following the 2016-17 Budget, Treasury is establishing a new, ongoing Tax Framework Division to sit alongside our two existing policy divisions, our Law Design Practice and our quantitatively-focussed Tax Analysis Division.
This Division will be responsible for thinking about cross-tax system issues, including how economic developments are affecting the tax system. It will also monitor international developments in tax at a high level, both in terms of the structure of other countries tax systems and advances in thinking on key tax issues. It will also engage on state tax issues. The Division is also expected to play a role progressing the tax simplification agenda.
The Division will engage closely with other Treasury divisions, academia, the private sector and our State and Territory counterparts.
Engagement with stakeholders
Finally, I want to make some remarks on stakeholder engagement. Our Secretary, John Fraser, has emphasised the importance of meaningful and continued engagement across a broad spectrum of stakeholders. The views of stakeholders are invaluable in helping us to do both our policy and legislative development work. Over the past few years, we have looked to embed a number of different arrangements in order to achieve much stronger and more dynamic relationships with stakeholders. I’ll outline a few of these.
In July 2015, Treasury established an office in Sydney. This was followed by the opening of our office in Melbourne in June this year. Our footprint in these capitals allows us to more easily tap into the broadest possible thinking, form stronger relationships with the private sector and build on existing relationships through additional engagement. In fact, our presence in these capitals is a step change in how we interface with stakeholders. It gives us the ability to have a deeper understanding about how our stakeholders see the world.
Our Sydney and Melbourne offices have also facilitated more secondments from the private sector. These secondments have encouraged information sharing, promoted innovation, deepened the understanding of the practices of other industries and organisations, and created wider networks. In additional to tapping their technical expertise, we have also been able to draw on their different management practices and ways of working. This has helped expand Treasury’s capabilities in so many ways. In the tax space we have had a number of tax partners seconded to us as well as staff at more junior levels.
We have also forged stronger links with the ATO as the administrator of the tax system. Over the years we have had in place informal secondment arrangements which have seen both agencies benefit from building policy and law design capability across tax and superannuation. Recognising the benefits, we put in place more formal arrangements two years ago (July 2014) which sees up to 25 people seconded between the agencies at any one time. Since its inception, the program has involved more than 50 ATO staff and around 17 Treasury staff.
I think we have made a lot of progress in making our engagement more effective at a broad or non-transactional level, as well as on the specific issues that are currently on the agenda. But I am sure there is more we can do together and we look forward to continuing close engagement with the Tax Institute and its members in the future.
Conclusion
I have covered a lot of ground this morning on the economy and what it means for the tax system. It is not possible to accurately predict the future but as policy advisers, Treasury has a responsibility to understand, as best we can
, the forces that will shape it. I hope I have given you at least a refresher on what some of those forces are and some of the context for our work.
I have also laid out the important tax reform agenda which Treasury will focus its efforts on in coming months. We look forward to continuing to work closely with you on these issues into the future.
i I would like to thank the many Treasury colleagues who contributed to this speech, particularly Kirsten Wijeyewardene and Jonathan Fraser.
ii All of the data in the demography section are from the 2015 Intergenerational Report.
iii Note that State tax numbers are based on accrual estimates.