Downloads
Introduction
It’s a great pleasure to be here.
I would like to speak today about tax policy during a resource boom together with some of the longer term implications for Australia resulting from the re-emergence of some key Asian economies, which are driving the boom.
Rapid growth, particularly in China but also India is fuelling demand for mineral and energy commodities, of which Australia has a plentiful supply. This is driving the resources boom, and is the backdrop to current reforms to resource taxation.
This rapid growth will continue to result in further challenges and opportunities for Australia and in this light, it is worth considering how to ensure that the business tax system does not hold us back from making the most of the opportunities emerging in our region.
An Asian century
But first to the rapid economic growth in Asia.
Global transformation underway
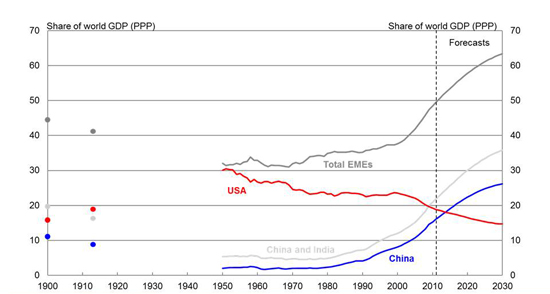
Source: The Conference Board Total Economy Database, Maddison (2010), IMF World Economic Outlook Database and Treasury.
The chart shows the anticipated strength of the EMEs in years to come.
The relative strength of developing economies in Asia in recent years has been particularly apparent when contrasted to disappointing growth in advanced economies following the global financial crisis. However, this relative strength is not simply a post crisis phenomenon.
Between 2001 and 2007, developing economies on average contributed around two-thirds of annual global growth – up from less than one-half in the 1990s.
And between 2011 and 2016, the IMF is forecasting that developing economies will account for around three-quarters of global growth, with the bulk of this expected to come from Asia.
In 2016, the IMF estimates that China will eclipse the United States as the largest economy in the world.
World GDP projections
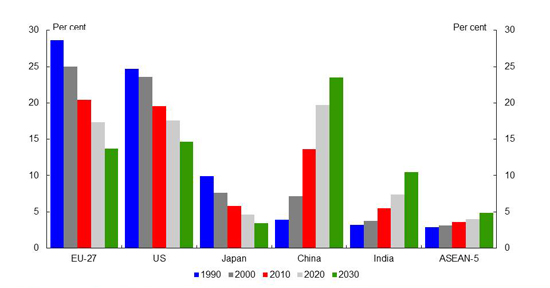
Note: Purchasing power parity adjusted GDP. ASEAN-5 comprises Indonesia, Malaysia, The Philippines, Thailand and Vietnam.
Source: The Conference Board Total Economy Database, Maddison (2007), IMF World Economic Outlook Database, World Bank, OECD, United Nations Population Database and Treasury.
Despite accounting for around one-third of the world’s population, in 1990 China and India produced less than one-tenth of the world’s GDP. Economic reforms that began in both countries in the later part of the last century have seen them move to around one-fifth of world GDP today, in a period when world GDP itself nearly doubled. On some projections, China and India are expected to produce around one-third of world GDP by 2030.
Australia’s location in the world, and our significant natural resources, leave us well placed to be a major beneficiary of this shift in economic weight.
All of you would be intimately aware of the impact this rapid and prolonged growth in our region has had in relation to demand for Australian resources and energy. Over the last decade global consumption of coal and iron increased 50 per cent and 80 per cent respectively. And while global supply of these commodities increased, it did not keep pace with demand and prices increased significantly. At the same time, the growth of China in particular has resulted in an increase in the global supply of low cost manufactured goods.
Australia's terms of trade
(Index 1900-01 to 1999-00 = 100)
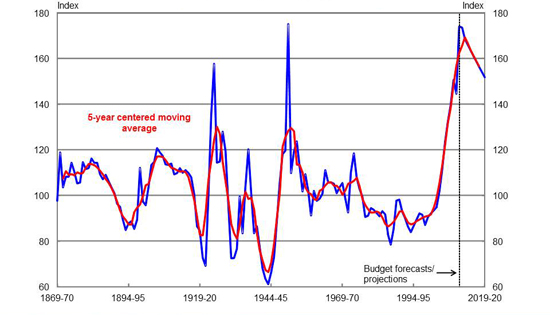
Source: ABS Catalogue Number 5204.0, RBA and Treasury.
High commodity prices and the falling prices of imports resulted in record terms of trade, peaking about a year ago at 150-year highs. Going forward, as the 2012-13 budget papers make clear, we think the terms of trade will decline over the medium term as global supplies of coal, iron ore and other commodities increase. However, viewed from a historical perspective, they are still very high.
Furthermore, the terms of trade, that is the price we receive for our exports compared to the price we pay for our imports, does not tell the full story of the resources boom. In recent comments, the Treasurer referred to there being three booms - the boom in prices, the boom in investment and the boom in exports.
Mining share of investment
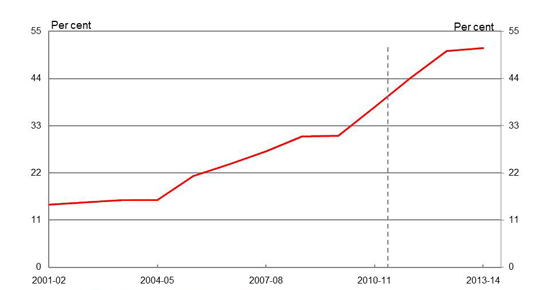
Source: 2012-13 Budget Paper One, Statement Five
As the chart notes, mining’s share of investment has grown rapidly since 2010, and this is in the context of continuing growth in overall investment in the Australian economy.
In 2012-13, capital expenditure planned in the mining sector comes to $119 billion - more than 2.5 times the $47 billion invested in 2010-11 - only two years before.
And there’s more of this to come, with a half a trillion dollar investment pipeline in the total resources sector – massive in the context of $1.5 trillion economy.
Not only is the pipeline larger - up $290 billion or 136 per cent since October 2007 - but over half of this pipeline is already under construction or scheduled to commence, which means the pipeline is more resilient now than it was before the GFC.
Also many of these projects are underpinned by long term supply contracts – improving the resilience of the projects and the export volumes that flow from them.
There’s no doubt these projects are coming online – and these investments are significantly boosting our export capacity, which will contribute to strong growth in non-rural commodity export earnings
The Australian dollar is also at near record levels, driven primarily by the terms of trade, and more recently by international perceptions of it being a safe currency in these uncertain times.
Without discounting the challenges that a high Australian dollar poses for some industries, it is important to note that the rise of Asia also presents tremendous opportunities for businesses outside the resource and energy sector.
Developing economies in Asia are not simply building new cities and infrastructure, but are also producing a new population of middle class consumers.
Projections of the global
middle class by region
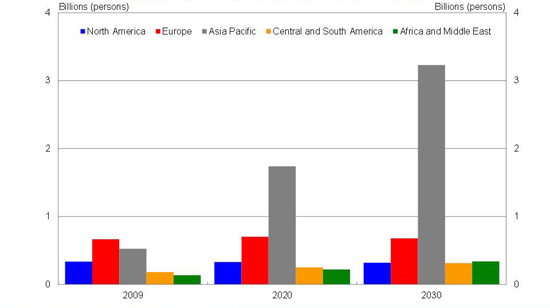
Note: The global middle class is defined as those households with daily expenditures between USD10 and USD100 per person in purchasing power parity terms. The lower bound is chosen with reference to the average poverty line in Portugal and Italy.
Source: Kharas, H, 2010, ‘The emerging middle class in developing countries’, OECD Development Centre, Working Paper No. 285.
The middle class in the Asia Pacific region is currently around 500 million people. On some projections, there will be around 1.7 billion middle class consumers in Asia by the end of this decade, eclipsing Europe as the single largest middle class market in the world.
This offers a vast array of opportunities for Australia. These people will want better services, goods and experiences – they represent a massive potential market for Australian exports, including education, high-end manufacturi
ng, tourism and rural commodities.
The promise of the emerging Asian middle class is already apparent.
In the last ten years, the number of international arrivals from China has increased fourfold and the number of student visas issued to Chinese students has increased by nearly as much. In the last five years, China has increased its share of our wine exports fivefold.
I am not suggesting that China and India will enjoy uninterrupted growth, somehow avoiding the continuing volatility that has marked economic growth in the developed world. However, barring major social dislocation, that economic volatility is likely to manifest itself as cycles around a strong and sustained high average growth trend. And the low base that the growth in China and other Asia-Pacific countries is coming off suggests these countries have a lot of growth ahead of them.
GDP per capita
(Per cent of OECD -15 average)
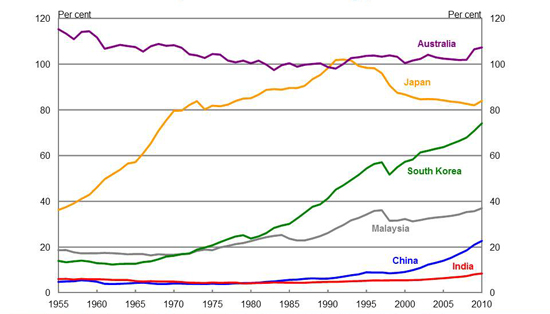
Note: OECD-15 = Australia, Austria, Belgium, Denmark, Finland, France, Iceland, Ireland, Netherlands, Norway, Sweden,
Switzerland, UK, US and Canada.
Source: The Conference Board Total Economy Database and Treasury.
This means that Australia is not so much feeling the impact of a temporary boom, but rather the start of a prolonged structural shift in the global economy. And the implications of this structural shift go far beyond economic policy.
But we cannot assume Australia will automatically be the beneficiary of these developments. As the terms of trade appear to have peaked, going forward, increased real incomes and rising living standards will depend on productivity improvements – not on continued price rises in the commodities we sell, or cheaper imports resulting from the strong Australian dollar.
Taking advantage of these opportunities requires businesses that are innovative, willing to develop and test new products, and keen to invest in new skills and new ways of doing business.
Taxation policy has a part to play, including by ensuring that the tax system raises revenue in a manner that imposes least cost to the economy, and addressing impediments to innovation and productivity growth where they arise.
Tax reform
So, how do we make the most of these opportunities? And what is the role of public policy and tax policy?
First, we must recognise that when we sell resources we are selling non-renewable community assets. And although we may have large reserves, it is still the case that once these assets are sold, they cannot yield any further returns for Australia’s citizens. This means it is critical that we receive an appropriate return for these assets.
Consistent with this, on 2 July 2010, the Australian Government announced that it would introduce the Minerals Resource Rent Tax – or the MRRT – which would apply to all coal and iron ore operations in Australia. The MRRT commenced operation on 1 July 2012.
The key feature of the MRRT is that it is a profit - based or rent tax. Unlike royalties, such taxes allow for project costs to be fully recovered and a return made before any tax is payable. So as not to discourage investment, only the gap between expected profit and the level needed to induce investment – the ‘normal’ rate of return - is subject to tax. This is the rationale behind the MRRT as a more efficient means of sharing the rents between the owners of the resource, and the industry that extracts them.
Over the longer term, it is expected that the introduction of the MRRT - like the initial introduction of the Petroleum Resource Rent Tax over 20 years ago - will meet the Government’s objective of ensuring the Australian community appropriately benefits from the exploitation of its non-renewable resources, without denying industry returns commensurate with the risks it accepts in undertaking exploration and development activities.
Of course, you would be aware that the MRRT is subject to a constitutional challenge and I am sure I am not alone when I say I await the outcome of the challenge with interest.
Broader implications for the Australian economy
But there are broader business tax issues stemming from the resources boom. We are all familiar with the term ‘two speed economy’ and the underlying reality of uneven economic growth and the concerns voiced by many regarding this phenomenon.
High resource prices, combined with a high Australian dollar, are currently drawing both labour and capital out of non-resource parts of the traded sector - including many, but not all, parts of manufacturing - and into mining and construction.
Employment share by industry
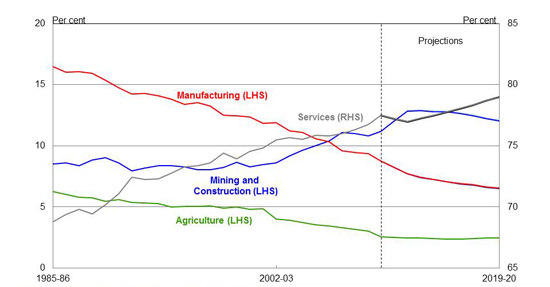
Source: ABS Catalogue Number 6291.0.55.003 and Treasury
However, while the rise of mining and decline of manufacturing continues to be the subject of much debate, it is worth noting that while the strongly rising share of employment in the mining and construction sectors is a relatively recent phenomenon, dating from the beginning of the mining boom in around 2003-04, the decline in the share of employment in manufacturing is not. It is instead the continuation of a trend that has been evident for the last few decades.
And, although there has been strong employment growth in mining and construction, the service sector has accounted for far more of the economy's employment growth since the beginning of the mining boom, creating jobs for around 1.5 million people since the start of the mining boom. Employment growth in health care and social assistance, professional, scientific and technical services, and education and training have been particularly strong.
Nonetheless, the structural adjustment underway is having differential effects on Australian industries and regions.
Business tax working group
The Business Tax Working Group was established by the Treasurer to look at how our tax system can be improved to assist with the challenges and make the most of the opportunities arising from transformations in the broader economic environment, with a focus on relieving the tax burden on new investment.
It is also examining a range of offsetting savings in Commonwealth business taxation to ensure that a revenue neutral package of reforms can be delivered, in line with the Government’s fiscal strategy.
The Working Group is headed by Chris Jordan, Chairman of the Board of Tax. Among its 9 members are representatives from businesses and unions, as well as academics, tax practitioners, legal experts and a lone public servant (me!).
Our terms of reference can be broadly divided up into two phases. Phase one of our work involved the tax treatment of losses with an interim report submitted at the end of last year and a final report in March 2012. In phase two we are considering the longer term structure of the business tax system, with a focus on options for lowering the company tax rate.
Tax treatment of losses
The Working Group’s initial focus was on the tax treatment of losses and its advice led to the Government announcing the introduction of loss carry back for companies in the 2012-13 Budget.
Companies that report a loss in this financial year will be able to carry back up to $1 million worth of losses to offset them against tax paid in 2011-12. And from next financial year, they will be able to carry back up to $1 million worth of losses against tax paid up to two years earlier. That means companies will be eligible for a tax refund worth up to $300,000.
This measure goes someway to addressing the asymmetrical treatment of profits and losses that e
xists in the tax system, whereby profits are taxed in the period they are earned, but tax refunds are not provided where losses are incurred – which biases investors away from taking otherwise worthwhile risks. In the context of an economy undergoing structural change, worthwhile risk taking and entrepreneurship will be essential if businesses are to restructure and invest in new products and business strategies.
The introduction of the loss carry back brings the Australian tax system in line with a number of international tax systems including the United States, Canada and the United Kingdom.
On 23 August, the Assistant Treasurer released exposure draft legislation and explanatory materials for the loss carry back measure. As with any new tax measure, the need for integrity rules has been a focus of designing the loss carry back measure. While the exposure draft legislation essentially applies the same continuity of ownership and same business tests as apply for carry-forward losses, consultation on the exposure draft will also consider whether there is a more suitable alternative for loss carry back. Submissions in response to the draft legislation and explanatory materials are due on 19 September.
Company tax rate
The Working Group is now considering the merits of further reductions in the company tax rate, fully funded from within the business tax system.
Corporate tax in Australia
(1980-present)
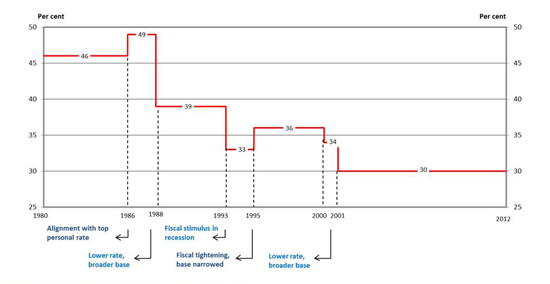
Source: Business Tax Working Group Discussion Paper 13 August 2012
Australia’s company tax rate has generally trended downwards since the 1980s. Where governments have increased the company tax rate it has been done to align it with the top personal rate or as part of a fiscal tightening. Significant cuts in the company tax rate have typically been accompanied by a broadening of the company tax base.
Previous tax reviews have consistently identified a lower company tax rate as being important for Australia’s ability to attract foreign investment and increase the nation’s capital stock, boosting productivity.
However, the benefits of a lower corporate tax rate will be dynamic rather than static. In the short run, a lower corporate tax rate should predominately benefit capital owners in the form of enhanced levels of profitability. Such higher rates of return may be reinvested within the business or distributed to shareholders. However, a reduction in the company income tax rate would also increase the after tax return on investment, encouraging more investment and thereby enhancing the capital to labour ratio within the economy. This process of ‘capital deepening’ can increase the marginal product of labour, resulting not only in higher economic growth but also higher wages in the long term.
A lower corporate tax rate could also assist businesses, particularly those in non-mining sectors, adjust to the additional competitive pressures resulting from the high Australian dollar.
While there is certainly some support within the business community for cutting the company tax rate, how to fund any cut from within the business tax system is more challenging proposition.
On 13 August, the Working Group released a discussion paper that canvasses a number of possible ways by which a cut to the company tax rate could be funded via a broadening of the business tax base. The options identified relate to three broad areas – namely interest deductibility; capital allowances and capital expenditure; and the R&D tax incentive.
I note that a number of views have already been expressed in the media by industry and others regarding the merits or otherwise of the canvassed options. And I would like to reinforce that an option’s inclusion in the discussion paper should not be interpreted as an indication that it will be recommended or pursued.
Rather the paper is simply intended to provide a sound basis for consultation and assist the Working Group in considering whether the revenue currently forgone through these or other measures would be better directed at lowering the corporate tax rate. These considerations will also be supported by economic modelling which will be undertaken by the Treasury.
In light of responses to the discussion paper, some of the options may be dropped, others may be amended and new ideas may be canvassed.
I would encourage you all to engage constructively with the Working Group throughout the consultation process. Written submissions in response to the discussion paper are scheduled to close on Friday, 21 September 2012.
The Working Group intends to release a draft final report in late October 2012 for a further round of consultation. That draft final report is expected to include draft recommendations and a summary of feedback on the discussion paper.
The Working Group will finalise our report to the Treasurer before the end of the year at which time the Government will consider the report.
Conclusion
Australia’s geographic location and our substantial resource endowments leave us well placed to benefit from the economic rise of Asia. We are currently benefitting from a huge increase in demand for our mineral and energy resources, and reforms to resource taxation are aimed at ensuring we receive an appropriate return on the sale of Australia’s non-renewable assets.
And in the longer term, we can expect a growing Asian middle classes, with growing disposable incomes, to generate strong demand for a range of Australian goods and services – whether they be food and high-end manufactures or tourism, educational, financial and other professional services. However, in the meantime, the high dollar is placing pressure on non-resources tradeable sector of the economy, including some of those sectors that may benefit in the long run from the rise of Asia.
It is not possible to predict with any accuracy which of Australian economic sectors will benefit most from the re-emergence of China and India into the global economy. And this is an argument for maintaining, and enhancing where possible, the flexibility of the Australian economy.
This flexibility will remain valuable well beyond the resource booms. While structural change is particularly apparent at present, the Australian economy is constantly changing. In a typical year, around 300,000 new businesses are established, and a similar number close their doors. Around 2 million people start new jobs and leave old ones, with half a million changing industry.
It is here that business tax reform has a role to play. While reducing the efficiency costs of the tax system is clearly a worthy goal in any circumstances, the pressures and opportunities associated with developments in Asia suggests that now is the time to make genuine progress towards that end.