Downloads
Introduction
I would like to thank the University of Western Australia Business School and the Economic Society of Australia for inviting me to give this lecture, which commemorates the foundation Professor of History and Economics at this University, Edward Owen Giblin Shann.
Edward Shann made a tremendous contribution to the economics profession during a time when there were a number of similarities with today. In reading up on Shann, I was struck by the irony that one of his most famous pieces of work concerned the reliance on foreign capital at a time of uncertain export prices. He saw periods of high population growth, terms of trade volatility, financial market meltdown and fragility - though in an economy with less flexibility than we now have. While he didn't use this language, he understood that being able to adapt was crucial to improving wellbeing.
This lecture series honours Shann's own distinctive contribution to Australian economics. But when one looks at the topics past speakers have addressed, it provides a window into the issues of the day and the frameworks and tools that have been so important in navigating these challenges over five decades.
Once again we face a period of great complexity, requiring decisions which will fundamentally shape the future wellbeing of Australians -what we in the Treasury think of primarily as a person's substantive freedom to lead a life they have reason to value, a concept found throughout Shann's writings.
As has been noted in the recent Budget papers and elsewhere,1 while the medium term outlook for the Australian economy remains positive there are significant short-term risks relating to the global economic outlook.
In particular, despite the recent financial assistance package for Greece and agreement to lift the debt ceiling in the United States, sovereign debt concerns persist around key European economies and, to a lesser extent, the United States.
It is not well appreciated in Australia that our economic position is markedly different to that of the rest of the developed world. While a number of factors were at play, it should be obvious that if it were not for our flexibility - itself a consequence of sustained structural reforms and sound monetary and fiscal frameworks - Australia would not have avoided the worst of the impacts of the global financial crisis (GFC).
However, it should give us pause that the US economy shrunk by 5 per cent during its most recent recession and today has still not made up this loss. Indeed, real GDP per person in the US is still over 3 per cent lower and the proportion of adult Americans in employment is around its lowest level in a quarter of a century.
When we look at Europe or Japan, the situation is even more grim - Japan's real level of GDP is 6 per cent lower than its pre crisis peak, while the Irish and Greek economies are 12 and 10 per cent smaller than before the crisis.
Many of these economies also face persistently high unemployment rates, with the unemployment rate in the euro area around 10 per cent, the US at around 9 per cent and the UK at around 8 per cent.
The lack of credible medium term fiscal and structural policy strategies to address the underlying competitiveness and debt issues on both sides of the North Atlantic, along with evidence that the US recovery has been much weaker than previously thought, is generating considerable uncertainty and volatility in global financial markets.
Unfortunately, recurrent episodes of volatility are likely to be a feature of global financial markets over the next few years. Such is the sense of concern over the lack of credible policy responses, repeat episodes may be triggered by apparently innocuous events or pieces of information.
This risks adding a dimension of macroeconomic instability into the Australian economy of a sort that we have not experienced for many years. As we know from our past history, and from experience in other countries, such instability makes economic management considerably more difficult and results in more volatile growth and fiscal outcomes.
And, as I have discussed elsewhere, our closer economic integration with the world's major emerging economies means we are more exposed to volatility arising from policy mis-steps in key trading partners such as China, which are trying to manage challenges arising from greater liberalisation of their economies.
These current risks need to be set against a backdrop of longer-term trends influencing the Australian economy, trends that offer huge opportunities for Australia and which will influence the sustainability of the wellbeing for future generations.
Indeed, I believe the theme of sustainability will need to shape the approach to policy development of this generation.
While there is a growing awareness of sustainability issues, these are often cast in terms of the environment and, more specifically climate change.
But issues of sustainability are much broader than this.
So what do we mean by sustainability?
Sustainable wellbeing requires that at least the current level of wellbeing be maintained for future generations.
In this regard, we can consider sustainability as requiring, relative to their populations, that each generation bequeath a stock of capital - the productive base for wellbeing - that is at least as large as the stock it inherited.2
As wellbeing is a multidimensional concept, going beyond material living standards - and even the environment - we can see that the stock of capital, or the productive base for wellbeing, should include all forms of capital:
- physical and financial capital - the value of fixed assets such as plant and equipment and financial assets and liabilities;
- human capital - the productive wealth embodied in our labour, skills and knowledge and in an individual's health;
- environmental capital - our natural resources and the eco-systems which include water, productive soil, forest cover, the atmosphere, minerals, ores and fossil fuels. In other words, all the natural resources that support life and other services to society; and
- social capital - which includes factors such as openness and competitiveness of the economy, institutional arrangements, secure property rights, honesty, interpersonal networks and sense of community, as well as individual rights and freedoms.
These stocks create flows of goods and services which contribute to the wellbeing of all Australians.
Running down the stock of capital in aggregate diminishes the opportunities for future generations. In one way or another, eroding the productive base will lead to lower future wellbeing.
Note, though, that drawing down any one part of the capital base may be reasonable as long as the economy's aggregate productive base is not eroded. For example, reducing our natural resource base and using the proceeds to build human capital or infrastructure may offer prospects of higher future wellbeing. A necessary, but not sufficient, condition for this to be the case is that those resources are priced appropriately and that the returns are invested sensibly.
When one thinks about wellbeing, rather than GDP, it becomes quickly apparent that society does not get an adequate return on many environmental goods. For example, water and carbon are not yet priced appropriately. In the case of minerals and energy, arguably society is not sharing sufficiently in the returns from their exploitation, with the vast bulk of the benefits accruing to the shareholders of the firms doing the mining. As such, society is not getting the resources it would need to build up other parts of its capital stock.
Unsustainable growth cannot continue indefinitely - if we reduce the aggregate capital stock in the long run future generations will be made worse off. The problem
is that we can be on an unsustainable path for a long period - and by the time we recognise and change, it could be too late.
Long-Term Trends
There are four long term trends facing the Australian economy that will have a significant effect on its future shape. These are:
- continued globalisation and the development of emerging market economies - particularly the rise of China and India as global economic superpowers;
- continuing rapid technological innovation;
- demographic change - the ageing of the population; and
- environmental pressures - including climate change and water.
This complex mix of long-term trends will have significant impacts, both positive and negative, on Australia's productive base and, therefore, the wellbeing of future generations.
Globalisation and the rise of Asia
The first of these four long term trends is continued globalisation. The global economy is in the midst of a radical transformation, unprecedented in the last 100 years.
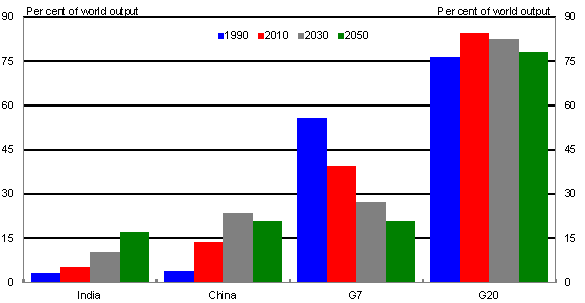
The speed of globalisation has accelerated through the advancement of new technologies, falling transport costs, and as tariffs and other barriers to trade have been removed. (Chart 1)
More countries are opening up their economies and seizing the opportunities that arise from being integrated within the global economy.
Chart 1: Shares of World domestic product over time
Source: IMF and Treasury.
Continued globalisation has also led to significant growth in developing economies. As highlighted by Nobel laureate Michael Spence, who recently visited Australia, 13 countries3 (including China) have grown by more than 7 per cent per year on average for 25 years or more, and this list of countries will only grow - it will not be too long before India may also join this club.
The growth of developing countries is also reshuffling the deck in terms of countries' relative economic importance.
For example, China is now the second largest economy in the world, and is expected to surpass the US in size by 2020 while India is on track to surpass the US by mid century. This is not just of economic interest for Australia - economic success is the foundation for global influence and for seats at the table in key global fora.
These trends are therefore shifting both geo-strategic and geo-economic weight from the western advanced economies towards the emerging market economies. The pace of this transformation has been much faster than anticipated even a decade ago. The failure to tackle the structural and debt problems of the developed world will only accelerate this transformation.4
A natural part of this development will be shifts in comparative advantage.
Emerging market economies face increasing pressure to upgrade their industrial base to compete in higher value-added manufacturing - towards areas that have traditionally been the domain of advanced economies. We saw this during the emergence of Japan and the Newly Industrialising Economies5 and we are seeing it now with China.
So as emerging market economies grow, new areas of comparative advantage for Australia will open while some existing areas will face increasing pressure.
These developments will have implications for the structure of the Australian economy.
Already, the resource intensive nature of China and India's growth, reflecting their industrialisation and urbanisation, represents one of the most significant shocks to hit the Australian economy. As Chart 2 - which shows China and India's catch-up in per capita incomes - suggests, this transformation underway in both countries has the potential to go on for decades.
Chart 2: GDP per capita
(Per cent of OECD -15 average)
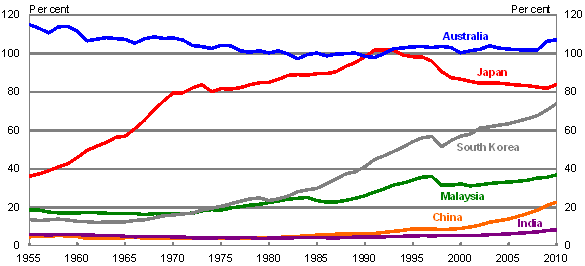
Note: OECD-15: Australia, Austria, Belgium, Denmark, Finland, France, Iceland, Ireland, Netherlands, Norway, Sweden, Switzerland, UK, US and Canada.
Source: The Conference Board Total Economy Database and Treasury.
The continuing transformation of the economies and societies of China and India has far-reaching implications. For example, by 2020, the Asia Pacific region could have more people in their middle class than the rest of the world combined. China could have a middle class market that surpasses the US in dollar terms. The continued rise of the Asian middle class presents Australia with huge opportunities - a potentially very large market for our goods and services. But it is not pre-ordained that this will benefit us - we need to take the decisions that will allow us to succeed in this new world, one where there will be a premium on a flexible, adaptable and innovative Australian business culture.
For now, the mining boom is the most obvious early manifestation for Australia of the shift in the world's economic geography from west to east.
With the rise of China and India, the global demand for resources and energy has out-stripped the rise in global supply, resulting in a sharp rise in global resource and energy prices.
In addition, growth in the manufacturing sectors of China has led to increased global supply of low cost manufactures.
Together, this has resulted in Australia's terms of trade reaching their highest sustained level in 140 years.
Improved terms of trade increase real national income - the rise in global commodity prices increases the value of Australia's mineral and energy endowment. In short, it's as if we woke up one morning and found the world had made us richer as a nation. We can now purchase more imports for each unit of exports; or, put another way, we can afford to purchase more without doing anything else different.
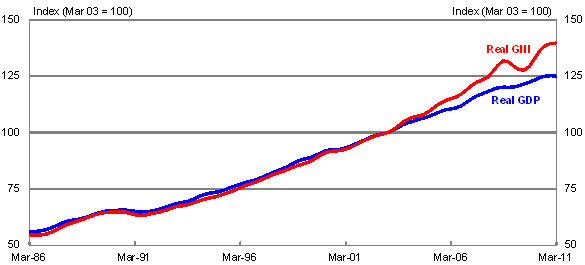
We can see the extent of the improvement in real incomes arising from the improvement in the terms of trade by comparing real GDP and real gross national income (GNI) - with the difference between the two representing changes in the terms of trade and net overseas transfers. (Chart 3).
Since March 2003, real GNI has grown significantly faster than real GDP, by around 14 per cent.
The improvement in the terms of trade has in fact accounted for around 40 per cent of total real national income growth since early 2003.
Chart 3: Real GDP vs Real GNI
(Trend)
Source: ABS Catalogue Number 5206.0.
Is this sustainable?
Eventually no, but when this is likely to be the case remains unknown.
At some point, growth in the global supply of commodities will start to outweigh the continued strong growth in demand, which will first stop the rise in prices and, eventually see them fall.
The Budget outlines a central case where the terms of trade come off slowly, declining by around 20 per cent over the next 15 years.
As an aside, some have claimed that the Budget is hopelessly optimistic, with the terms of trade assumption apparently interpreted as meaning we believe in perpetual unfettered growth in China.
This is not the case.
Even if the 21st century is the Asian century, it would be naive to believe there will not still be economic cycles - recall that even though we now refer to the 20th century as 'the American century',
the US experienced numerous economic slowdowns and recessions (to say nothing of the Great Depression). But absent geostrategic or social crises, viewed through the prism of history, cycles over the next few decades are likely to be around a sustained trend increase in emerging Asian GDP and living standards.
While the current level of the terms of trade will not be sustained forever, they are expected to remain high for a very long time. As such, it is worth looking at some of the implications of this.
First, despite the significant improvement in the terms of trade, and consequent increase in national income, many Australians don't feel better off. Why is this?
We are currently seeing the higher terms of trade resulting in a shift in economic activity towards mining and related sectors, with scarce labour and other factors of production being drawn away from other sectors involved in international trade.
This structural adjustment has distributional consequences - many at a geographical or sectoral scale.
For example, at the time of preparing the 2011-12 Budget, the domestic economy was forecast to grow at around 4 per cent in 2011-12. But this aggregate forecast masked considerable divergence at a sectoral level.
The mining and related metals manufacturing sectors were expected to grow at around 10 per cent, boosted by the surge in mining investment. But the mining and related metals manufacturing sectors only comprise around 12 per cent of the economy (in 2009-10).
In addition to generating strong growth in the mining industry, the resources boom is supporting strong growth in the mining-related construction, services, manufacturing and transport sectors. Mining-related production, which represents a further 8-10 per cent of the economy, was expected to grow around 30 per cent in 2011-12 and 20 per cent in 2012-13.
But this leaves around three quarters of the economy's output not being boosted directly from the mining boom. Abstracting from the agricultural sector, it is estimated that the remaining non-mining economy will only grow at around 1 per cent annually in 2011-12 and 2012-13. In other words, a structural decomposition of the budget GDP growth forecasts implies that a large proportion of the economy will record weak growth for at least the next two years – a direct consequence of the impact of the terms of trade on the exchange rate and competitiveness, the lingering effects of the global financial crisis including the cautious consumer, and Australia's decade-long productivity performance.
But even this 1 per cent growth rate masks significant divergence, with some service sectors growing and generating significant increases in employment (for example in 2010-11, the number of people employed in health care and social assistance grew by 6.2 per cent) with other sectors (for example retail and wholesale trade, and manufacturing) under considerable pressure.
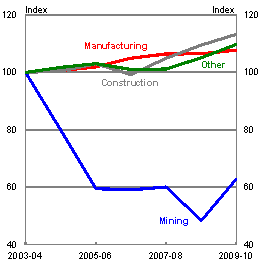
We can also see the pressure of structural adjustment by examining the real producer wage - that is, labour costs relative to producer prices.
The real producer wage in the mining sector has fallen significantly since the beginning of the mining boom, as output price growth in the sector has outpaced very rapid nominal wage growth. This is, in effect, a price signal to mining firms to hire more labour, even at much higher nominal wage rates, and has been driving strong employment growth in the mining sector (although in absolute terms the sector is only a very small employer).
In contrast, the relative wage costs for firms in other industries like manufacturing have increased, in part because the higher exchange rate is restricting their capacity to maintain prices.
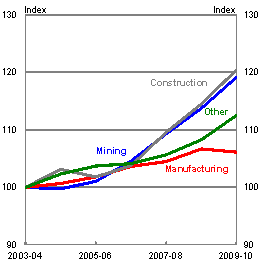
But for workers, the incentives they face and their standard of living depends not on real producer wages but how their earnings have fared relative to consumer prices. (Chart 4).
Chart 4: Real wages
(By sector)
Producer real wage
Consumer real wage
Source: ABS Catalogue Numbers 6302.0, 6401.0 and 5204.0.
In this regard, real consumer wages (that is wages deflated by the CPI) in the mining and construction sectors have grown strongly, increasing by around 20 per cent since the beginning of the boom. On the other hand, real wages in the manufacturing sector have grown much slower since the beginning of the boom, and actually fell over the past year.
That the relatively strong growth in earnings in the booming mining and related sectors of the economy has not spilled over to the rest of the economy is a sign of the economy's flexibility. This reflects positively on labour market reforms of past decades. Together with other structural reforms to improve the economy's flexibility, this has helped moderate across the board wage inflation pressures and facilitated necessary resource reallocation - the result is higher employment than we would have seen if the reforms of the 1980s and 1990s had not been implemented.
But we also need to recognise that nominal wage growth in some parts of the economy has also been slowed by the competitive pressures on the non-mining traded goods sector from a higher exchange rate. This has put pressure on many businesses, creating uncertainty over future profitability and employment prospects, and dampening wage growth. This is compounded by uncertainty over the global economic outlook.
A higher exchange rate has, however, provided consumer benefits by reducing the cost of imported goods - one way the benefits of the boom are spread across the economy.
A further reason households may not feel wealthier in the face of the mining boom is that despite the increase in the terms of trade, real incomes have continued to grow at around the same rate as they did in the 10 years prior to the boom.
The reason real incomes have continued to grow at around the same rate, despite the improvement in the terms of trade, is because labour productivity has not kept pace with the high growth achieved during the 1990s. I have discussed the consequences of this for Australia's future income growth elsewhere6, but it also feeds back directly into the pressures confronting some Australian firms as a consequence of the exchange rate.
So while households have higher real purchasing power as a consequence of the boom and its impact on the exchange rate, real income growth is occurring only at a rate with which people are already familiar. This, combined with the employment effects of restructuring, appears to be resulting in a sense that people are not sharing in a once in a century increase in Australian wealth.
Given the implications for the economy as a result of globalisation, and the rise of China and India in particular, it will be important that we adapt in a sustainable way. Whether we do this however, will depend on whether policy makers and businesses make the right decisions for the long-term.
A flexible, responsive economy will be crucial.
It will be important that we facilitate structural adjustment, not oppose it.
It will be important to build new comparative advantages through investments in infrastructure, education, skills and innovation and that we take advantage of the opportunities presented by the continued development of the emerging market economies.
Rapid technological advancement
The second long term trend is continue
d technological advancement.
Rapid technological advancement will have significant implications for sustainability - improvements in ICT in particular, have the prospect of improving productivity, service delivery and networking. Technological advances have already transformed businesses and trade and played an important role in reducing the 'tyranny of distance'.
In short, ICT is an enabler of change, for both business and the public sector.
It enables new innovative tools to be developed, allows new business models to arise, facilitates the emergence of new products, industries and production processes as well as increasing competition and greater specialisation. This will have a profound impact on the Australian economy.
The ICT revolution will also have implications for the way in which government services are provided to a growing and ageing population and, more generally, for the way in which citizens of all ages interact with their governments. This will be especially valuable for rural and regional Australia.
Already we are seeing how ICT is changing the contact points between governments and its citizens. In particular, continued ICT advancement will improve the delivery of education and health services, improving human capital.
ICT will continue to change the way we do business and provide Australia with an avenue to capitalise on the opportunities we have over the decades ahead.
Demographic change - ageing and population growth
I would now like to turn to the third long term trend - demographic change.
As with all other advanced economies - and many emerging economies - Australia has an ageing population, reflecting the combined effects of the decline in fertility since the 1960s, the shift of the baby boomer population bulge into ever older age cohorts and a general increase in life expectancy.
The proportion of the population aged 65 and over has increased from just over 8 per cent in 1969 to around 13 per cent today. The 2010 Intergenerational Report (IGR) projected that by 2050 the proportion of the population aged 65 and over would rise to around 23 per cent.
Furthermore, it projected that by 2050, around 5 per cent of the population - that is one in twenty - will be aged 85 and over - this compares to around 1.8 per cent today.
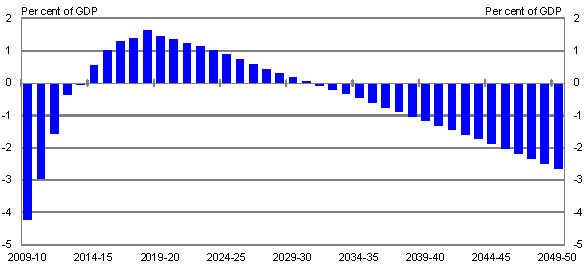
The ageing of the population will create substantial pressures around fiscal sustainability. (Chart 5).
Chart 5: Projected fiscal gap
Source: Treasury.
Rising dependency ratios and slower economic growth will reduce the capacity of Australia to fund its spending commitments. At the same time increased demand for age-related payments and services, including through technological advancements in health and demand for higher quality health services will drive up expenditure.
The 2010 IGR projected that increased ageing and health pressures would result in an increase in total government spending from around 22.4 per cent of GDP in 2015-16 to over 27 per cent of GDP by 2049-50.
As a consequence, spending was projected to exceed revenue by 2¾ per cent of GDP in 40 years time.
While we always need to keep in mind the limitations of exercises like the IGR, there is a consistent message about the importance of a long-term approach to policy and fiscal sustainability.
In that regard, it is important to recognise that even small variations in productivity growth and participation rates can have significant consequences.
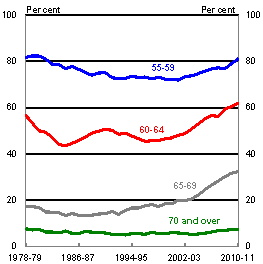
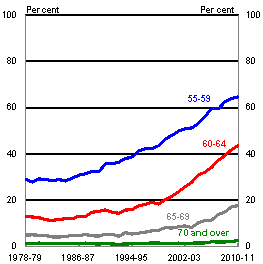
We are already seeing differences in the participation rates for older Australians, although we do not know whether these will be sustained. (Chart 6).
Chart 6: Participation rates of older Australians
Males
Females
Source: ABS Catalogue Number 6291.0.55.001.
The 2010 IGR illustrated that while the rate of ageing has reduced somewhat compared with previous IGRs, the proportion of traditional working age people is still projected to fall markedly, reducing the average rate of labour force participation.
Arguably, the main conclusion of the IGR is that ageing will slow annual growth in GDP per capita by about 0.3 per cent per year over the period to 2050. That is, the impact of ageing will be around three times that of responding to climate change!
If our participation rate in 2049-50 turns out to be 57.0 per cent rather than the 60.6 per cent we are currently projecting, real average annual GDP growth will fall by a further 0.11 percentage points. This small change in the participation rate will also lead to increased spending in the order of 0.9 per cent of GDP in 2049-50 (or around $33 billion in 2010-11 terms) on health care, aged care, pensions and education, putting further pressure on the budget.
For this reason, participation and productivity enhancing policies are key to ameliorating the economic impacts of an ageing population.
Environmental sustainability
The fourth long term trend is environmental sustainability.
Environmental issues, particularly climate change, are probably those most commonly associated with the term "sustainability".
With the expected rapid growth of the global economy over coming decades, significant pressures will be placed on global resources - particularly the natural environment.
This presents a serious challenge, not only for Australia but for the world.
The Australian economy will need to become more energy, resource and environmentally efficient.
In fact, going forward, energy, resource and environmental efficiency will be key drivers of productivity.
The Australian economy faces a number of pressures on environmental sustainability, including: climate change, salinity, resource depletion, in addition to water availability and pressures around biodiversity.
Today I will only briefly touch on climate change.
Climate Change Policy
Climate change policy - both in relation to adaptation and mitigation - is not just an environmental issue; it is more fundamentally an economic and social challenge.
The impact of decisions today will be felt in decades to come, and the progression of climate change impacts is unlikely to be linear.
There are significant risks and uncertainties arising from our imperfect knowledge of the climate system. It is possible that climate impacts could suddenly accelerate. In fact, certain impacts to the climate system may lead to a tipping point where sudden irreversible changes arise.
These sudden changes may not be seen for some time, but they could arise from our actions, or inaction, today. To an economist, climate change is fundamentally a risk management issue. Even if you do not accept all elements of the science, prudence suggests taking out some form of insurance.
We also need to remind ourselves, and others, that if no-one acts first we all lose. But more so - unless we all act, we all lose in the end.
That said, the world is moving (Chart 7) - Australia is not a first mover, but more accurately described as in the middle of the pack.
Chart 7: World climate change action
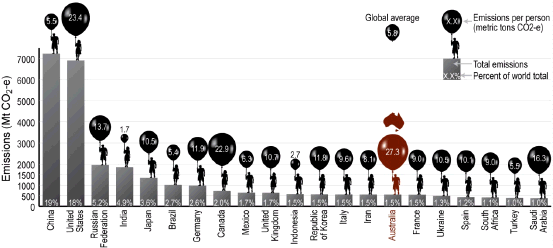
Moreover, to suggest Australia should do nothing because we are only 1.5 per cent of emissions suggests that most countries should do nothing (Chart 8) - not Indonesia, not the UK or France.
Chart 8: Global comparison - overall and per person emissions in 2005
Note: Land use change is excluded.
Source: Climate Analysis Indicators Tool, Version 8.0 (World Resources Institute, 2010).
Rather, we should leave all the heavy lifting to the US and China. This conveniently overlooks the fact that Australia's per capita emissions are five times larger than those of China (and almost three times that of France and the UK, 10 times that of Indonesia and greater even than in the US).
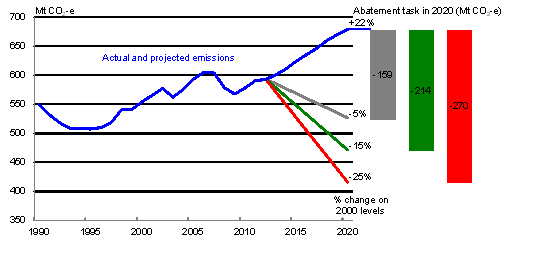
Chart 9: Climate change policy
(Climate change baseline projections)
Note: Emissions include abatement from Carbon Farming Initiative of 7Mt CO2-e.
Source: Treasury.
In the absence of further policy action, strong growth in Australia's emissions is projected between now and 2020 - emissions are projected to reach 679Mt CO2-e in 2020, or 22 per cent above 2000 levels (555Mt CO2-e). (Chart 9).
The level of projected emissions in 2020 represents the starting point for Australia's abatement challenge - the amount of abatement required from additional policies to achieve national emissions targets in 2020.
Based on these projections, Australia requires additional abatement of between 159Mt CO2-e and 270Mt CO2-e in 2020, depending on the target, after accounting for the abatement from the Carbon Farming Initiative.
A 5 per cent target sounds small.
15 per cent and 25 per cent sound much bigger.
But Australia's bipartisan 5 per cent target - a reduction of 159Mt CO2-e - is actually equivalent to a 23 per cent cut compared to the expected 'business as usual' level of emissions in 2020.
By way of comparison, 159Mt CO2-e is roughly 80 per cent of Australia's total current emissions from the generation of electricity, or roughly twice our road transport emissions.
All of this highlights just how important it is to achieve greenhouse gas emission reductions in the most efficient manner possible.
It is clear that poor policy choices will mean that the economic costs of meeting Australia's emissions targets would be substantially larger than it needed to be, with negative impacts on productivity, living standards and overall wellbeing.
So when is the right time to reduce emissions?
The key message from the Strong growth, low pollution modelling was that the economy will continue to prosper while emissions are reduced.
Further, the economic costs of adjustment are modest if action starts sooner rather than later - delaying action will only raise the eventual economic costs.
The resulting structural adjustments will generate concerns
A common thread across all these longer term trends is that they all involve structural adjustment.
This structural adjustment can be managed, or it can be opposed - the critical point is that it cannot be avoided. Moreover, history shows that opposing adjustment rarely succeeds, and the negative consequences are significant. The challenge for policy makers is to facilitate as smooth an adjustment as possible for all affected.
The most effective and credible policy responses will be those that encourage structural adjustment while at the same time protecting those individuals most vulnerable.
Treasury's wellbeing framework
As a central policy agency, the Treasury is expected to anticipate and analyse these longer-term trends from a whole-of-economy perspective.
In order to do this we need an understanding of wellbeing that recognises that wellbeing is broader than just GDP, that sustainability is more than an environmental issue.
It may come as a surpise to some, but Treasury recognised this a long time ago.
Two early papers addressing these issues are the 1964 Supplement to the Treasury Information Bulletin, entitled The Meaning and Measurement of Economic Growth and the 1973 Treasury Economic Paper Economic Growth: Is it worth having?
Both papers explored the nature of economic growth and its connection to wellbeing, and the latter was written partly in response to the apocalyptic claims of the Limits to Growth study sponsored by the Club of Rome.
A focus on wellbeing and sustainability continue to be important parts of Treasury's culture and identity: they assist in providing context and high level direction for our policy advice; and they facilitate internal and external engagement and communication.
Almost a decade ago we attempted to put more structure around the issue by writing down a wellbeing framework to provide greater guidance to staff on our mission.7
The framework identifies elements of wellbeing which are particularly relevant to our work and which should be considered in providing thorough analysis.
The framework is descriptive, providing a context for public policy analysis and advice that encourages a broad assessment of the costs and benefits of policy proposals.
It acknowledges that in addition to income and (material) consumption, a policy relevant assessment of wellbeing, both at the individual and social level, depends on health, education, social relationships, and a myriad of other aspects of life that people have reason to value.
We have just completed a review of the framework, and updated the framework to address more recent developments in the Department's work. (Chart 10).
The framework is based on five dimensions that directly or indirectly have important implications for wellbeing and are particularly relevant to Treasury. The dimensions are:
- The set of opportunities available to people. This includes not only the level of goods and services that can be consumed, but good health and environmental amenity, leisure and intangibles such as personal and social activities, community participation and political rights and freedoms.
- The distribution of those opportunities across the Australian people. In particular, that all Australians have the opportunity to lead a fulfilling life and participate meaningfully in society.
- The sustainability of those opportunities available over time. In particular, consideration of whether the productive base needed to generate opportunities (the total stock of capital, including human, physical, social and natural assets) is maintained or enhanced for current and future generations.
- The overall level and allocation of risk borne by individuals and the community. This includes a concern for the ability, and inability, of individuals to manage the level and nature of the risks they face.
- The complexity of the choices facing individuals and the community. Our concerns include the costs of dealing with unwanted complexity, the transparency of government and the ability of individuals and the community to make choices and trade-offs that better match their preferences.
The wellbeing framework provides guidance on the key issues Treasury officers should be thinking about in framing policy advice to government. It also serves as an important unifying function for Treasury's policy analysis and advice.
The dimensions do not provide a simple check
list: rather, their consideration provides the broad context for the use of the best available economic and other analytical frameworks, evidence and measures.
Further, the dimensions reinforce our conviction that trade-offs matter deeply - tradeoffs both between and within dimensions. Most reforms will involve trade-offs within or between dimensions of wellbeing. These trade-offs are often complex and multidimensional - but they must be made, and decisions will be better if we're more explicit about what's involved.
Conclusion
In conclusion, Australia is embracing the fact that the global economy is becoming more integrated, with cross border trade between countries increasing, capital markets becoming more interlinked, and greater technological transfers and global competition.
We face long term trends that will lead to even more change and opportunities. But we must also consider whether the path we take is sustainable - not just in terms of government fiscal positions and environmental outcomes but in all we do.
In many respects, sustainability can come from the development and maintenance of reliable markets. The ability to properly price the use of resources and other goods and services over the longer term is vital.
If we get these settings right we will be able to bequeath a stock of capital - the productive base for wellbeing - that is at least as large as the stock we inherited. By doing so, future generations of Australians should enjoy enduring improvements in wellbeing, an outcome which Shann would have endorsed whole-heartedly.
Thank you.
I would like to acknowledge the contribution of my Treasury colleague Shane Johnson in the preparation of this address.
1 See for example Parkinson (2011), Opportunities, Challenges and Implications For Policy, annual post-Budget address to the Australian Business Economists, delivered on 17 May 2011, and Parkinson (2011), Sustaining Growth in Living Standards in the Asian Century, Gala Address to the Melbourne Institute Economic and Social Outlook Conference, delivered on 30 June 2011.
2 See for example, Arrow, K., Dasgupta, P., Goulder, L., Daily, G., Ehrlich, P., Heal, G., Levin, S., Mäler, K-G., Schneider, S., Starrett, D., and Walker, B. (2004) 'Are we consuming too much', The Journal of Economic Perspectives Vol. 18, No. 3 (Summer, 2004), pp. 147-172 and Dasgupta, P. (2007), 'Measuring Sustainable Development: Theory and Application', Asian Development Review, vol. 24, no. 1, pp.1-10.
3 Spence (2011) lists the 13 countries as Botswana (1960-2005), Brazil (1950-1980), China (1961-2005), Hong Kong (1960-1997), Indonesia (1966-1997), Japan (1950-1983), Republic of Korea (1960-2001), Malaysia (1967-1997), Malta (1963-1994), Oman (1960-1999), Singapore (1967-2002), Taiwan (1965-2002), Thailand (1960-1997) in Spence, M (2011), The Next Convergence: The Future of Economic Growth in a Multispeed World, Farrar Straus and Giroux, New York, 2011
4 For example, Spence (2011) highlights potential escalation of structural pressures on the United States economy in response to changes in the comparative advantage of emerging market economies. Spence (2011), 'The Impact of Globalization on Income and Employment', Foreign Affairs 90. 4 (Jul/Aug 2011): 28-41.
5 Newly Industrialising Economies are Singapore, Taiwan, South Korea and Hong Kong.
6 See for example Parkinson (2011), Sustaining Growth in Living Standards in the Asian Century, Gala Address to the Melbourne Institute Economic and Social Outlook Conference, delivered on 30 June 2011.
7 Treasury 2004, 'Policy Advice and Treasury's wellbeing framework', Economic Roundup, Winter, pp 1-20.