Downloads
It is a great pleasure to be asked to speak on the subject of economic policy challenges in 2012 and beyond.1
Economic policy challenges are always in generous supply. Rather than seeking to span the breadth of the subject, in the time available I would like to make a few comments about a couple of the bigger challenges for the future: productivity growth and structural change.
Productivity is a measure of how efficiently an economy is operating. Productivity growth comes about by doing things better today—more efficiently—than we did yesterday.
Today, I want to talk about the economics of productivity growth and what happens below the surface, particularly the importance of competitive forces in driving innovation and improving the allocation of resources.
Looking back at two decades of income growth
Perhaps a good place to start is with the purpose of economic policy. Broadly, economic policy is about improving the wellbeing of the Australian people today, and in the future.2 An aspect of improving wellbeing is lifting material standards of living over time, measured by the amount of income we have available. It is only one aspect, but an important one. Increasing incomes over time means not only that people have the capacity to buy more goods and services. It also means that potentially more tax revenue is available to achieve other public ends, such as providing public health care or improving environmental outcomes.
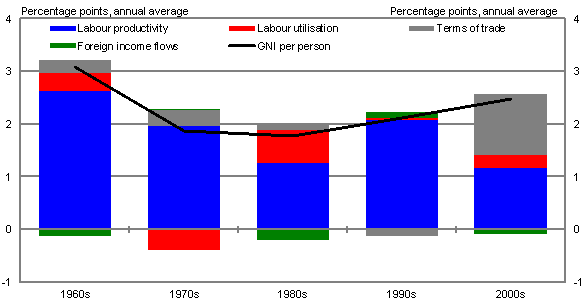
In the past two decades, the Australian economy has delivered strong income growth, though the sources of that growth have changed markedly. Chart 1 shows average annual growth in real gross national income (GNI) per person, which is a measure of the purchasing power of income Australians earn from production, net of income flows to foreign owners of factors of production.
Chart 1: Contributions to growth in average incomes by decade
Note: Data for the 2000s are for the eleven years to 2010-11. The chart is derived from calculations of real GNI, real Gross Domestic Income (GDI) and real Gross Domestic Product (GDP), based on the decomposition in logarithms of (GNI/GDI).(GDI/GDP).(GDP/Hours worked).(Hours worked/Population).
Source: Treasury calculations based on ABS cat. no. 5206.0, 6202.0 and unpublished ABS data.
The economic recovery after the recession of the early 1990s was led by strong productivity growth. Australia, together with the United States and a small number of other countries, saw a resurgence in productivity growth to rates not seen since the 1960s.3
The resurgence was led by service sector industries, like wholesale trade and banking, that seized on new advances in information and communication technology to transform the way they did business (Parham, Roberts and Sun 2001). This was supported by continued productivity growth in industries like telecommunications and electricity, gas and water supply arising from substantial reductions in their workforces following corporatisation and privatisation of their operations, and a reduction in their levels of investment. Productivity levels in these industries rose towards the international technological frontier.
In the past decade or so, the economy has taken a different path. The boom in Australia's terms of trade has lifted the exchange rate, lowering the cost of imported goods and boosting the purchasing power of Australian incomes. This has added 1.2 percentage points per year to growth in average incomes since the turn of the century, in contrast to previous decades when the terms of trade made no significant contribution.
The labour market has also done a more effective job of spreading the benefits of economic growth than it did in the 1990s. Overall, there has been an increase in hours worked per capita, with a sharp rise in the participation rate to the highest level on record more than offsetting a decline in average hours worked, particularly by full-time workers. The boom also has seen a decline both in the average rate of unemployment and in the geographic dispersion of the unemployment rate across the economy (Gruen, 2011).
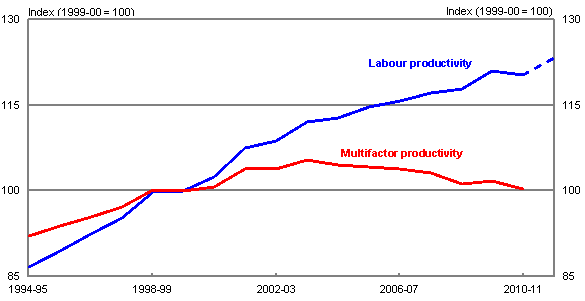
On the other hand, it is now widely recognised that growth in Australian labour productivity—output per hour worked—has slowed since around the turn of the century, notwithstanding stronger data in the past few quarters. Labour productivity growth explained less than half of the growth in average incomes since the turn of the century, compared to an average of around 90 per cent of income growth over the four previous decades.
Multifactor productivity—the output produced from a bundle of labour and capital inputs—has scarcely grown at all this decade (Chart 2). While the deterioration in performance is partly due to unusual developments in mining and utilities, the slowdown from the 1990s is broadly evident across most industries.
Chart 2: Market sector productivity
Note: Data are for 16 market sector industries. 2011-12 labour productivity data are the average of the first three quarters.
Source: ABS cat. no. 5204.0 and 5206.0.
While for households as a group, the mining boom and the higher exchange rate have delivered unambiguously positive benefits in the form of higher average incomes and increased purchasing power, these developments have had a more mixed effect on firms, their owners and the people employed in them.
There has been rapid growth in mining firms, and robust growth in a range of domestic service industries. On the other hand, manufacturers are continuing to come under pressure from competitors in China and other emerging markets, a process that may continue for some considerable time to come.
Some other parts of the economy that depend on household borrowing and spending are also facing pressure as households increase their saving rates to more historically normal levels.4 For some retailers, migration of spending to the internet and away from bricks-and-mortar stores has compounded this weakness. In banking, household demand for loans is growing more slowly following two decades that saw growth rates consistently running ahead of growth in household income. These changes are likely to be enduring.
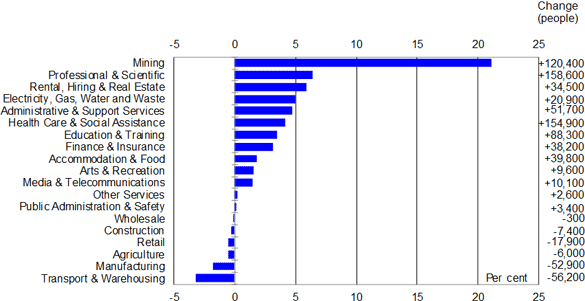
Labour market trends show this bifurcation in growth (Chart 3). Over the three years since May 2009, employment in agriculture, manufacturing, construction, wholesale and retail trade, and transport, postal and warehousing services has fallen by a combined 140,700 people. At the same time, employment in the rest of the economy increased by 733,000 people, with the mining sector alone accounting for 120,400 jobs. Most households that have lost jobs are finding new ones and benefiting from the mining boom.
Chart 3: Employment growth by industry — May 2009 to May 2012
Annual average percentage change
Source: Treasury calculations based on ABS cat. no. 6291.0.55.003.
The flexible exchange rate has contributed to the pressure facing some industries in recent years as part of its role in maintaining macroeconomic stability.
As a shock absorber, it allows the economy to benefit from the increase in demand in one sector without leading to generalised wage and price pressures.5 The significant restraint it imposes on other parts of the economy helps ensure that the economy overall does not overheat.6
In terms of growth in average incomes, however, it is as well to recognise that, in at least two ways, the tail-breezes of the past are becoming the head-winds of the future.
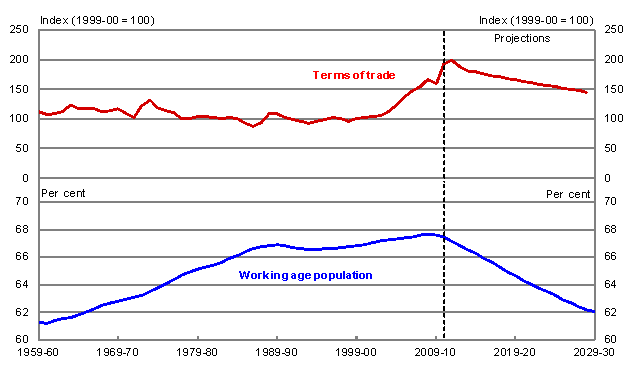
The ageing of the Australian population has added to labour utilisation over the past four decades as the proportion of children in the population has fallen steadily since the baby boom. But Australia's aggregate labour force participation rate has now hit a sweet spot. The same process of ageing will detract from labour force participation in future, and hence also from growth in output per person, as the baby boomer generation moves into retirement. That process is already underway (Chart 4).
Chart 4: Australia's terms of trade and working age population
Note: Working age population is the share of 15 to 64 year olds in the population.
Source: ABS cat. no. 5206.0, 3101.0, 3105.0.65.001, and Treasury projections from the 2012-13 Budget.
The terms of trade have probably also peaked. Output prices in the mining sector rose to extraordinary heights because the surge in demand, led by Chinese growth, surprised the mining industry, which had insufficient capacity in place to meet demand. There is now an enormous pipeline of mining investment. And every year sees more output come on stream, in Australia and abroad. This process will likely see the mining sector continue to expand as a share of the Australian economy for some time, with a commensurate expansion in the volume of mining exports. Our projections imply, however, that while prices will remain elevated compared to historical experience, they are expected to trend lower over time as global supply expands.
So in terms of generating income growth, the ageing of the population and the terms of trade are likely to work against us in future, rather than for us.
Against this background, productivity improvement will again become the dominant determinant of growth in Australian incomes, as it has been for most of our history.
How, then, do we become more productive?
Productivity: evidence from the firm level
The drivers of productivity growth can be separated into two sets of explanations: the resources and capabilities available in the economy; and how those resources are applied by firms in production.
It is widely recognised that governments play an important role in supporting the productive capability of the economy. This includes through investment in education and training, science and research, and infrastructure. Government involvement in these sectors is important. Markets left to their own devices will tend to result in too little investment where there are social or spill-over benefits to the broader community beyond the returns available to a private investor.
However, I want to focus instead on the role of the firm in productivity growth. The decisions made by individual firms in the Australian economy, and the interactions between them, will be a key driver of future productivity growth. Governments influence the environment in which firms engage with each other and make investment and production decisions. They set the rules of the game, if you like, and affect the incentives that firms face, and their flexibility to respond.
Recent international research into the drivers of productivity growth has examined the productivity of individual firms and the movement of resources between them.7 Australian firm dynamics have, to date, been studied to a lesser degree.
The focus on the firm reveals that aggregate productivity grows in a couple of different ways. One source is technical improvement. This is innovation within the firm. It can occur because of the development of new technologies that push out the productivity frontier, or through catch up of firms behind the frontier.
Technical improvement partly comes about through research and development within the firm, or in partnership with the formal research sector. But as a small country, most of the technology put into production in Australia is first developed overseas. Only a small fraction of innovative firms do things that are genuinely new to the world or new to the industry (Chart 5). What usually distinguishes leading organisations is not so much their ability to create knowledge, but rather their ability to absorb technology developed elsewhere and apply it to their own circumstances.
Chart 5: Novelty by type of innovation
Per cent of firms that undertook that type of innovation, 2008-09
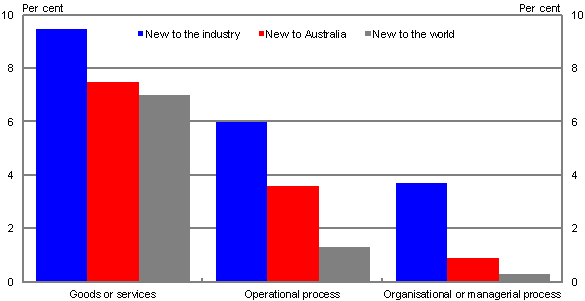
Note: Proportions are for innovating businesses only. Businesses could provide more than one answer.
Source: ABS cat. no. 8158.0.
When firms innovate, the overriding motive is the pursuit of profits. Three-quarters of innovative firms report undertaking innovation to improve profits. Another motive is the firm's position compared to its rivals. Around two-fifths of innovative firms undertook innovation to increase or maintain their market share, and a quarter report needing to develop more competitively priced products (Chart 6).
Chart 6: Drivers of innovation
Per cent of innovative firms, 2008-09
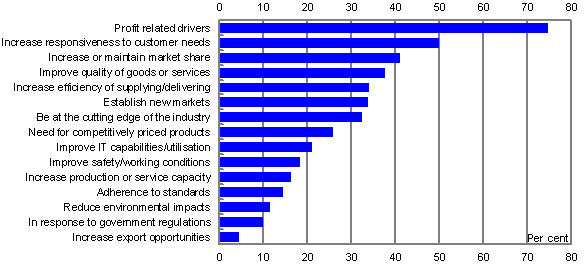
Note: Businesses could identify more than one driver. Profit related drivers include all innovations designed to raise revenue or productivity, or reduce costs.
Source: ABS cat. no. 8158.0.
Productivity also grows because of the reallocation of factors of production from low productivity firms to high productivity firms, the exit of low productivity firms and the entry and maturation of new businesses with bright ideas. Indeed, the dispersion in firm performance is remarkable. Analysis of Australian firms in the 1990s found that labour productivity at the 90th percentile was more than four times the level at the 10th percentile of the distribution (Bland and Will 2001).8 Differences of a similar size have been found in international studies. These differences are likely only partly explained by differences in capital investment: international evidence suggests that in narrowly defined industries the multifactor productivity level at the 90th percentile is typically about twice the level at the 10th percentile of the distribution (Syverson 2004b).
Firm level studies show that, even in periods of robust growth in the economy as a whole, there is considerable turmoil. According to the Australian Bureau of Statistics, around 8 per cent of Australian firms close down every year. Churn is particularly savage in the early years. Around two-fifths of all new firms in Australia exit in less than four years.9
With such large differences in productivity levels and rapid rates of firm turnover it is perhaps not surprising that the movement of resources and
market share between firms from year to year is a significant force contributing to productivity growth. International estimates suggest that the net effect of entry and exit typically accounts for between one-fifth and one-half of labour productivity growth over time.10 In high-technology industries, in particular, start-ups play an important role in promoting technological adoption and experimentation. Policies that act to slow the movement of resources will tend to limit this source of productivity improvement.
Management practices
A complementary approach to understanding productivity at the firm level is to focus on management practices. The idea is that management, like productivity, is all about how well resources are used in production. If management practices can be rated as good or bad, and aggregated to produce an overall management score, then this can provide insight into the sources of productivity differences across firms and across countries.
As it turns out, a major exercise has been underway for some time to collect data on the management practices of more than 9000 medium and large manufacturing firms in 20 countries.11 Management performance is judged based on interviews with plant managers that are designed to reveal the extent to which companies: monitor what goes on inside firms and use this information for continuous improvement; set targets and track outcomes; and promote and reward employees based on performance.
Based on this methodology, management practices in Australia are mid-range. We are well below top performers like the United States, Germany, Sweden, Japan and Canada, but more similar to France, Italy and the United Kingdom (Chart 7).
Chart 7: Average management performance in manufacturing
(Scale 1 = worst, 5 = best)
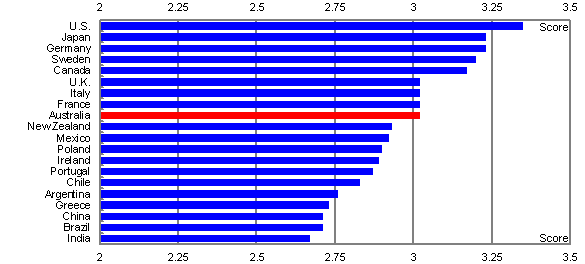
Source: Table 2 of Bloom, Genakos, Sadun and van Reenen (2012).
There is also significant variation in management performance within countries. Australia, like some other countries, has a somewhat larger tail of companies with relatively poor management performance than the United States (Chart 8).
Chart 8: Distribution of management performance
(Scale 1 = worst, 5 = best)
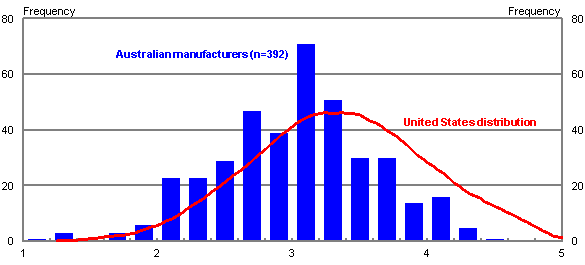
Note: The United States distribution is an Epanechnikov kernel density based on 1225 firms, scaled to be comparable to the sample of 392 Australian firms.
Source: World Management Survey combined 2004-2010 dataset, http://worldmanagementsurvey.org.
What is particularly fascinating about these studies is what they show about the determinants of good and bad management practices across Australian firms (Green 2009). One of the key findings is that size matters: large companies tend to be much better managed than small ones. This may be important for Australia because, while the international survey considered only firms employing 100 or more workers, Australian manufacturing has a larger proportion of very small firms, with fewer than 20 employees, than almost all other OECD countries (OECD 2011). Ownership arrangements are also important: multinationals tend to implement strong management practices; publicly-listed companies perform well; but family-run businesses tend to exhibit inferior management performance. The level of education and skills of both managers and non-managers is positively correlated with management performance.
Moreover, the differences in management practices appear to matter for productivity levels: better managed firms are more innovative and have higher productivity. Regression analysis suggests that lifting management practices in Australian manufacturing firms to the average level in the US would raise the level of productivity in Australian manufacturing by around 8 per cent (Bloom, Genakos, Sadun, and van Reenen 2012).12
Structural change and productivity growth
Periods of structural change are often also periods of growth and reform for the economy as a whole.
Pressure on profitability can provide a strong impetus for rethinking business models. For a firm that has been doing the same thing for a long time, changes in business models are risky and difficult. They may need new contacts, new capital or new marketing; they may need to lay off long-time workers and hire workers with different skills; they will need to move up new learning curves. Changeover can be costly and disruptive to operations, and often it is difficult to know whether a new business model will work until it has been trialled. However, when doing the same old thing is likely to be unprofitable, the opportunity cost of transforming work practices is substantially lowered (Holmes and Schmitz 2010).
Firm level data highlight the strong role that these sorts of competitive forces play in driving productivity growth. Innovative activity is generally found to have a positive relationship with competition.13 In Australia, firms that report having more competitors, that have lower price-cost margins, that export, or that report downward pressure on profit margins are more likely to be innovators (Soames, Brunker and Talgaswatta 2011).14 In Europe, the removal of product-specific quotas following China's entry into the World Trade Organization was accompanied by an increase in research and development, patenting and productivity (Bloom, Draca and van Reenen 2011). International evidence also shows that firms that report that they face more competitors on average report better management practices (Bloom and van Reenen 2010).
Case studies show that firms that succeed during these sorts of upheavals do so by pursuing new work practices (Productivity Commission 1999). For example, many parts of Australian manufacturing were put under increased competitive pressure by cuts in tariffs, which were particularly rapid between the mid-1980s and late 1990s. While there were a range of responses, all industries focused on transforming their work practices to succeed in the new business environment. In whitegoods manufacturing, there were mergers and takeovers, plants became more specialised, and world best technology was introduced as managers sought to reduce inefficiencies and find cost savings in order to compete aggressively for market share. In the automotive industry, a reduction in the number of models and closure of some plants provided significant improvements in scale economies. In textile, clothing and footwear manufacturing the response was more diverse. Parts of the industry introduced labour-saving computerised machinery and targeted higher value niche products with strong brand-name identification, while other firms ceased operating.15
Case studies in retail also show the role competition plays in driving the take up of new technology. In the United States, the arrival of Walmart in a region has a profound effect on other retailers. Successful retailers survive by improving their quality of service, such as through investment in computers to track inventories and reduce significantly the frequency of stock run outs (Matsa 2011).
Of course, some firms will close down and leave the industry. This is one of the ways that competition works: it boosts productivity by moving resources to more successful firms. Firm level data show that average productivity in larger, more competitive
markets tends to be higher because there is a smaller tail of low productivity firms (Syverson 2004a). Strong product market competition also boosts average management practices by truncating the tail of poorly managed firms. Indeed, one reason why U.S. firms tend to have higher management scores than firms in other countries is that in the U.S. economy better-managed firms appear to grow more quickly, while worse-managed firms shrink and exit (Bloom and van Reenen 2010).
Conclusion
The gains in Australian living standards of the past decade were more easily achieved than in the 1990s, but they were achieved in ways that cannot be replicated. The gains of the next decade will rely overwhelmingly on improvements in productivity.
Central to Australia's economic policy challenges is returning the economy to a strong productivity growth trajectory. Governments can play a number of roles to facilitate improvements in productivity, including through their support for education, science and infrastructure, and the provision of appropriate regulatory regimes. The efficiency with which government services are delivered will also be important. However, it is largely the decisions made by individual firms in the Australian economy, and the interactions between them, that will drive productivity growth over coming decades. Part of the challenge is to allow the pressure currently facing firms in many parts of the economy, due to the high exchange rate and other forces, to encourage the take up of new technologies and work practices, and to allow resources to move to more productive uses.
A healthy economy allows experimentation by small start-ups with bright ideas, which may tend to have low productivity on average but which are likely to either exit, or improve and grow rapidly over time. It sees labour move over time towards higher productivity firms as they gain market share and away from lower productivity firms. Artificially high barriers to entry or exit result in a lower rate of firm turnover, as poor performing firms remain in business for longer, and more efficient firms find it harder to attract the workers they need to grow.
But it is as well to recognise that, as well as providing benefits, structural change also brings costs for households. The flipside of the ability of successful firms to expand is the extent to which unsuccessful firms shrink, releasing their labour for use in more productive activities. Since job creation goes hand in hand with job destruction, workers as a group are not necessarily better off with low churn rates, but not all displaced workers transition smoothly into new jobs. For both social and efficiency reasons, governments have a role to play in supporting people to adjust and re-enter employment. Of course, this process is a much more humane one when the overall unemployment rate in the economy is low.
These challenges are similar to those the Australian economy has faced before. The broad sweep of economic reforms beginning with the reduction in tariffs in the 1970s brought greater product market competition, labour market flexibility, macroeconomic stability and financial market efficiency. These reforms played an important role in bringing about the reorganisation of production and work practices to enable firms to reduce costs and take advantage of developments in technology, thereby enhancing productivity growth in the 1990s (Productivity Commission 2005; Parham 2004). In part they succeeded by challenging old work practices and rewarding firms that developed new business models.
References
Aghion, P., Bloom., N., Blundell, R., Griffith, R. and Howitt, P. 2005, 'Competition and innovation: an inverted U-shaped relationship', Quarterly Journal of Economics, May 2005, vol 120, no 2, pp 701-28.
Bartelsman, E. and Doms, M. 2000, 'Understanding productivity: lessons from longitudinal microdata', Journal of Economic Literature, vol 38, pp 569-94.
Bartelsman, E., Haltiwanger, J. and Scarpetta, S. 2009, 'Measuring and analyzing cross-country differences in firm dynamics' in Dunne, T., Jensen, B. and Roberts, M. (eds) Producer Dynamics: New Evidence from Micro Data, NBER, Cambridge, Massachusetts.
Bland, S. and Will, L. 2001, 'Resource movements and labour productivity, an Australian Illustration: 1994–95 to 1997–98', Productivity Commission Staff Research Paper, AusInfo, Canberra.
Bloom, N., Draca, M. and van Reenen, J. 2011, 'Trade induced technical change? The impact of Chinese imports on innovation, IT and productivity', National Bureau of Economic Research Working Papers, no 16717.
Bloom, N. and van Reenen, J, 2010, 'Why do management practices differ across firms and countries', Journal of Economic Perspectives, vol 24, no 1, pp 203-24.
Bloom, N., Genakos, C., Sadun, R. and van Reenen, J. 2012, 'Management practices across firms and countries', National Bureau of Economic Research Working Papers, no 17850.
Breunig, R. and Wong, M. 2007, 'The role of firm dynamics in Australia's productivity growth', Australian Economic Review, vol 40, no 1, pp 90-96.
Breunig, R. and Wong, M. 2008, 'A richer understanding of Australia's productivity performance in the 1990s: improved estimates based upon firm-level panel data', Economic Record, vol 84, no 265, pp 157-76.
Green, R. 2009, Management matters in Australia: just how productive are we?, report commissioned by the Department of Innovation, Industry, Science and Research.
Gruen, D. 2011, 'The macroeconomic and structural implications of a once-in-a-lifetime boom in the terms of trade', Address to the Australian Business Economists Annual Conference, 24 November.
Holmes, T. and Schmitz, J. 2010, 'Competition and productivity: a review of evidence', Staff Report no 439, Federal Reserve Bank of Minneapolis.
Matsa, D. 2011, 'Competition and product quality in the supermarket industry', Quarterly Journal of Economics, vol 126, pp 1539–1591.
OECD 2011, 'Factbook 2011: Economic, Environmental and Social Statistics'.
Parham, D., Roberts, P. and Sun, H. 2001. 'Information technology and Australia's productivity surge', Productivity Commission Staff Research Paper, AusInfo, Canberra.
Parham, D. 2004, 'Sources of Australia's productivity revival', Economic Record, vol 80, no 249, pp 239-57.
Parkinson, M. 2011, 'Sustainable wellbeing—an economic future for Australia', Shann Memorial Lecture Series, Perth, 23 August.
Productivity Commission 1999, 'Microeconomic reform and Australian productivity: exploring the links', Research Paper, AusInfo, Canberra
Productivity Commission 2005, Review of National Competition Policy Reforms, Report no. 33, Canberra.
Soames, L., Brunker, D., and Talgaswatta, T., 2011, 'Competition, innovation and productivity in Australian businesses', Productivity Commission and Australian Bureau of Statistics joint research paper.
Stevens, G. 2012, 'The glass half full', Address to the American Chamber of Commerce (South Australia) AMCHAM Internode Business Lunch.
Syverson, C. 2004a, 'Market structure and productivity: a concrete example', Journal of Political Economy, December 2004, vol 112, no 6, pp 1181-1222.
Syverson, C. 2004b, 'Product substitutability and productivity dispersion', Review of Economics and Statistics, vol 86, no 2, pp 534-50.
Syverson, C. 2011, 'What determines productivity?', Journal of Economic Literature, June 2011, vol 49, no 2, pp 326-65.
1 Address by the second author to the 41
st Australian Conference of Economists, 10 July 2012, Victoria University, Melbourne. We thank Spiro Premetis for his valuable assistance with the preparation of this speech, and Jenny Allen, Graeme Davis, Nicholas Gruen, Rob Heferen, James Kelly, Jyoti Rahman and Angela Woo for helpful comments on an earlier draft.
2 Treasury has long recognised that wellbeing is broader than material standards of living and has developed a wellbeing framework to provide guidance on the key issues relevant to the framing of policy advice to government. This includes consideration of the opportunities available to people and their distribution and sustainability over time, as well as the risks borne by, and the complexity of choices facing, individuals and the community (Parkinson 2011).
3 Parham (2004) provides a comprehensive review of the sources of Australia's strong productivity growth in the 1990s.
4 This follows a period in which rapidly rising house and share prices supported stronger growth in consumption than in household disposable income, which ended around the time of the global financial crisis (Stevens 2012).
5 The lower volatility of economic growth and the absence of a general wage and price break-out distinguishes sharply the current terms of trade boom from that of the 1970s, which occurred under a fixed exchange rate regime. This is despite the current boom resulting in a 50 per cent larger movement in the terms of trade and having already lasted more than four times longer (Gruen, 2011).
6 A few commentators, including a prominent business organisation, have suggested that Australia is becoming a high cost place to do business – an observation based on comparing the cost of doing a range of economic activities in Australia and in other advanced economies, when converted into a common currency. It is as well to recognise, however, that to the extent this is a consequence of the appropriate role played by the exchange rate, it helps ensure domestic macroeconomic stability. With one part of the economy running red hot, the appreciation of the exchange rate raises domestic costs, measured in foreign currency terms, reducing the capacity of a range of domestic firms to compete with foreign competitors.
7 Recent reviews include Syverson (2011) and Bartelsman and Doms (2000).
8 Bland and Will's (2001) sample includes firms in manufacturing, construction, wholesale trade, retail trade,
accommodation, cafes and restaurants, and property and business services. They estimate that in 1994-95 average value added per worker at the 90th percentile was $84,000 compared with $17,800 at the 10th percentile.
9 Firm exits are measured based on the cancellation of Australian Business Numbers or firms ceasing to remit Business Activity Statements showing positive amounts for five consecutive quarters. As such, firm exit does not necessarily imply firm failure, but could be due to sale of the business or a change in the structure of the business, such as through a merger. The estimates presented relate to employing businesses; turnover of sole proprietorships and partnerships without employees is significantly higher.
10 International evidence is summarised in Bartelsman, Haltiwanger and Scarpetta (2009). Australian studies based on the 1994-95 to 1997-98 Business Longitudinal Survey (BLS) have found differing results. In accounting for industry multifactor productivity growth, Breunig and Wong (2008) showed that market share reallocation between firms almost always made an important positive contribution. The unweighted average contribution across the 23 industries they analysed was around 2 percentage points over the three year period. By contrast, considering labour productivity, Bland and Will (2001) found that net entry of firms contributed only around 0.1 percentage points over the three year period. Both studies note that, for a range of reasons, the BLS sample was not representative of the Australian economy.
11 International results are summarised in Bloom, Genakos, Sadun and van Reenen (2012). Detailed results from the Australian component of the study are in Green (2009).
12 This calculation is based on a firm level regression of sales on management scores, capital and number of employees as reported in column 3, table 3 of Bloom, Genakos, Sadun, and van Reenen (2012).
13 Soames, Brunker and Talgaswatta (2011) provide a review of the literature, including Australian studies. While a positive relationship between competition and innovation is generally found, the relationship may be more complex. For example, Aghion, Bloom, Blundell, Griffith and Howitt (2005) find that above a certain level, more competition is eventually associated with diminishing levels of innovation.
14 By contrast, Soames, Brunker and Tagaswatta (2011) find, consistent with earlier analysis by Breunig and Wong (2007), that increasing market share is positively correlated with innovation. They argue that market share is a poor indicator of competition, however, due to endogeneity with firm size and innovation.
15 Notably, the timing and speed of industry responses mirrored the pattern of reductions in industry protection, with earlier and faster transformations in whitegoods manufacturing, where reductions in protection began in the late 1970s, whereas significant reductions in protection did not come until 1988 for automotive and until 1989 for TCF and were implemented more gradually (Productivity Commission 1999).