Downloads
I would like to acknowledge the assistance of Leigh Soding and Deepika Patwardhan in preparing this address.
Introduction
Thank you for the opportunity to be here today.
As you know better than I, AmCham is the largest chamber of commerce in Australia. It is an organisation that has promoted trade and investment between Australia and the United States since 1961.
In that time, the global economy has undergone significant transformation — a transformation that is continuing today, but in an even more profound way than at any time in the last century.
Geo-strategic and geo-economic weight is moving from the Western advanced economies towards the emerging market economies.
Change is not unexpected. The world around us is dynamic in nature – but it is the magnitude and pace of the current change that is so noteworthy.
And with profound change comes major opportunities and challenges.
Looking back on this era, I expect we will see that successful economies were those able to anticipate and prepare for the challenges and which pursued policies that focussed on their people's long run interests, not short-term gain.
Before I venture into these challenges for policy, let me first set the scene.
The global economy is heading down a windy road, with twists and turns ahead that we can't predict. Post-GFC, it was expected that the global economy would recover at a modest pace as the financial excesses were worked out of national, business and household balance sheets.
However, we have seen events occur that threaten to derail this recovery. The unfolding saga of the European sovereign debt crisis sees events change on a daily (if not hourly) basis. It's not just events in Europe either, with the unprecedented downgrade by Standard & Poor's of their US sovereign credit rating in August providing yet another twist.
The proximate causes of the current situation in Europe are well known:
- unsustainable sovereign debt positions among some euro area economies ultimately reflect poor growth experience and an imbalance between revenue and expenditure, and thus suggest a need to pursue competitiveness-enhancing structural reforms and tax and transfer policies more congruent with underlying competitiveness;
- policy responses that are inadequate given the scale of the debt and related financial sector vulnerability, raising the fear of contagion throughout the European banking system;
- an ongoing fear that political institutions are incapable of implementing concrete and credible responses; and
- a growing recognition that the recoveries in both the US and Europe will be weaker than previously expected, making it even harder to work down already excessive debt levels.
Uncertainty and risk aversion associated with global growth concerns and the European sovereign debt crisis have gripped financial markets. Volatility has become the new norm.
The euro area leaders' summit finally made some much-needed announcements on 27 October.
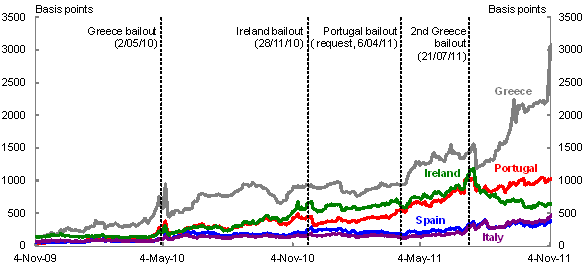
While markets initially reacted positively to these measures, notwithstanding the absence of detail, this was very short lived. Political developments in Greece and Italy in the last 10 days have further undermined confidence in the commitment of governments to deal with the underlying problems – until commitments are seen as clear and credible Europe will remain a source of market volatility. (Chart 1)
Chart 1: Euro area sovereign debt spreads
Source: Thomson Reuters.
Across the Atlantic, growth in the United States weakened significantly in the first half of 2011. While it has strengthened somewhat since, the US recovery remains vulnerable to external shocks such as a re-intensification of the European sovereign debt crisis.
In the longer-term we can have confidence that the US economic system will drive the innovation and investment needed to spur competitiveness and growth. The question is whether the US political system can mobilise itself to address its medium-term fiscal challenges. In this context, the deliberations of the so-called 'Supercommittee' on deficit reduction will be crucial.
While both Europe and the US face fiscal challenges there are some crucial differences. Critically, the US has its own currency and monetary policy and a fiscal union. With the US 10-year Treasury yield around a 60-year low there is also no pressure from the market to force political action, and political compromise, on a substantive medium-term fiscal consolidation in the near-term.
However, until such a plan is agreed and legislated the US will remain at risk of sudden shifts in market sentiment, as Italy has discovered in recent months.
The Rise of Asia
With economic commentary focused on the short term and the North Atlantic, it can be easy to overlook the bigger picture. As I mentioned, we are in the midst of a once in a century global economic transformation. And it is occurring right on Australia's doorstep. The most obvious manifestation is the rapid growth of China and India, but also increasingly of Indonesia and Vietnam.
It is this dramatic transformation that has led to the preparation of the Government White Paper on Australia in the Asian Century, with work being led by my predecessor Dr Ken Henry.
But transformation does not end at Asia's edge. We see a similar story developing in other emerging economies. For example, a young population and improvements in human capital will likely contribute to an expected doubling in South Africa's GDP in the next twenty years and Nigeria is expected to increase three-fold to displace South Africa as the continent's largest economy by the late 2020s. Latin America also continues to surge forward with Brazil and Chile leading the way — with both expected to double in size by 2030.
Returning to Asia, despite rapid growth in living standards, China and India remain at the early stages of their economic development. Even today, China's GDP per capita is only around that experienced by Japan in the early 1960s and by Australia prior to the 1950s. As Chart 2 shows, there remains a long way to go to catch up to other countries in our region. (Chart 2)
Chart 2: GDP per capita - per cent of OECD-15
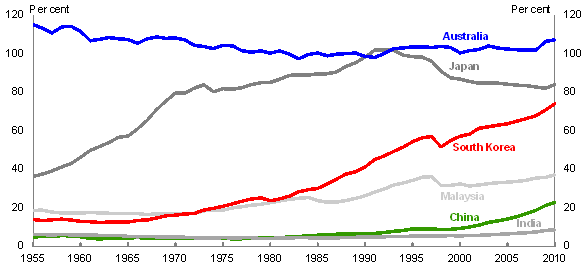
Note: OECD-15: Australia, Austria, Belgium, Denmark, Finland, France, Iceland, Ireland, Netherlands, Norway, Sweden, Switzerland, UK, US and Canada.
Source: The Conference Board Total Economy Database and Treasury.
And as I have said elsewhere1, future economic success is not pre-ordained. But assuming broad trends continue, a major socioeconomic implication of this growth is that China and India's cities will be populated by an increasingly wealthy and mobile middle class in the decades ahead.
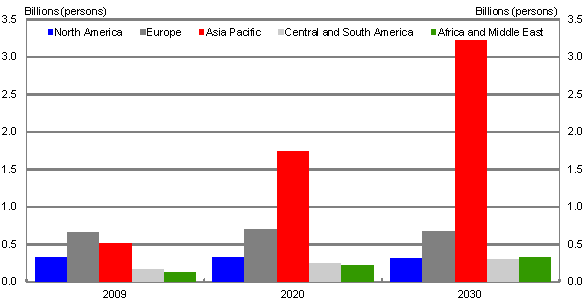
On some projections, there will be 1.7 billion middle class consumers in the Asia Pacific region by 2020 — more than the rest of the world combined. (Chart 3)
Chart 3: Projections of the global middle class by region
Source: Kharas, H and Gertz G, 2010, 'The New Global Middle Class: A Cross-Over from West to East' in C Li (ed), China's Emerging Middle Class: Beyond Economic Transformation, Washington, DC, Brookings Institution Press.
At that time (2020) China will be the single-largest middle class market in the world in doll
ar terms.
Rising incomes will see changing food consumption patterns, and increased demand for luxury and durable consumer goods, and services such as international travel and tertiary education — features of consumption patterns in developed economies. This opens new opportunities for Australia.
However, there lie many challenges to overcome in these emerging giants, including market and governance reform and creating enough jobs for the rapidly changing workforce.
Though we typically focus attention on China and India, the rise of Indonesia also carries implications for Australia — I wonder how many of us realise Indonesia's economy overtook Australia's in size in 2005 (in purchasing power parity terms).
Structural adjustment
With significant changes in the makeup of the global economy come significant pressures on the structure of the Australian economy. This is not entirely surprising for a relatively small open economy. And while adjustment is challenging, some of the changes should be considered more an acceleration of ongoing trends than a new phenomenon.
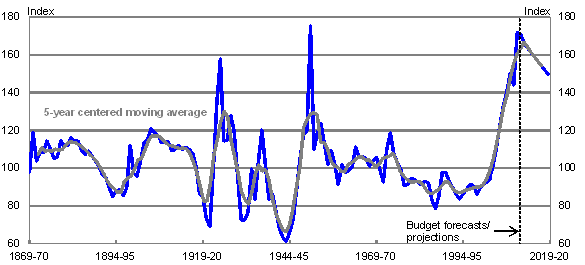
The first wave of impacts from the “Asian century” is a familiar story now – a once in a generation demand for our mineral and energy resources has manifested in an historically high level for the terms of trade. (Chart 4)
Chart 4: Australia's terms of trade
Source: ABS Catalogue Number 5206.0 and Treasury.
While the terms of trade are likely to remain well above historical averages, as the supply of resources catches up with demand, we expect the terms of trade to gradually decline.
Reflecting the terms of trade surge though, our exchange rate both in nominal and real terms is setting new post-float records and, in turn, having a profound impact on our traded-goods sector.
While businesses have developed experience in managing short-term fluctuations in the exchange rate, we have seen evidence recently that existing business models can be easily threatened when the exchange rate remains persistently high – a situation we are likely to confront for a long time yet.
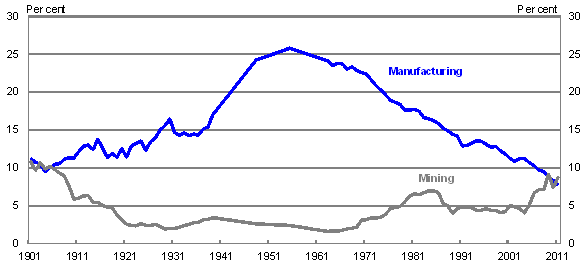
The shift in economic activity towards mining and mining-related sectors, and the service sectors more generally, is part of a longer-term trend away from parts of traditional manufacturing which began in the middle of the 20th century.
This structural evolution of the Australian economy reflects a prolonged shift in our comparative advantage. (Chart 5) But this is not just something endemic to Australia. Our evolution towards a more service oriented economy is common to the economic development of all advanced economies, including those in Asia.
Chart 5: Industry shares of output
Source: Economic Roundup Centenary Edition (2001), ABS Catalogue Number 5204.0 and RBA Australian Economic Statistics.
Where Australia is different is the growth in the size of our mining sector, not in the decline in our manufacturing sector.
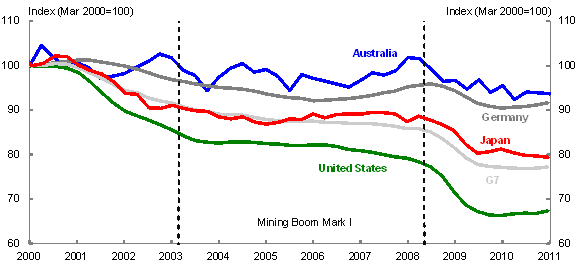
Though it may be a surprise to some, employment in manufacturing in Australia has generally fared better than in the major advanced economies over the last decade or so.
Relative to the start of the last decade, Australia has recorded a smaller decline than the G7 average and the change is roughly similar to that seen in German manufacturing employment 2. (Chart 6)
Chart 6: Manufacturing employment
Note: Index of absolute level of manufacturing employment.
Source: Thomson Reuters EcoWin and Treasury.
Striking is the trend in the US — one explanation may be emerging markets shifting into higher value manufacturing such as IT and telecommunications, placing pressure on a long-held comparative advantage by the US.
Overall, this highlights that in a changing world other advanced economies are experiencing similar adjustments to the structure of their economies, part of which is explained by the long-term trend towards services as they mature but also the impact large emerging economies are having on global supply chains.
It also highlights that comparative advantage is not a static concept. Rather comparative advantage shifts, and those countries that are flexible and responsive to change will be those best placed to maximise the resulting opportunities.
While the structural adjustment story tends to focus on the adverse impacts, it is also important for policymakers to highlight the benefits from a changing economy.
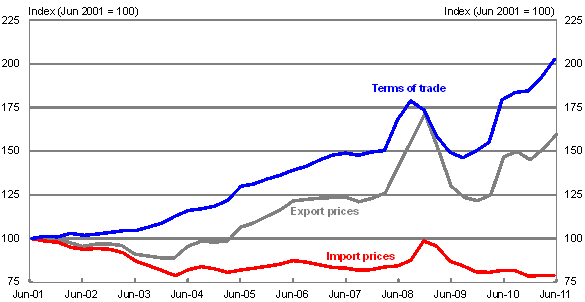
The high exchange rate, while impacting our non-resource traded sectors, is boosting living standards through cheaper imported consumer goods and assists in placing downward pressure on inflation with obvious benefits for interest rates. (Chart 7) The flexible exchange rate, therefore, is one way the benefits of the resource boom are spread across the economy.
Chart 7: Terms of trade showing export and import prices
Note: Export and import price indices are denominated in Australian dollars and will reflect movements in the nominal exchange rate.
Source: ABS cat. no. 5302.0 and Treasury.
There are two complementary forces that explain the decline in import prices in local currency terms — the global price of manufactures has fallen while the appreciating exchange rate as a result of the resources boom has made such goods even cheaper.
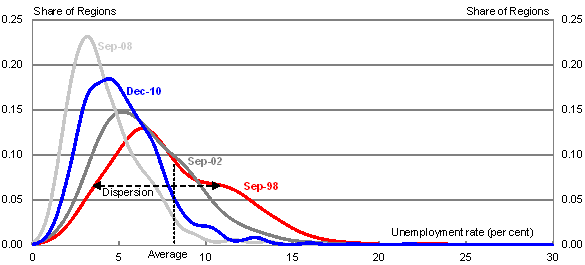
We can also see the benefits of the resources boom being spread across the economy through improved labour market outcomes. (Chart 8)
Chart 8: Regional distribution of unemployment
Note: Statistical Local Areas (SLAs) are standard small geographic regions in Australia. There are around 1,400 SLAs under current classifications. As the size of the labour force for SLAs varies from less than 100 to around 100,000, figures in the chart use employment outcomes weighted by labour force size. Regional distributions are smoothed using Gaussian kernel density estimation. For presentational clarity, distributions are over-smoothed with windows of 1, 1, ½ and ½ selected for Sep-1998, Sep-2002, Sep-2008 and Dec-2010.
Source: DEEWR Small Area Labour Market database and Treasury.
For example, across the labour market, there is evidence that, despite the geographic concentration of the mining sector, the dispersion of unemployment across regions has actually narrowed in recent years. (Chart 9)
Chart 9: Unemployment across the economy
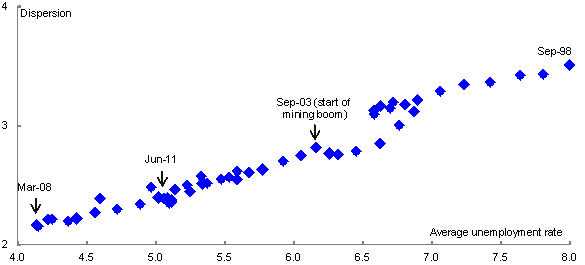
Note: Each point on the scatter plot represents the weighted average and weighted standard deviation of regional unemployment for a particular quarter between Sep-1998 and Jun-2011. The weighted average unemployment rates for all SLAs differ slightly from those estimated in ABS 6202.0.
Source: DEEWR Small Area Labour Market database and Treasury.
Changes in technology have also played a ro
le in helping disperse the benefits of the current mining boom. The increasing accessibility and cheaper cost of air travel has seen a proliferation of fly-in fly-out commuting arrangements between mining sites and cities. 3 This has enabled the incomes earned in the sector to be spent in areas which do not have an immediate exposure to the mining boom.
In mining booms of the past, people would relocate to the mining sites creating towns and communities in the process but then these settlements would be hit severely when the boom ended and the lifeblood of the area disappeared.
Nowadays, airlines are opening up new routes to regional mining centres.4 (Table) Arguably, such arrangements may also alleviate some of the difficulty for families to relocate to the other side of the country to work in the mining sector, although they also create issues of their own when it comes to the capacity of small towns to support major mining developments.
Table: Domestic air traffic
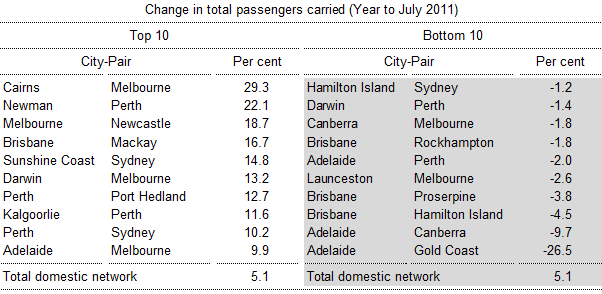
Note: Change between year-ending data to July 2011 and year-ending data to July 2010. Passenger movements for a city-pair reflect total traffic in both directions. Perth - Port Hedland route data only from August 2009.
Source: Domestic Airline Activity, July 2011, Bureau of Infrastructure, Transport and Regional Economics.
Over the year to July 2011, the ten fastest growing routes were predominantly those involving key mining centres while those to tourist destinations experienced the largest declines.
Policy challenges
Globally, the current environment is laden with risk, but also with opportunity.
Flexibility has been the cornerstone of Australia's success in avoiding the mistakes of earlier booms. The flexibility of the AUD, the independence of the Reserve Bank, a strong medium term fiscal framework, a strong and well-regulated financial sector, a flexible labour market and an ongoing structural reform agenda — all have assisted Australia in managing the domestic impacts of external volatility.
However, we cannot stand still.
Given the potential opportunities for our economy arising from the 'Asian century' it is important that policymakers make the right decisions for the long term.
We need to continue policy settings that enhance the flexibility of the economy and improve productivity in a sustainable way.
Fiscal consolidation and efforts to boost public saving will allow for a considerable pipeline of mining investment to be accommodated in an economy close to full capacity. In addition, such actions help to create a policy buffer to deal with an uncertain global environment, both now and in the future.
We also need to ensure the entire community benefits from the once-in-a-generation mining boom. We are, after all, selling a non-renewable resource. If we don't use some of the returns to invest in other forms of capital – human, physical and financial – then we risk reducing the value of our national balance sheet in order to support current consumption.
To be clear, it is important that we don't consume all the benefits today — such actions have characterised previous mining booms. So we need to not only ensure society gets an adequate return from these resources but also that it's used to build alternative forms of capital.
One proposal that has been generating considerable attention — including at the recent Tax Forum — has been for Australia to set up a resource-related sovereign wealth fund.
Arguments for sovereign wealth funds are typically couched in terms of one of three broad objectives:
- revenue stabilisation — shielding the budget from revenue volatility caused by swings in commodity prices;
- intergenerational equity — smoothing consumption and/or saving for the future, and imposing discipline on current government expenditure ; and
- limiting the extent of exchange rate appreciation.
These are well intentioned and thought-out objectives, and sovereign wealth funds form part of the fiscal frameworks adopted by resource-rich countries such as Chile and Norway.
For example, under the Norwegian system — which is focused towards long-term savings — all petroleum revenues are paid into a sovereign wealth fund, with spending out of the fund limited to the estimated long-run rate of return on the accumulated funds. In contrast the Chilean system — which is focused towards stabilisation — ensures revenues from above-equilibrium copper prices are saved in the sovereign wealth fund, which can be drawn down when prices fall below equilibrium.5
The different objectives and aims of the Norwegian and Chilean funds highlight the need for each country to approach the management of their resources endowments based on their own individual circumstances.
Just like Norway and Chile, our circumstances are unique — we need to look at our own economy and at the frameworks we already have in place.
It is worth noting that technically Australia already has a sovereign wealth fund in the Future Fund, set up in 2006 to deal with unfunded Commonwealth superannuation liabilities, which has around two thirds of its assets invested offshore.
Further, Australia's compulsory superannuation system replicates some, though not all, of the elements of a long-term savings sovereign wealth fund. Established around 25 years ago initially under the Accord wage-setting process, it has transformed the saving and retirement income landscape in Australia.
Such is the size of the system that with total superannuation assets standing at around $1.3 trillion as at the end of 2010, or roughly the same size of the Australian economy, they are not that much smaller than Norway's sovereign wealth fund relative to the size of its economy.
Similar to the role of a sovereign wealth fund like that in Norway, this stock of financial assets is continuously being built up, managed at arm's-length from government and, given the tax treatment of superannuation savings and government co-contributions, there is a contribution from the annual budget into Australian's individual retirement savings accounts.
Also similar to a sovereign wealth fund, saving through superannuation can ensure that more of the increased income being spread throughout the economy from Australia's resources is invested over a long period of time — rather than being consumed immediately — providing an enduring benefit even if increased incomes and resource revenues prove to be temporary.
So what is driving the calls for Australia to adopt a sovereign wealth fund?
While well-motivated intentions lie behind the calls for a sovereign wealth fund, closer examination suggests different commentators are actually seeking to achieve markedly different outcomes.
Some, for example, are trying to achieve a greater share of the returns from the mining boom going to society via a broad sovereign wealth fund. Others want these returns to be held and used in ways that increase investments in human and physical capital over decades — hypothecated wealth or endowment funds. That is, long term savings or sustainability roles.
And occasionally, it is suggested the sovereign wealth fund should be held offshore to ease pressure on the exchange rate and on the non-mining sectors of the economy.
So let's consider a couple of these issues in the Australian context.
Long-term savings and sustainability
As Norway has demonstrated, a sovereign wealth fund can be effective in helping to achieve long-term savings and sustainability. The sustainability approach behind Norway's sovereign w
ealth fund involves building up a stock of financial assets over an extended period of time, and then using the earnings from these financial assets to supplement the annual budget, while preserving the principal value of the fund for the long term. In building up this fund, Norway has converted some of the revenue from the sale of its oil into a stock of financial assets.
Importantly, Norway is able to receive an appropriate return from the extraction of its natural resources that is sufficient for it to ensure that these non-renewable resources are able to provide income for generations into the future.
So the issue is not so much the existence of the sovereign wealth fund per se as an appropriate sharing of the returns from its resources and a commitment to long-term income smoothing.
Exchange rate sterilisation
Can a sovereign wealth fund materially limit the resulting exchange rate appreciation from the mining boom by investing in foreign assets?
Firstly, it is important to note that the exchange rate is an important agent in the longer-term structural adjustment process. That allows us to benefit from this once in a century increase to our national wealth. In seeking to artificially adjust the level of the exchange rate, we would, in effect, be aiming to undo such structural adjustment — potentially holding us back from benefiting from this higher wealth. Further, as I highlighted earlier, the appreciation in the exchange rate is important in spreading the gains from the boom across the economy.
However, if we still wanted to limit the appreciation in the dollar, could we?
The Australian dollar is a considerable player in the global monetary system — we have the fifth most traded currency in the world. One way of gauging the underlying demand for Australian dollars is the sum of our current account receipts and gross financial inflows — this amounted to around $445 billion in 2010-11.6
Investing surpluses of, say, 1 per cent of GDP in foreign assets would amount to around $14 billion per year in current dollars.
Therefore, it is unlikely that purely investing in foreign assets alone would have any lasting significant impact on the exchange rate.
Sovereign wealth funds and fiscal policy
A key point to note about sovereign wealth funds is that the issue is not just about the establishment of a fund per se — a sovereign wealth fund is just like a bank account — but its combination with different fiscal strategies.
The act of paying down net debt out of future surpluses is identical to accumulating financial assets in a sovereign wealth fund. It has the same effect on the government's balance sheet and the level of public saving.
Efforts to reduce government net debt should be the immediate focus – whether this is done by reducing gross debt on issue, or maintaining gross debt but building up financial assets, in a sovereign wealth fund, is an important but second order issue.
Credible medium-term fiscal strategy can effectively guide budget policy outside of mining boom conditions. Accompanied by a firm understanding of how a mining boom is impacting on revenue, including ensuring an appropriate return from the extraction of these resources, such strategies can perform a similar role in the current environment.
I am not suggesting that a sovereign wealth fund is not without merit, just that we should be clear about the role that it can and should play.
Given the time that will be required to reduce net debt, we have time to consider further the merits of a sovereign wealth fund – our first priority needs to remain fiscal consolidation.
Conclusion
In conclusion, we are living in a rapidly changing and complex world. This presents enormous challenges and opportunities for all advanced economies. Traditional spheres of influence will undoubtedly shrink, but at the same time new opportunities and markets will arise.
While not trying to sound too sanguine, fortunately Australia faces this global economic transformation in an enviable position – we are located in the right place geographically to fully take advantage of the substantial social and economic development to our north.
But being the envy of other advanced economies is no guarantee for lasting prosperity. We must continually adjust, adapt and respond if we are to maximise the benefits to us of this once in a century transformation — we cannot rest on the reform successes of the past, nor favourable shifts in geography alone.
Thank you.
1 Parkinson, M. (2011), 'The China Australia Relationship: Recognising the Challenges, Grasping the Opportunities.'
2 In terms of manufacturing's share of total employment, over the last decade Australia follows closely the trend decline in the G7.
3 In terms of aircraft movements, mining centres such as Karratha, Newman and Port Hedland have recorded annual increases of around 20 per cent on average over the last three years while the total national average has been around 3 per cent.
4 For example, Qantas now flies direct to Karratha and Port Hedland from Melbourne.
5 An independent expert panel determines the estimate of the medium-term (10-year) equilibrium copper price.
6 While turnover on a daily basis involving the Australian dollar is much larger, this comprises short-term transactions that may be unwound and therefore are unlikely to have a lasting impact on the exchange rate. Using balance of payments figures shows the underlying transactions that create demand for Australian dollars over a year.