Downloads
Thank you for the opportunity to talk with you today.
A year ago, most of us thought that the outlook for the Australian economy this year was still solid despite the downside risks from a slowing world economy. The average Consensus forecast for GDP growth in 2009 was 3 per cent, roughly about trend growth. The most recent Consensus forecasts for 2009 are around -0.6 per cent. Clearly the economic landscape has changed in a way that none of us anticipated and we are now in a very different and a very uncertain environment.
Consensus Australia forecasts
(2009)

Source: Consensus Economics.
As you know the Budget forecasts were released a couple of weeks ago. These forecasts are our best assessment of where the economy is heading.
They make sobering reading. The economy is probably going into a 'technical' recession (two consecutive quarterly falls in GDP) and most certainly going into a recession in the more general sense of a broad-based economic slump. GDP is forecast to be flat in 2008-09 and fall by ½ of a per cent in 2009-10. Nominal GDP growth is forecast to fall even more. The unemployment rate is forecast to peak at 8½ per cent.
This is not as bad as in many other countries, but that's small consolation.
Looking further ahead, we've built in the start of a weak recovery in 2010-11.
If our forecasts are right, this will be three years of below-trend growth and an extended period of recovery.
These forecasts and projections are our best judgements. In practice, of course, there is considerable uncertainty around the duration of the recession and both the timing and strength of recovery. The implication is that we should not get too caught up with our point estimates, but should think more broadly about what is going on.
The Global Context
As a first step we can get a sense of how things might play out domestically by looking more closely at the international forces that are at play.
Our starting point is the worst set of international economic conditions since the Great Depression. The global economy is expected to contract by about 1.3 per cent this year. Trend global growth is about 4½ per cent.
Evolution of IMF 2009 world growth forecast

Source: IMF.
Global trade in goods and services is expected to fall by about 11 per cent; typically it grows around 8 per cent per year. Advanced economies are forecast to contract by 3 ¾ per cent. Clearly this is a very nasty episode.
Typically, recessions last for a bit less than a year and recovery takes about the same time. But this recession is not typical.
First, the trigger for this global recession has been a financial crisis. I don't want to go into the background of the crisis – you are all now very familiar with that. Suffice it to say that the strains on the global financial system have been extreme and, while stresses have eased, it still has a long way to play out.
The IMF now estimates that global writedowns by financial institutions between 2007 and 2010 will be about US$4 trillion. Capital is hard to come by. Banks are much more reluctant to lend; markets are more difficult and costly to access. A broad process of deleveraging is underway. The upshot is that in many countries funding is difficult to get – some large firms report difficulty finding working capital; many have difficulty raising long term funds.
History shows that these types of recessions are deeper and last longer than the more typical recessions. These types of recessions on average see output losses of around 3½ per cent of GDP and last for about 1½ years. On average it takes another 1½ or so years to get back to the earlier peak in activity. At this stage, a large output gap has opened up.
Recessions
Duration

Amplitude

Source: IMF.
At the sectoral level there are clear differences in how things evolve during this process.
- Credit growth in the recovery phase is much weaker than in the recovery phase from a more normal recession.
- Asset prices fall by more and remained subdued for longer.
- Private consumption is typically subdued for a longer period, as households rebuild balances sheets.
- Private capital investment is typically much weaker, usually continuing to decline even after the trough in the recession.
- With the sharper shock, unemployment rises more quickly and, on average, ends up about 2 percentage points higher than in normal episodes.
- Typically in these types of recessions, exports drive the recovery.
This latter point on exports brings us to the other dimension of the global recession. This time it is highly synchronized. These types of recessions tend to be deeper and last longer. Not surprisingly, trade contributes much less during the recovery phase when all countries are struggling at the same time.
Together, the financial dimension and the synchronised dimension has in the past seen recessions that are longer – more like two years, deeper – with output losses closer to 4½ per cent, and more drawn out recoveries.
The good news is that governments and central banks have done a lot to support economic growth.
Governments in the G-20 countries have, collectively, injected total stimulus into their economies that will turn out to be close to 2 percent of their GDP in 2009.
Central banks have cut official interest rates – in some cases close to zero – and have turned to a range of innovative monetary measures.
Whether this stimulus gets traction, however, depends on how quickly the financial sector is restored to health.
To this end governments and central banks have provided huge amounts of liquidity to the international financial system. There have been guarantees and other contingent measures, support for the removal of toxic assets from the balance sheets of banks and other institutions, and support for the recapitalization of undercapitalized financial institutions.
Where are things up to in this process?
Clearly, some of the acute financial stresses of last year have now eased. The oft-quoted LIBOR-OIS spread is one of a number of indicators that show that interbank conditions, while far from normal, continue to improve.
3-month LIBOR over OIS spreads
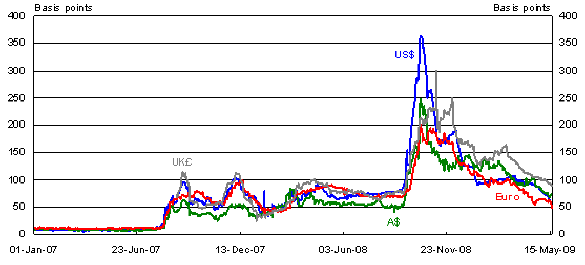
Note: Data as at 19 May 2009.
Source: Thomson Reuters – Ecowin Database.
That said, banks in the major economies are not in great shape to resume lending:
- Of the US$2.7 trillion of writedowns expected to be undertaken by banks, the IMF estimates about 1/3 has already been done.
- In terms of capital requirements, the IMF estimates that in order to return to the gearing levels of the mid 1990s, US banks would need an additional US$500 billion capital, the euro area banks would need another US$725 billion in capital and UK banks would need a furt
her US$250 billion.
These estimates are only rough, but they highlight the magnitude of the task ahead.
While we may start to see a global recovery next year, it is likely to be weak and drawn out.
Australian Outlook
Against this international backdrop, it is not surprising that the Australian economy is going into recession and that we are looking at an extended period of weakness. Eventually the economy will pick up steam but of course the question is when.
First, the Bad News
The bad news is that forward looking indicators are not positive for the near term.
Household wealth fell by 8 per cent last year. Employment prospects are deteriorating and consumer confidence has fallen sharply. Not surprisingly, consumer spending is weak, even allowing for the effect of the Economic Security Strategy and Nation Building and Jobs Strategy stimulus.
The ESS package clearly has had some impact. March data show that retail trade remains about 4½ per cent above its pre-stimulus level in November 2008. Retail employment has also increased.
That said, consumption is likely to be weak for some time as households rebuild their balance sheets.
Consumer sentiment
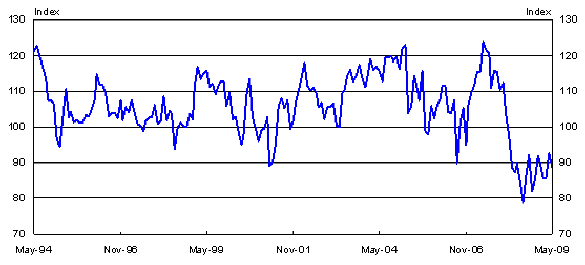
Source: Westpac and Melbourne Institute.
The outlook for external demand is not encouraging. World trade volumes are declining sharply.
Commodity prices have fallen. Our terms of trade are forecast to fall by over 13 per cent in 2009-10, and about 20 per cent through the year. This takes out about $35 billion from the nominal economy. Export volumes are also set to fall as global trade comes off sharply.
Bulk commodity prices
Thermal coal
(Newcastle)
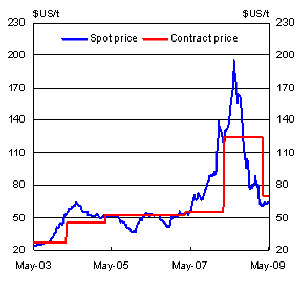
Iron ore
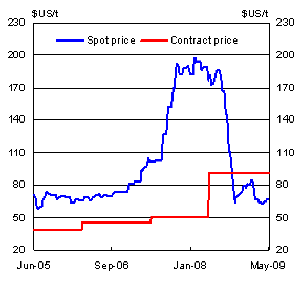
Note: Iron ore spot price is cost and freight for India/China imports.
Source: Bloomberg, Global Coal and ABARE.
With domestic and external demand weakening, the business sector is under pressure.
Credit growth is slowing sharply.
Business credit
(3-month annualised growth)
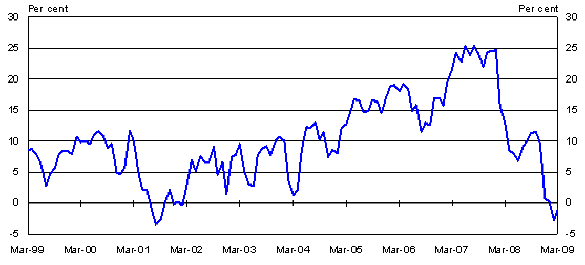
Source: Reserve Bank of Australia.
Capacity utilisation is falling.
NAB capacity utilisation
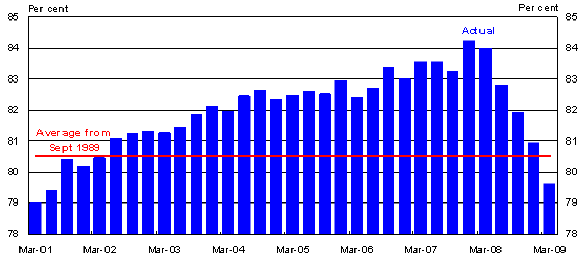
Source: National Australia Bank.
Investment plans have been put on hold.
Business conditions and new business investment
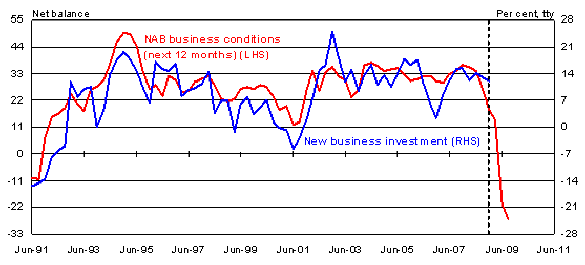
Note: NAB business conditions data are lagged two quarters.
Source: ABS Catalogue Number 5206.0 and National Australia Bank.
The weak outlook is particularly stark in business surveys, where businesses routinely expect a substantial deterioration in the economy over the next 12 months.
Business confidence and expectations
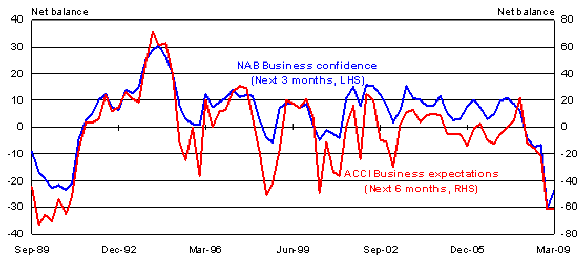
Source: National Australia Bank and Australian Chamber of Commerce and Industry.
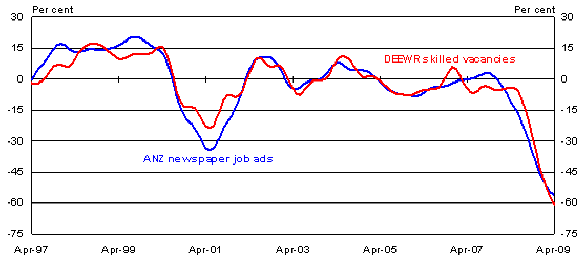
Regardless of what else happens, unemployment will rise over the next year or so. Job advertisements have fallen by about half over the past year.
Job vacancies
(Trend)
Source: ANZ and DEEWR.
We estimate that the unemployment rate will peak at about 8½ per cent; without the stimulus we estimate it would have peaked at about 10 per cent.
Not surprisingly, in a world where real and financial asset prices have been falling, and large output gaps are opening up, inflation pressures are likely to be subdued.
Headline and underlying inflation
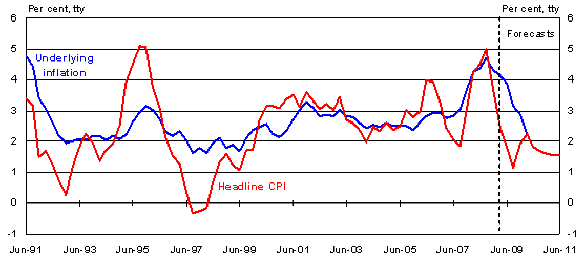
Note: Headline inflation is adjusted for the effects of The New Tax System. The underlying inflation measure is the average of the RBA trimmed mean and weighted median.
Source: ABS Catalogue Number 6401.0, Reserve Bank of Australia and Treasury.
The near-term outlook is clearly weak.
The Good News
The good news is that the policy response from the Government and the RBA has been timely and substantial.
No one expects that Australia can reinflate the world, but we can help to mitigate some of the damage to our own economy.
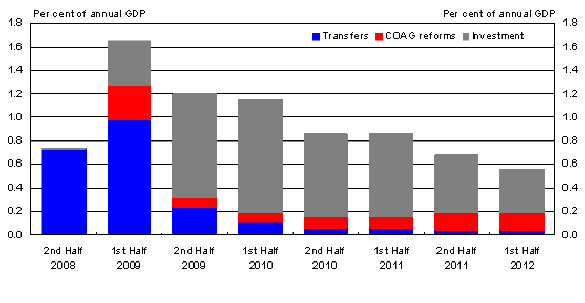
The government has announced several stimulus packages. The biggest stimulus occurs in 2009-10, when we think things will be at their weakest. Our calculations suggest they will add about 2¾ per cent to the level of GDP in 2009-10 and 1½ per cent in 2010-11.
Composition of fiscal stimulus
Source: Treasury.
Unlike many other countries we have been able to do this and still retain a healthy a balance sheet.
Government net debt position for selected countries
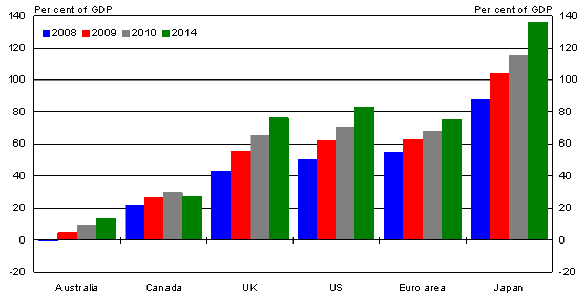
Note: Data are general government net debt, except for Australia which are Australian Government debt. Data are as at end of calendar year, except for Australia and the UK where data refer to financial years beginning 2008-09. UK data for 2014 refer to financial year 2013-14.
Source: IMF, HM Treasury and Treasury.
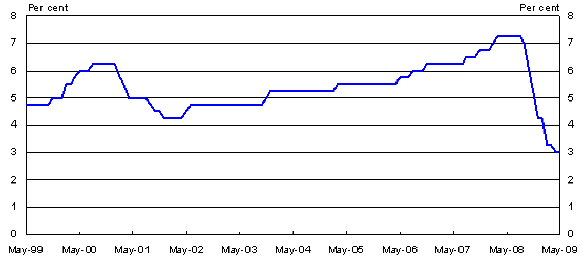
The RBA has reduced official interest rates by 4¼ percentage points since last September and much, although not all, of this has been passed on to mortgage rates and to business interest rates. These cuts will help stimulate the economy and underpin the eventual recovery.
Cash rate
Source: Reserve Bank of Australia.
The exchange rate is also doing its part. The TWI has fallen by over 15 per cent since its peak last year providing some offset to the weaker global demand and lower commodity prices.
TWI
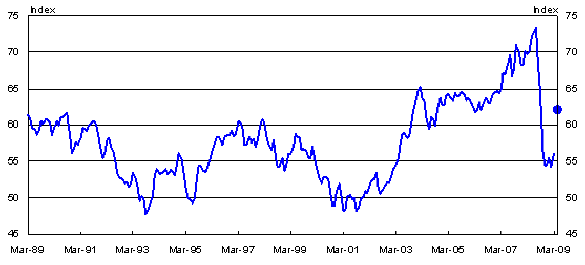
Note: Dot represents outcome as at 19 May 2009.
Source: ABS Catalogue Number 5368.0.
Most importantly, our financial system is still in good shape. Four of the world's top ten rated large banks are Australian.
World's 100 largest banking
groups by credit rating

Note: Data refer to bank holding company ratings as at 1 May 2009 and bank holding company assets as at late 2007 (latest available data).
Source: Bloomberg and The Banker.
They are well capitalised and profitable. They do not have the same exposure to the subprime mortgage lending and other distressed assets as banks in the US and Europe.
Australian major banks' net profit
(Yearly)

Source: Reserve Bank of Australia.
While this has been a global financial crisis – it is not an Australian financial crisis.
The other positive for Australia – looking ahead – is the possibility that China will provide some timely support for our economy. Recent data provide some comfort that the Chinese stimulus packages are starting to pay dividends, but its still early days.
China's lending by financial institutions

Source: China CEIC database.
Well into the worst global period in many decades our terms of trade are still very high; indeed even after the sharp falls in prices that we have factored in, the terms of trade will still be 45 per cent above the level in the decade before the recent boom. China, India and the other emerging Asian economies will not go away.
Already we can see some green shoots here as well. While weak, some of the confidence measures and business surveys look like they might be stabilising. Retail sales looks like they are holding up. And exports seem to be doing better than expected. And some of the housing indicators are looking a bit better as well.
Putting all this together is clearly a judgement call. Our best judgement is that the economy will contract next year, grow slowly the following year and then grow more strongly than trend over the following years. The long period of weakness – 3 years below trend – reflects the particular drivers of this recession that I mentioned earlier.
Real GDP

Source: ABS Catalogue Number 5206.0 and Treasury.
The above trend growth – after that extended period of weakness and slow start to the recovery – is broadly consistent with what has happened after past recessions. Much has been made about whether these numbers, and the following period of above-trend growth, are too optimistic. My view is that they are not. Our forecasts include a recession, three years of below trend growth, and an output gap that does not close for nine years.
Of course it is not unusual for an economy to grow strongly when it emerges from a recession. In our forecasts that doesn't happen this year, or next year, or even the year after. But eventually the cycle will move on.
That said, that there is a lot of imprecision in projections of growth this far out, particularly in this sort of environment. As someone said, "that why they call it the future".
One source of comfort is the IMF global projections looking further out. The IMF can hardly be described as optimistic these days, but their forecasts have advanced country growth of about 1½ per cent above potential in 2012, pretty much in line with what we are expecting for the Australian economy in 2011-12.
IMF growth forecasts for advanced economies

Source: IMF.
A key question of course is what 'potential' growth is after we emerge from this episode and this is where we differ from some of the early thinking by the IMF on this issue, at least for Australia.
Looking back it would be easy to conclude that at least some of the strong growth we've seen globally over the past few years has been illusory. And of course recessions can have effects long after the cycle moves on: organisational networks are broken; skills are lost.
But I expect Australia will emerge in better shape than many other countries. Our financial system did not exhibit the excesses found in some other countries –the financial industry's output was mostly real and sustainable.
The surge in investment in Australia has been in productive business capital, particularly in mining. And even as business investment is coming off, the government's public investment in infrastructure is reaching record highs. Our capital stock is at historically high levels and, even with the sharp falls in private investment that we expect over the next year, our level of investment will still remain above historical levels.
New business investment as a share of nominal GDP

Note: Adjusted for second-hand asset sales from the public sector to the private sector.
Source: ABS Catalogue Number 5206.0 and Treasury.
Population and labour force growth should remain high, supported by migration. Even allowing for demographics and so on, its hard to see the labour force growth getting below 1½ per cent for some time.
Labour force growth

Source: ABS Catalogue Number 6202.0.
If productivity grows at long run rates – about 1½ per cent on average over the past 30 years or so – and there is no reason why it should not given the substantial reforms made to the economy over that period – Australia's economy should continue to grow at the sort of underlying rates (about 3 per cent) that we have used in the Budget.
Conclusion
Before I finish up I'll leave you with a wonderful chart from the IMF about the confidence intervals around their world forecasts. The IMF has said that it is 90 per cent sure that global growth in 2010 will be somewhere between plus 4½ per cent and minus 1½ per cent – a range of about 6 percentage points. If anyone is feeling too confident about their assessment of the global outlook – whether it is bearish or bullish – this is a reminder that we are living in uncertain times.
Risks around IMF world growth forecasts

Source: IMF.
Thank you.