Downloads
Introduction
Good morning.
It is a pleasure to be with you today at this Whitlam Institute Symposium.
My topic is "Fiscal Policy: More than Just a National Budget".
This topic is equally interesting put the other way around: "The National Budget: More than Just Fiscal Policy". Today, I want to say something about both topics.
The term fiscal policy is usually associated with the use of the budget as a macroeconomic tool for the management of aggregate demand in the economy.
The work of Keynes and other pioneers of macroeconomics through to the 1950s, given impetus from the Great Depression, generated, and sustained, interest in the budget being used in this way.
Then, from the 1970s, other theoretical advances in economics — notably through the work of people like Robert Barro — encouraged policy makers to understand the limitations of fiscal policy as a macroeconomic tool.
In more recent times, an improved understanding of the operation of monetary policy, and the establishment of stronger monetary institutions, have seen monetary policy become the preeminent tool of short-term demand management.
Over time, fiscal policy considerations have come to have more to do with the quality of government spending and taxation policy interventions in the economy.
In Australia's case, this essentially microeconomic perspective on fiscal policy has probably been encouraged by the adoption of a medium-term fiscal strategy, of balance on average over the cycle, and – more particularly – by the targeting of a small surplus for several years in this decade during which the stance of monetary policy was adjusted quite considerably.
And the perspective was probably made even sharper by the debate, stimulated by a couple of intergenerational reports, about the long-run sustainability of fiscal policy settings.
And then along came the Global Financial Crisis.
Today, in late 2009 one would have to conclude that our understanding of fiscal policy has to be quite sophisticated.
The nature of spending is always important. And monetary policy remains the primary tool of demand management.
But the results of our response to the global financial crisis, and that of other countries, demonstrates that fiscal policy can, indeed should, in sufficiently challenging circumstances, be used to complement monetary policy to achieve better macroeconomic outcomes.
I'm not just referring to providing stimulus to the economy through government spending either. Most of the actions taken by governments around the world in providing guarantees in support of domestic financial systems were also fiscal policy actions — with governments positioning public sector balance sheets in support of private sector activity.
The Australian Government's discretionary fiscal policy response to the global financial crisis has been discussed extensively elsewhere. It is not my intention to cover that ground again today. Instead, I want to make the point that macroeconomic demand management is only one of the functions of fiscal policy – albeit, at times, a rather important one.
A broader understanding of fiscal policy encompasses all of the micro-level detail in all of the revenue and expenditure decisions of government.
In 2008-09, the combined effect of the Australian Government's discretionary fiscal stimulus measures are estimated to be around $28 billion or 2½ per cent of GDP. By any measure, this is a large fiscal stimulus. Even so, it is still only around 10 per cent of the national budget. So there is a lot more going on in the national budget beyond these discretionary fiscal policy measures.
Discretionary demand management seeks to ameliorate macroeconomic fluctuations – to reduce aggregate volatility in economic growth. Beyond the very short term, it is not concerned with economic growth per se. But much of the "micro" detail of the budget is concerned with growth. And even that which is not concerned with growth probably affects it anyway.
The impact of fiscal policy on growth is important. It is a topic of enduring interest to economists and others with an interest in public policy. And there is, as yet, no generally accepted set of conclusions to draw on. Despite that, today I want to go further.
What I want to talk about today is the way in which all of that micro detail - the choices made in a government's budget - affect not only economic growth but, more broadly, wellbeing.
Looked at from a wellbeing perspective, fiscal policy and the national budget have a broader and more important role to play than is commonly understood. In particular, fiscal policy can play an important role in building human capabilities.
Fiscal Policy and Treasury's Wellbeing Framework
Treasury's advice on fiscal policy – as in all other policy areas – is informed by the wellbeing framework that sits at the core of our mission statement. This framework was developed in the early part of this decade to provide a consistent and robust architecture to guide our policy advice.1
The Treasury wellbeing framework has five dimensions:
- centrally, the level of freedom and opportunity that people enjoy;
- second, the aggregate level of consumption possibilities;
- third, the distribution of consumption possibilities;
- fourth, the level of risk that people are required to bear; and
- fifth, the level of complexity that people are required to deal with.
Treasury's perspective on freedom and opportunity has been heavily influenced by the work of Amartya Sen on the contribution that 'substantive freedoms' make to development.
According to Amartya Sen, the true measure of human development is the capabilities that an individual has to choose a life they have reason to value.2 Capabilities allow an individual to fully function in society. They are not income and, while they include basic civil rights and political freedoms, they are not limited to 'rights'.
In applying this framework to fiscal policy we have to consider not only the relevance of fiscal sustainability to questions of intergenerational equity, but, more broadly, the impact on the wellbeing of individuals, and society as a whole, of every one of the expenditure and revenue decisions of government.
This is no small task.
Wellbeing and the Size of Government
What about the size of government?
The Whitlam Government came to power with a broad ranging policy agenda – the implementation of which had the effect of increasing both the scope and size of Australian government. The agenda included real increases in social welfare payments3, free university education, universal medical coverage, new departments of Aboriginal Affairs, Environment and Urban and Regional Development, and significant public sector real wage rises.
The policy initiatives were reflected in strong growth in the level of government outlays over the course of the Whitlam Government.
Australian Government expenditure grew from 18.9 per cent of GDP in 1971-72, the last full budget year before the Whitlam Government came to power, to 24.8 per cent of GDP in 1975-76, the last budget delivered by the Whitlam Government, representing spending growth of around 56 per cent in real terms.
In the three and a half decades since, while there have been significant annual fluctuations, the average level of spending by the Australian government has changed little, to be around 25¼ per cent of GDP.4
The Whitlam Government was, therefore, responsible for an enduring increase in the size of government. That is, the close to 6 percentage points of GDP expansion in gove
rnment expenditure during the Whitlam Government has never been reversed. And I think I can safely say that it never will be.
Chart 1: Government expenditure as share of GDP
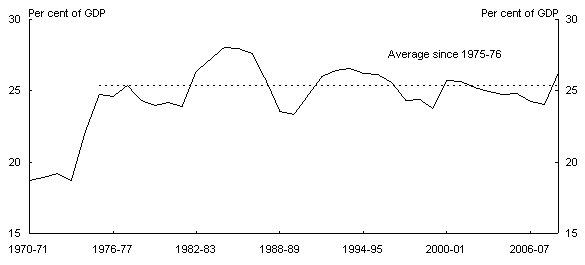
Source: Mid-Year Economic and Fiscal Outlook 2009-10.
Initially, the increase in government expenditure was not matched by a commensurate increase in government revenue, with revenue increasing by only two percentage points of GDP over the term of the Whitlam Government (from 20.9 per cent of GDP in 1971-72 to 22.9 per cent of GDP in 1975-76). Subsequent governments chose to fund the increased expenditure through increased taxation rather than ever growing levels of public debt; that is, to make larger government fiscally sustainable.
Chart 2: Government receipts over time
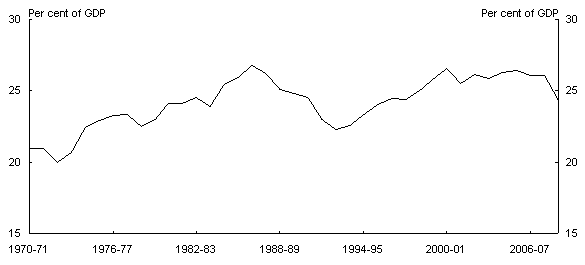
Source: Mid-Year Economic and Fiscal Outlook 2009-10.
What are the implications for wellbeing of these aggregate developments?
Whatever the size of government, fiscal sustainability is important for maintaining macroeconomic stability, reducing aggregate economic vulnerabilities; and, in those ways, improving aggregate economic performance. It reduces the degree of uncertainty about future policy settings and facilitates growth-enhancing economic decision-making, especially regarding the accumulation of physical and human capital.
Fiscal sustainability is likely, therefore, to be of positive value to aggregate measures of wellbeing, both now and in the future.
The impact of the size of government on wellbeing is less clear.
Based on the numerous efforts to estimate, for developed countries, an empirical relationship between size of government and aggregate measures of things relevant to wellbeing, including rates of economic growth, it would be sensible to conclude that the optimal size of government is not a question that can be answered by a technical economic analysis.
The question that is of key concern to the Treasury, then, goes beyond aggregates, to consider the impact on wellbeing of changes in the micro-level detail of government expenditure and revenue.
I have noted that the wellbeing framework comprises five dimensions. It would be an exceptional case in which a policy intervention would be considered unambiguously positive across all five dimensions. Indeed, the wellbeing framework reflects our conviction that trade-offs matter deeply, emphasising the importance of assessing policy interventions in broad terms.
The Role of Fiscal Policy in Building Capabilities
An analysis of some of the key components of the increase in government expenditure since 1971-72 illustrates some of the trade-offs involved.
Overall, in 1971-72, Australian government expenditure on health, education, and social security and welfare was around 6 per cent of GDP, or around 29 per cent of total outlays. By 1975-76, this had doubled to 12 per cent of GDP, or around 45 per cent of all outlays.
That is, the total increase in government expenditure under the Whitlam Government is fully explained by an expansion of the social policy role of government in health, education and social security and welfare.
And the trend established by the Whitlam Government has persisted. By 2008-09, the proportion of the Australian government's budget allocated to social security and welfare, health and education had grown from 45 per cent to more than 60 per cent, equal to an increase from 12 per cent of GDP to 16¼ per cent of GDP.
Chart 3: Health, education and welfare expenditure as a share of GDP and total Government expenditure
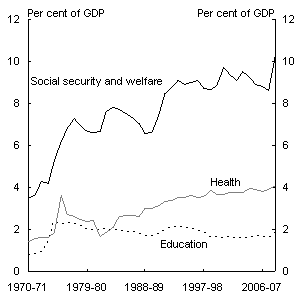
Source: Treasury calculations.
What do we have to show for these increases?
In attempting to answer this question I will focus separately on social security and welfare, and health expenditure. Unlike education, in both of these areas, strong growth in outlays has continued post-Whitlam.
Social Security and Welfare expenditure
In 1971-72, Australian government expenditure on Social Security and Welfare was around 3¾ per cent of GDP or around 17½ per cent of total outlays. By 1975-76, this had risen to 6¼ per cent of GDP or around 23¼ per cent of outlays.
Since then, Social Security and Welfare spending has continued to rise, to be around 10½ per cent of GDP and 38½ per cent of the 2008-09 Budget.
Initially, an increase in the real level of welfare payment rates was an important factor in this rise.5 However, over time, welfare expenditure has been driven by an increase in the number of recipients.
In part, the increase in income support recipients reflects demographic factors that are effectively 'locked in'. As the population ages, there are more age pension recipients. Age pension outlays have increased from 1.6 per cent of GDP in 1971-72 to be around 2½ per cent of GDP in 2006-07. The most recent IGR (2007) projected age pension outlays to increase by a further 1.9 per cent of GDP over the forty years to 2046-47.
Population ageing can also affect other income support payments. In particular, the level of disability support payments among older workers is significantly higher (Chart 4).
Chart 4: Disability Support Pension customers: Historical and with the DSP coverage rate held constant (at 1980)
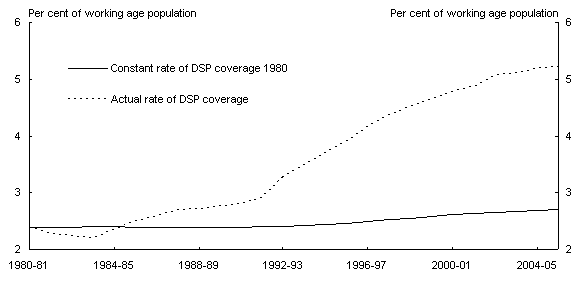
Source: Treasury calculations.
But this is not the main factor behind the increase in welfare spending in recent decades. The proportion of income support recipients that are age pension recipients has actually fallen from around 75 per cent in 1971-72 to around 50 per cent today.
Of course social security and welfare payments can be affected by economic conditions as well as policy decisions – as unemployment rises so do outlays on unemployment payments. The 1970s saw unemployment increase substantially, reflecting increased numbers out of work and for longer durations. But the increase in the unemployment rate is not the main contributor to the increase in the number of income support recipients.
The main contributors are sole parents and the disabled. Indeed, for many years now, there have been more people receiving disability support pensions than unemployment benefits.
Chart 5: Growth in selected income support payments
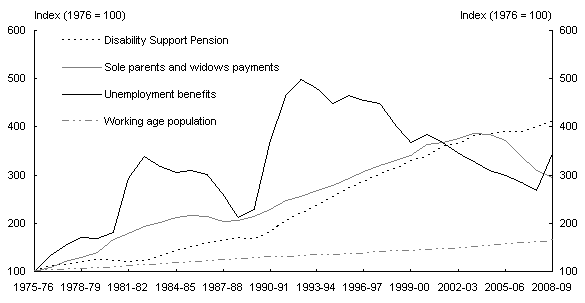
Source: DEEWR and Treasury estimates
While much has been said and written on these matters, the fact is that we don't have a wholly satisfactory explanation for all of this growth in income support recipients.
Even so, it is under
standable that economic and social policy analysts would be enquiring about the extent to which the tax and transfer system might be affecting people's decisions about the kind of life they lead; whether the tax and transfer system is making it more or less likely that they are choosing a kind of life that they have reason to value.
While there are many factors that affect workforce participation, where a decision is made not to work due to financial disincentives imposed by the tax and transfer system, then that, along with the longer-term capability costs of the decision not to work, should be of great concern.
If the policy settings are not right, if incentives are misaligned, the tax and transfer system can deprive individuals of the opportunity to develop their capabilities; perversely, it can lock disadvantaged groups into cycles of dependence.
The tax review that I have been leading these past 18 months has been told many times, including by those who are themselves disabled, that the current system does not adequately recognise the desirability of some people with a disability participating in work, with their income support payment effectively contingent on them working little or not at all.
That is one perspective. Understandably, however, not everybody sees adverse incentives as the problem.
But, whether it is because of poor incentives in the tax and transfer system or something else entirely, it is hard to believe that an ever increasing number of people dependent on income support is the best we can do.
Thus, despite the difficulty of the task, reducing the distortions to participation and finding other ways of enhancing the opportunities for individuals to build the capabilities to lead the kind of life they value, and have reason to value, must remain an important goal of policy. And the budget provides the instruments for pursuing that goal.
Health
Another way that the budget can improve human capability is through health expenditure. In 1971-72, Australian Government expenditure on health was around 1½ per cent of GDP or around 7 per cent of total outlays. By 1975-76, this had risen to 3½ per cent of GDP or around 13½ per cent of all outlays.
While health expenditure then fell to a little under 2 per cent of GDP in 1982-83, it has increased steadily since to be above 4 per cent of GDP in 2008-09.
There are several factors behind this increase in public health expenditure.
Most obviously, health spending tends to rise as the population ages. We tend to need more health services as we get older.
In addition, technological developments means that the range and quality of health services available increases over time.
And income growth encourages a more than proportionate increase in the demand for health services.
The most recent (2007) Intergenerational Report projected that Australian Government health spending would grow to 7.3 per cent of GDP in 2046-47. Updated projections will be presented in the next Intergenerational Report, to be released prior to the 2010-11 Budget.
Clearly, health expenditure will be a significant source of fiscal pressure in coming decades.
Meeting the community's demands for more and better quality health services within a restricted fiscal envelope will be increasingly challenging for governments.
It will require difficult choices – trade-offs – to be made; about the level and quality of health services we consume, who pays for them, and how.
The Need for Better Measurement
As the fiscal pressures of an ageing population mount, governments will be judged by their ability to deliver better quality public services within ever tighter budget constraints.
Unfortunately, the ability of the community to be able to make well-informed judgements is limited by the fact that we are well short of having sufficiently good information about the nature of governments' taxation and expenditure programs, and the relationship they bear to outcomes. There are several reasons for this.
It is often difficult to measure the quantity and quality of public sector services.
ABS6 measures of the value of output of the health and education services sectors are based on the cost of production, with the split between quantity and price largely based on relevant wage cost indices.7
This means, for example, that if it takes one doctor twice as long to perform the same medical procedure to the same quality as another then the first doctor is calculated to have produced twice as much.
As the Report by the Stiglitz-Sen Commission on the Measurement of Economic Performance and Social Progress notes,
'an immediate consequence of [using inputs to measure these services] is that productivity change for government-provided services is ignored, because outputs are taken to move at the same rhythm as inputs. It follows that if there is positive productivity growth in the public sector, our measures under-estimate growth'.
Similarly, if there is negative productivity growth in the public sector, our measures over-estimate growth. Improving the measurement of non-market service sectors of the economy is one of the Stiglitz-Sen Commission's priority recommendations.
It is also difficult to measure the outcomes in areas such as health. For example, life expectancy is the most broadly available (and therefore most commonly used) indicator of health outcomes, but it is clearly an incomplete measure of the health of the population.
Life expectancy measures mortality only. It does not provide any information on the quality of life or the burden of chronic disease. Ideally, we want an indicator that includes information on both mortality and morbidity. However, as noted by the Stiglitz-Sen Commission,
'although several combined indices of people's health exist, none currently commands universal agreement. Further, they all inevitably rest on ethical judgements that are controversial, and on weights for various medical conditions whose legitimacy is not always clear'.
Even if we could solve these dilemmas we would still be left with a third: the difficulty in identifying the impact of changes in government expenditure on outcomes that are also heavily influenced by individual decisions and behaviours.
The lack of evidence of a clear relationship between increased expenditure and better outcomes is not to say that more expenditure will not improve outcomes. Yet it is probably safe to say that micro-level decisions on where, and on what, we spend money are just as important. It is also clear that good program design and delivery are important to getting value for the public's money.
Fiscal Policy, Risk and Structural Adjustment
Finally, I would like to highlight briefly another important way in which fiscal policy, and the budget, can (and has been) used to improve wellbeing.
There is, I think, a solid consensus that economic reforms of the past quarter of a century have played an important role in the improved performance and resilience of the Australian economy.
It is less widely appreciated how the Budget has often been used as a tool to help smooth the implementation of these reforms, facilitating the often difficult adjustments that accompany structural reforms.
A recent OECD study on The Political Economy of Reform commented that:
"one of the most robust findings to emerge from recent econometric work on the political economy of structural reform is that sound public finances tend to be associated with more reform"
To put this (retrospectively) into our wellbeing framework, structural reforms have often involved increasing risk to some parts of the community in order to benefit Australian society in some aggregate
sense. Other reforms that were considered desirable at an aggregate level were often considered to have undesirable distributional consequences.
In many such cases, reforms were "purchased" by compensating "losers" from the budget.
There is a legitimate role for using the budget in this way, with some qualifications. First, the reform should be worth the cost of the compensation involved. Second, the payments should ease rather than hinder the necessary adjustment process.
Let me give some examples.
By the early 1980s it was clear that real wages growth had outpaced productivity growth, and this was contributing to a persistently high unemployment rate. In accord with the trade union movement, the government of the day provided income tax reductions and other "social wage" payments for the benefit of workers in return for real wage restraint. This allowed a sustained period of real wage moderation, which was an important factor behind the considerable reduction in the unemployment rate late in that decade.
- it was considered that, in the absence of appropriate compensation arrangements, the introduction of the Goods and Services Tax would have had a disproportionate adverse impact on some sectors of the community. Tax cuts and other compensation payments were used to address these distributional issues and smooth the implementation of the reforms.
- important element of the effective implementation of the National Competition Policy reforms in the 1990s was progressive National Competition payments from the Commonwealth to the States. The rationale for these payments was that while the States were primarily responsible for the implementation of NCP reforms, the benefits would be shared broadly through the national economy. The payments provided a way of distributing the benefits of reform in a manner that had political traction.
The creative and active use of the budget in the structural reform process has made an important contribution to Australia's wellbeing.
Conclusion
The Whitlam Government can be seen, in retrospect, as having been responsible for a permanent increase in the size of Australian government. There has been a lot of interest over the several decades since Whitlam in the economic consequences of larger government and the appropriate role of fiscal policy in a modern economy. Much of that interest, on both sides of some quite intense debates, has been ideological. But it would be fair to say that both the intensity and ideological content of the debates has abated over time. One reason for that is a growing interest in the microeconomics of the national budget. That growing interest is a good thing.
Currently, it is being hampered, significantly, by deficiencies in measurement; of inputs, outputs and – most importantly – outcomes. There is a need for better measurement.
From a Treasury perspective, all of the micro-level detail in the spending and taxation decisions in the national budget are relevant to the wellbeing of Australians; they should be intended to contribute to the ability of Australians to build capabilities that allow them to choose lives they have reason to value.
Reforms we implement today build capacity for governments of the future to assist Australians in this way.
Thank you.
1 See, for example, Henry, K 2004, 'Policy Advice and Treasury's wellbeing framework', Economic Roundup, Winter, Treasury, Canberra, available at http://www.treasury.gov.au/documents/876/PDF/Policy_advice_Treasury_wellbeing_framework.pdf
2 Sen, A 1999, Development as Freedom, Oxford University Press, Oxford.
3 Unemployment benefits to individuals more than doubled in real terms; widows pension expanded to supporting mothers; disability pensions expanded.
4 It is necessary to qualify this statement by noting that there a number of structural breaks in historical budget information due to changes in accounting classifications that cannot be eliminated by backcasting data. See Appendix D of the Mid-Year Economic and Fiscal Outlook 2009-10 for further information.
5 Unemployment benefits increased by around 24 per cent in real terms between the June quarter 1973 and the September quarter 1974.
6 It is not my intention to be critical of the ABS per se – their measures are as good as any that I am aware of.
7 This is in annual supply and use tables. For quarterly publications hours worked data are used.