Downloads
Thank you for the invitation to address you today. This is number 10.
When I last spoke to this group, almost a year ago to the day, Australia was still very much in the midst of a pronounced global downturn.
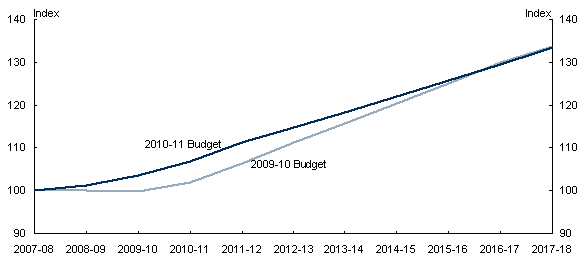
What a difference a year makes. As we can see from Chart 1, we are emerging from the global downturn considerably faster than we expected in last year's Budget.
Chart 1: Real GDP projection
Source: Treasury
Those of you who were here last year will remember that I spent some time justifying the 2009-10 Budget growth projections against claims that they predicted a period of unprecedented growth and were, therefore, too optimistic.
As the chart shows, we now consider that we were not optimistic enough in the short-run. Of course, that faster short-term growth necessarily implies some moderation in the medium-term growth projections.
Notwithstanding this positive picture, downside risks remain – as recent events in Greece, and Europe more broadly, demonstrate.
That said, the framing of this Budget had a sense of deja vu about it. Australia again faces pre-crisis opportunities and challenges of a near full employment economy and a strong terms of trade driven by high non-rural commodity prices. Tax reform, on which I will say more later, has also been added to the mix.
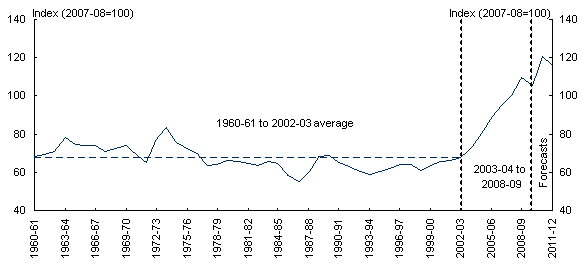
As you can see from Chart 2, the terms of trade rose sharply from June 2003 onwards. While the terms of trade fell back during the global downturn, it remained well above the long-run average and is now expected to rise again.
Chart 2: Terms of trade
Source: ABS cat. no. 5206.0 and Treasury.
I have spoken a number of times, including to this audience, about the opportunities and challenges associated with a mining sector boom.
At the risk of ruining a perfectly good expression, the net outcome of the so-called resource movement and spending effects associated with an increase in the terms of trade, is a 'three speed economy':
- the mining and mining-related sectors grow strongly;
- other trade-exposed sectors (like many parts of manufacturing) grow more slowly; and
- non-traded sectors grow at a rate somewhere between those two, depending upon the relative strengths of negative supply and positive demand shocks.
In order to balance demand and supply in the non-traded sectors, there will also be an appreciation of the real exchange rate. That is to say, there has to be an appreciation of the nominal exchange rate and / or a period of time during which domestic inflation exceeds the average inflation rate of our trading partners.
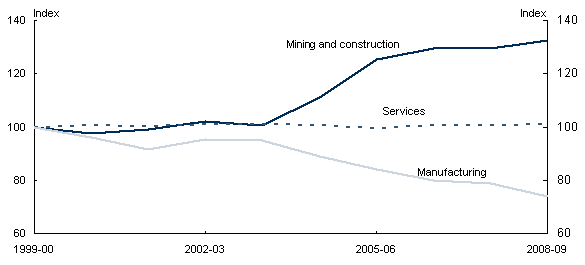
In recent years, these three speeds have been observed in the Australian economy. Chart 3 shows indices of output shares for selected industries. Mining and mining-related sectors have grown strongly, while the services sector – which is largely non-traded – has grown moderately. Manufacturing – which is trade-exposed – has broadly held its ground in absolute terms, but declined relative to the other sectors.
As I have noted on other occasions, according to the Stolper-Samuelson effect, since mining activity is relatively capital-intensive, once the resource movement effect has run its course, all industries, ironically, employ less capital-intensive production techniques and, for that reason, labour productivity is lower. Capital productivity, on the other hand, is higher. If that higher capital productivity attracts capital inflow from abroad, then the internal reallocation of resources from manufacturing to mining is magnified.
Chart 3: Output shares by selected industry
Source: ABS cat. no. 5204.0 and Treasury.
Will the high terms of trade be sustained?
Given its structural implications, there is considerable interest in knowing for how long the high terms of trade, and underlying export prices, are likely to be sustained.
There are at least three relevant considerations that inform how we think about the medium-term trajectory of the terms of trade. The first of these is the global supply response to high commodity prices, the second is the long term trend of commodity prices, and the third concerns the industrial development of China and India.
Global supply response
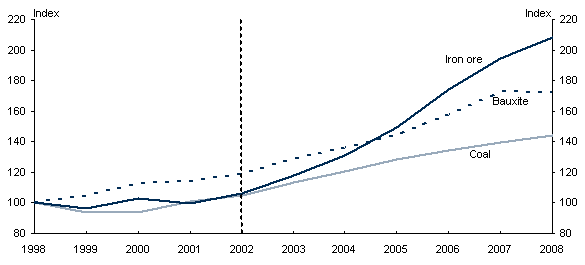
Chart 4: Global production of selected commodities
Source: British Geological Survey, various years, World mineral production, Keyworth, Nottingham, and Treasury.
First, let's look at the global supply response. Higher demand and higher prices induce a supply response, albeit with a time lag. As you can see from Chart 4, between 2002 and 2008 global iron ore production doubled while both coal and bauxite production increased by around 40 per cent. The five years prior to 2002 showed stagnant or only modest growth.
Sustained periods of strong prices and strengthened long-run price expectations can be expected to generate even stronger mining exploration and investment responses over time. They can also drive a reassessment of the size of global mineral reserves that are recoverable at a commercially viable rate. And technological improvements will continue to place downward pressure on extraction costs.
Thus, the long-run supply curve can be expected to be considerably flatter than the short-run supply curve. Some of the short-run increase in prices should, therefore, be temporary – which is why the budget forecasts are predicated on the terms of trade declining by some 20 per cent over time.
Long term trend in real prices — Prebisch-Singer hypothesis
The second consideration is the apparent long-term trend in commodity prices. In the decades leading up to the 2000s, the price of most non-fuel commodities showed a trend decline over time. In its 2006 World Economic Outlook, the IMF estimated that for the last half of the 20th century, non-fuel commodity prices had been falling on average relative to consumer prices at the rate of about 1.6 per cent per annum. This trend is consistent with the Prebisch-Singer hypothesis.
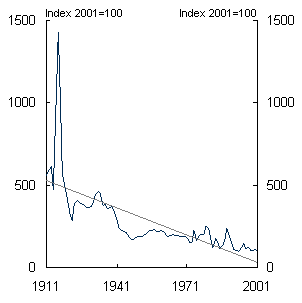
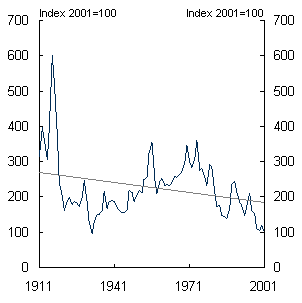
Proponents of the hypothesis point to trend lines such as Chart 5, which show that the long-term price trend for aluminium (on the left) and for copper (on the right) has been downward sloping over the past century.
Chart 5: Trend in real price of aluminium and copper
1911 to 2001
Source: US Geological Survey, Data Series 140 and Treasury
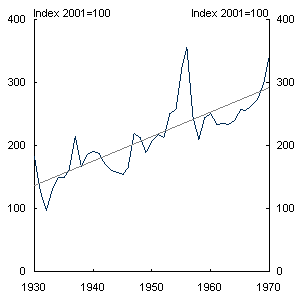
However, observed trends are sensitive to the commodity selected and the choice of time period. Thus, Chart 6 shows that in the period between 1930 and 1970, rather than a downward price trend, the copper price trended quite sha
rply upward, possibly reflecting the increased demand for manufacturing inputs during post-war development as well as the use of copper wire in telecommunications.
Chart 6: Trend in real price of copper
1930 to 1970
Source: US Geological Survey, Data Series 140 and Treasury
Also, we cannot simply dismiss opposing theories that argue that relative commodity prices will trend upwards over time as non-renewable resources are depleted and as the marginal cost of extraction increases as producers are pushed towards the more marginal deposits. 'Peak oil' is the best known of these theories.
Strong and growing world demand — sustained by the development of China and India
The third consideration when thinking about the future of commodity prices is the influence of rapidly industrialising countries like China and India. As you would know, China and, to a lesser extent India, have enjoyed a marked catch-up in per capita incomes to more developed countries. This catch-up has been a major source of growth in demand for Australia's mineral exports. But both countries still have a long way to go.
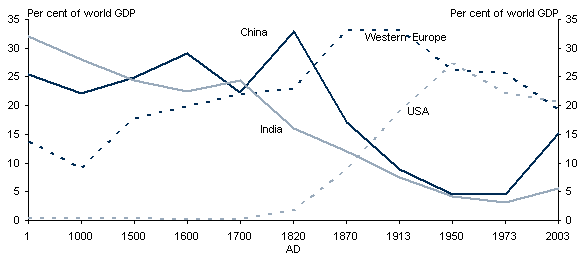
We should not be surprised if China and India do catch-up. If we take a look at very long-run cross-country comparisons, it is the current situation that is historically unusual. And when I say 'long run' we are talking about centuries. GDP and population estimates constructed by the late Angus Maddison, a pioneer in the field of economic history, are enlightening. Using his estimates, Chart 7 shows shares of world GDP for a group of selected countries.
Chart 7: Share of world GDP, I-2003AD
Source: Maddison A, 2007, Contours of the World Economy I-2030AD, Oxford University Press
For the first 1,700 to 1,800 of the 2,000 years shown, China and India's share of world GDP may have been greater than that of western Europe and the US. Two or three centuries ago, their share of world GDP began to decline as the industrial revolution took hold in the west. Only in the last four decades has China and India's share of world GDP rebounded strongly. Both have the potential to revert to something close to pre-18th century GDP shares in coming decades.
That is not to say that the catch-up of China and India is certain – only that it is certainly possible.
Another important point to note is that looking at aggregate GDP figures tells only part of the commodity demand growth story. Other important factors include the structure of economic activity, a country's stage of development and the types of commodities used to support these activities.
The IMF's 2006 World Economic Outlook concluded that the consumption of metals typically grows with income until incomes reach about $15,000 to $20,000 per capita (in PPP adjusted US dollars) as countries go through a period of industrialisation and infrastructure building. At higher incomes, growth typically becomes more 'services driven' and the growth in the use of metals per capita tends to stagnate.
Chart 8 plots the consumption of copper and steel per capita (the vertical axis) against real GDP per capita (the horizontal axis) for selected countries. Note that measured 'consumption' in this case includes metals used to produce goods for export. For advanced countries like the US and Japan, the consumption of copper and steel per capita has stagnated as real GDP has grown. The major exception to this trend is South Korea, where steel consumption has continued to grow because industrial production and construction is a dominant part of their economy.
Chart 8: Consumption of copper (LHS) and steel (RHS) per capita against real GDP per capita 1974-2004
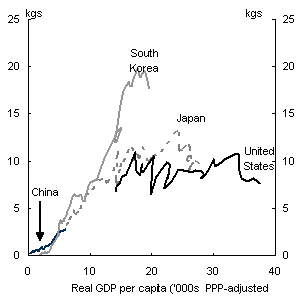
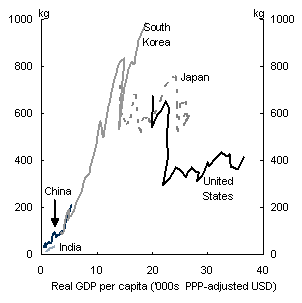
Note: Steel consumption data for all countries are for 1974 2004 except for India (1980 2004). For US and Japan, copper consumption data are 1960 2005, 1965 2005 for South Korea, and 1962 2005 for China. India's per capita consumption of copper is less than 1kg.
Source: IMF, Steel Statistics Yearbooks and Treasury.
GDP per capita (in PPP adjusted US dollars) for China and India were at around $8,000 and $3,000 respectively in 2009. So the potential for substantial catch-up by China and India in non-rural commodity consumption is high.
Policy implications
Taking these three considerations together, we have at least reasonable grounds for believing that strong world demand for Australian commodities and of high terms of trade will be sustained for some time, accepting that the duration of the period of elevated terms of trade is subject to a high degree of uncertainty.
What, then, are the policy implications?
Dutch Disease
Structural change in the economy is most obviously desirable to take full advantage of the income gains from high export prices. Allowing, rather than impeding, workers and investors to take advantage of improved returns to their labour and capital should be welfare enhancing.
However, there have been longstanding concerns, as far back as I can remember, about Australia becoming simply a 'quarry to the world'. These concerns around specialisation and de-industrialisation have been pejoratively labelled 'Dutch disease', a term coined by The Economist magazine in 1977 in discussing the adverse effect on the Dutch economy of North Sea oil and gas.1
The typical Dutch disease concern is that a radical contraction in manufacturing leads to a hollowing-out of the economy in respect of skills, value-adding and know-how, and the loss of a sector that might generate significant spillover benefits for the rest of the economy. There is a related concern about the risks of an undiversified economy.
In respect of Australia, these concerns may, at times, be a little overstated.
The evidence of lost positive spillovers from an expansion in Australia's minerals sector is not obvious. Mining exploration and production in Australia is highly skilled. It generates its own positive spillovers. For example, there are Australian firms that develop software for geological exploration and the modelling of mine operations. Potentially, as the world's mineral production is pushed towards more marginal deposits that are more costly or difficult to extract, Australia's comparative advantage in mining services will become even more valuable.
Even if there was hard evidence of relatively greater spillovers elsewhere, the appropriate policy response might be to target such spillovers directly, as governments do with assistance for research and development.
In addition, there is strong cross-country evidence that human capital accumulation and mineral resource abundance are positively correlated.2 An explanation for this is that the governments of resource-rich countries have invested resource revenues in education as a means of sustaining long-term returns to the population. Of course, in order to do so, they need adequate resource revenues.
We have reason to be suspicious of sectoral doomsday predictions. In the last four decades,
numerous predictions have been made of large scale unemployment and the death of manufacturing — decrying deregulation, tariff cuts and mineral booms.3 I remember, too, being told in the mid-1980s, how the gold mining industry would not survive the removal of its complete exemption from income tax, and how taxing windfall profits from gold mining would destroy thousands of jobs. The dire predictions of the past have not eventuated and it is unlikely that similar predictions today will fare any better.
Fiscal policy
So how does fiscal policy fit in the current environment?
Ideally, we would want fiscal policy settings that work well for different terms of trade scenarios. But the appropriate fiscal policy response to a terms of trade shock generally depends on its extent and duration. That is to say, whether the terms of trade shock is considered permanent or temporary might affect how we think about the government component of the spending effect.
If the commodity cycle is synchronised with the macroeconomic cycle, then the spending of a tax revenue windfall would amount to pro-cyclical fiscal policy. In an economy operating at close to full capacity, some amount of private sector activity would be crowded out - through higher factor prices, higher interest rates or an even higher nominal exchange rate.
Increased expenditures in response to a temporary revenue surge risk a structural deterioration in the fiscal position unless the higher level of spending can be reversed quickly once the boom is over.
In general, though, the automatic stabilisers — that is, those parts of revenue and government expenditures that move with the economic cycle — should be allowed to operate freely. I note that the IMF, in reflecting on the global downturn, has suggested there is scope for countries around the world to adopt instruments - including well designed taxes - that enhance automatic stabilisation.4
In this regard, a switch from royalties to rent-based charges or taxes applying to mining profits makes sense, as rent taxes are more responsive to the economic cycle. Having a relatively volatile and counter-cyclical rent tax residing with the Commonwealth, with the States having access to a relatively stable revenue stream to support public infrastructure spending in a downturn also makes sense from a macroeconomic perspective.
And allowing the budget balance to improve during periods of strong growth supports monetary policy and helps to provide the necessary fiscal space to run deficits during periods of weak growth.
All of this is pretty obvious to students of macroeconomics. But its implementation is not as easy as it might sound. It can be difficult to build big surpluses during the years when the 'rivers of gold' are flowing. There will be pressure to spend. Governing budget surpluses at such times can be especially difficult.
But it is not impossible either, as evidenced by Chile, where counter-cyclical fiscal policy is written into law.5 Chile is much more reliant on commodity exports even than Australia. In mid-2008, Chilean authorities resisted pressure to spend the soaring receipts from high copper prices. When copper prices dived as the global downturn hit, the Chilean authorities were able to increase spending sharply, financing a large fiscal stimulus with assets acquired from copper receipts.
As was the case here, the stimulus moderated the downturn.
For reasons given earlier, since it is likely that a substantial part of the increased income flowing from our elevated terms of trade will be sustained for some time, the persistent accumulation of surpluses in our case would likely be quite prolonged.
Persistent budget surpluses imply tax rates that are structurally higher than they need to be to finance current spending. And taxes can affect long run growth. The size of the tax-induced welfare loss depends on the choice of tax base and its structure.
If high inefficient taxes are maintained and a structural surplus is depleted through higher spending, there is the potential for a second set of deadweight costs — on the spending side. Especially as an economy approaches full capacity, it is important to keep in mind that the case for a government spending initiative has to confront both the opportunity cost of the proposed initiative – whether there is an alternative initiative of higher quality – and the cost of holding tax rates higher than they might otherwise be.
Sovereign wealth funds
There has been some debate over whether Australia should have a sovereign wealth fund as part of its fiscal policy. Since the term 'sovereign wealth fund' can mean different things to different people, I will define a sovereign wealth fund as a fund set up by the governing authorities in response to the tax revenue raised from the extraction and sale of non-renewable natural resources, with one or more of the following objectives:
- revenue stabilisation (shielding the budget from revenue volatility);
- saving for the future (consumption smoothing);
- imposing discipline on current government expenditures; or
- investing abroad to sterilise large foreign exchange inflows to limit the extent of nominal exchange rate appreciation.
Depending on what the key objectives are, these funds are typically called stabilisation or savings funds.
I don't want to pre-empt a debate on these matters. But I will make a few observations.
First, if the revenue surge is regarded as likely to be long-lived, the alternative of tax cuts – permitting the private sector to make its own saving and investment decisions – should always be considered first.
Second, of the various objectives, the proposition that a sovereign wealth fund can be used to impose discipline on government spending is most problematic. Sovereign wealth funds that have been in place around the world have not been as effective in imposing spending discipline as many seem to believe. IMF research has found that there is no statistical evidence that such funds impose any effective expenditure restraint.6 Even if rules are put in place to restrict access to the fund, in the absence of liquidity constraints, a government that wants to finance an increase in current spending can borrow against the security of the fund. Money is, after all, fungible.
Third, stabilisation, consumption smoothing and exchange rate sterilisation are not dependent upon having a sovereign wealth fund. That is to say, these objectives could just as well be achieved within the context of the overall budget strategy.
Fiscal stabilisation can be achieved without drawing on a sovereign wealth fund, as demonstrated in Australia's response to the global financial crisis and international recession.
Consumption smoothing can alternatively be achieved in the Australian context by investments in human capital and high quality public infrastructure or through contributions to individuals' superannuation accounts.
And a country experiencing large gross flows, both inward and outward, of both equity and debt, doesn't have to take an explicit decision to invest the proceeds of fiscal surpluses in foreign assets in order that those surpluses put downward pressure on the nominal exchange rate. That is, using budget surpluses to repay debt, or even to purchase another financial asset domestically, would have the same effect.
Resource rent tax
So where does a resource super profits tax (RSPT) fit in this picture?
Australia is fortunate to have an abundance of natural resources. These natural resources are assets belonging to all Australians, including Australians not yet born. Where we undercharge for the exploitation of these resources the wealth of current and
future Australians is eroded. At present, the charging is effected by a plethora of distorting excises and royalties levied by the Commonwealth, State and Territory governments. In general, royalty adjustments have not kept pace with the value of our resources. Yet there are also many mining projects that are close to being unprofitable but which nevertheless make substantial royalty payments to State governments.
A better designed, more efficient, approach to charging for the exploitation of Australia's natural resources should be able to raise more revenue — that is get a better return for the community — while still attracting more investment. That, after all, is what would make it tax 'reform' rather than just a change in the level of taxes.
The tax review panel recommended that the current royalty based charging arrangements should be replaced with a resource rent based tax. The panel's preferred approach is based on the Allowance for Corporate Capital (ACC), which was proposed by Boadway and Bruce (1984), and is well known to public finance people.
The ACC is part of a small family of taxes which tax only economic rent. Unlike royalties, which tax gross receipts, the ACC, by taxing only economic rents, or supernormal profit, does not distort production and investment decisions. Further, because it is a tax on rents, it should have no impact on prices.7
The ACC recommended by the panel, and subsequently accepted by the Government in the form of the RSPT, would represent world's best practice in charging for the exploitation of non-renewable natural resources.
I know that some of you would have found some of the commentary surrounding the Government's proposal a little confusing. And its theoretical basis would not be familiar to all of you. So I'll spend just a few minutes on that topic. In passing, I should note, however, that some financial market economists obviously do 'get it' – Michael Blythe and his team from CBA in particular. If you haven't had a look at their very clear presentation of the issues, then I would encourage you to do so.8
In concept, the point of departure for the RSPT is the pure Brown tax.
The Brown tax is a pure rent tax, in which investments can be expensed, or written off immediately and a refund provided for the tax value of any negative cash flow — in this way the government effectively finances a share of the investment equal to the tax rate. The government receives the same share of all future net cash inflows. Hence, the government is, effectively, a silent partner in the investment, sharing in costs, risks and returns.
By expensing capital and taxing cash receipts the Brown tax effectively taxes a share of the present value of the project. So, a project that has a positive net present value before tax, that is a project earning economic rents, will remain worthwhile after tax, providing the tax rate is less than 100 per cent.
For a marginal investment - that is, a project with a present value of zero before tax - the present value after tax is still zero. The Brown tax does not tax marginal projects that earn the risk adjusted required return. In respect of infra-marginal projects, it only taxes a share of the returns above what is required in order for the investment to take place.
But the panel did not recommend a Brown tax. Instead, we recommended the ACC. I will not go into the reasons for this today. All I want to do is demonstrate that the two taxes are equivalent, highlighting that an ACC with refundability of the tax value of losses in the event of project failure and an uplift equal to the bond rate is also a neutral tax on economic rent or supernormal profit.
Under the ACC, instead of allowing investment to be immediately expensed, as under the Brown tax, the deduction or tax credit is deferred to a later period. This can be done by allowing losses to be carried forward, allowing assets to be depreciated over time or some combination of both.
However, the deferred tax credit needs to be indexed to ensure its real value is not eroded over time. This begs the question: what is the appropriate indexation, allowance or uplift rate?
The answer to that question depends upon the refundability of losses. In order to preserve neutrality of the ACC with respect to risk taking, which is important given the risky nature of exploration and resource investments, the panel recommended that the tax value of any losses (including the net value of any undepreciated capital) be refunded when a project closes. That is, the panel recommended full-loss offset.
Now, among public finance people, it has been long understood9 that, given a full-loss offset, the appropriate allowance, or uplift, rate for carrying forward unutilised losses (or un-depreciated assets) is the before tax risk-free rate of return. A proxy for the risk-free rate of return is the rate applying to government bonds. As noted by economists George Fane and Ben Smith from the Australian National University, in 1986:
'This is true even if the risk characteristics of the project are such that investors will only undertake it if the expected return on equity is far above the government bond rate'.10
Some of the reactions to the proposed RSPT have suggested that the government bond rate is too low; that it does not reflect the return required due to the riskiness of resource investments; that it does not represent a threshold against which to measure rents; and even that it is inconsistent with basic financial market theory such as the Capital Asset Pricing Model. All of these statements are incorrect.
The source of the confusion seems to be an interpretation of the RSPT as the petroleum resource rent tax (PRRT) with no loading on the government bond rate. The PRRT has a 5 per cent loading in excess of the bond rate for most capital expenditure. So, on that interpretation of the RSPT, it looks much less generous than the existing PRRT. But the interpretation is misguided. The RSPT has a very different structure from the PRRT, most notably in its treatment of losses. Abstracting from the treatment of exploration losses, the RSPT is equivalent to a PRRT that provides a loading in excess of the bond rate at least as large as the project-specific risk premium – whether that risk premium is 5 per cent, 10 per cent, or even 50 per cent.
By the way, the PRRT provides a loading in excess of the bond rate, not because it is trying to define a measure of supernormal profit or rent, but instead, to compensate investors for the risk they may not be able to utilise their tax credits.
Under the ACC, on the other hand, by not providing immediate expensing, but guaranteeing full loss offset, the government is effectively giving the investor a second asset, a guaranteed tax credit that will be paid, with certainty, at some future date. The investor therefore holds two assets:
- a 60 per cent share in a risky resource project; and
- a risk-free asset in the form of a tax credit, with a government guaranteed present value of 40 per cent of the initial investment.
We can compare this with the Brown tax, under which the investor holds:
- a 60 per cent share in a risky resource project; and
- cash equal to the 40 per cent refund from the immediate expensing of the initial investment.
Or with the PRRT, under which the investor holds:
- a 60 per cent share in a risky resource project; and
- a risky asset, in the form of a contingent tax credit for carry forward undeducted expenditure that evaporates if the investment earns insufficient income.
Another way of looking at the tax credit is that it is effectively the same as the government giving resource comp
anies a government bond equal to 40 per cent of the investment costs, but with one difference: unlike a traditional government bond, payment occurs when the project makes a profit or, if the project is unsuccessful, when the project closes.
To understand why the Panel considered the bond rate appropriate, it is useful to consider the two assets separately.
The appropriate rate of return for a resource project will include an appropriate risk premium, say 9 per cent. With a risk free rate of 6 per cent, the required rate of return is 15 per cent.
The required rate of return for the resource project is not, however, the appropriate discount rate for measuring the net present value of the guaranteed tax credit. The appropriate discount rate for the tax credit is the risk-free rate, because, unlike the PRRT, the tax credit is certain.
To ensure investors are neutral between holding the tax credit or another risk-free asset, the appropriate rate of return on the credit (or the uplift rate) is, therefore, the risk-free rate, for which the government bond rate is a proxy.
In effect, as highlighted recently by Michael Blythe's team at the Commonwealth Bank, if a business decides to hold onto the implicit loan to the government, its weighted average cost of capital (WACC) will fall, as the riskiness of its investment portfolio will have been reduced. Of course, if the business decides to cash out the tax credit and invest in other risky projects, its WACC may not fall.
Given refundability of tax losses, an uplift rate higher than the bond rate would over-compensate for the delay in the government guaranteed tax credit. This would be equivalent to the government issuing an alternative debt instrument at the same price as normal government bonds, but paying a higher rate of interest. Aside from creating instability in financial markets, this would generate a significant subsidy for investment in the mining sector and, ironically, create incentives to delay resource production.
To understand why production might be delayed, if the uplift rate were set, say, 5 percentage points higher than the government bond rate, this would represent a subsidy of $20 million per year, for an investment of $1 billion, of which $600 million is at risk. The subsidy would continue to accrue until resource companies decided to produce and generate income, effectively redeeming their implicit government bond. An uplift rate higher than the bond rate would therefore provide an incentive to delay production to maximise the value of the subsidy — which could be as large as $330 million for every $1 billion invested.11
With an uplift rate 5 percentage points above the bond rate, a project that was marginal before tax — that is, a project with zero net present value — could generate a taxpayer funded return of 33 per cent in rents.
The RSPT has important economic effects. By rebating royalties, providing a generous exploration rebate, and financing a cut in the company income tax rate, it reduces significantly several of the features of the present tax system that act to discourage mining investment. The RSPT itself, being a neutral tax, should have little impact on mining investment. Overall then, mining investment is encouraged.
The cut in the company income tax rate has other consequences. Importantly, it encourages all companies to choose more capital-intensive production techniques – supporting stronger growth in real wages by offsetting at least some of the loss of labour productivity due to higher terms of trade.
What happens to the overall pattern of production though, depends critically upon whether, as more capital and labour are drawn into the Australian economy, our total capital-labour ratio rises or falls. And that, of course, depends upon the relative strengths of foreign investment and net immigration in the decades ahead – topics for another day.
Thank you.
1 'The Dutch disease', The Economist, The Economist Newspaper Limited, 265, p82-83, 1977. This phenomenon is also known as the 'Gregory effect' due to the work of Australian economist Robert Gregory, Gregory R (1976), 'Some implications of the growth of the mineral sector', Australian Journal of Agricultural Economics, vol. 20, no. 2, pp. 71–91.
2 Stijn JP, 'Natural resource abundance and human capital accumulation', World Development, 34(6), June 2006, 1060-1083
3 Incidentally, tariff reductions and mineral booms share similar macroeconomic properties: Gregory (1986) ibid.
4 Blanchard O, Dell'Ariccia G and Mauro P, 'Rethinking Macroeconomic Policy', IMF Staff Position Note, February 2010.
5 Frankel J, 'The natural resource curse : a survey', NBER Working Paper Series, March 2010.
6 Davis J, Ossowki R, Daniel J and Barnett S, 'Stabilisation and Savings Funds for Nonrenewable Resources, Experience and Fiscal Policy Implications', Occasional Paper 205, IMF, 2001.
7 The ACC, like the Brown tax is a source based tax. While a source-based tax on economic rents does not distort real investment decisions at the intensive margin, it may affect the location decisions of multinational firms earning firm-specific (and hence mobile) rents.
8 See http://www.commbank.com.au/business/campaigns/federal-budget/2010-Federal-Budget-Economic-Analysis.pdf
9 At least, since Fane, G. and Smith, B. (1986), 'Resource rent tax' in C.D. Trengove (ed.), Australian Energy Policy in the 1980s, Centre of Policy Studies, George Allen and Unwin, Sydney; Fane G. (1987), 'Neutral taxation under uncertainty' Journal of Public Economics, Volume 33, 95-105 and Bond, S.R. and M.P. Devereux (1995). 'On the design of a neutral business tax under uncertainty' Journal of Public Economics 58, 57-71.
10 Fane and Smith (1986) ibid p216.
11 The present value of an infinite income stream of $20 million a year discounted at the risk-free rate – assumed to be 6 per cent.