Downloads
It's a pleasure to speak to you as part of this important conference.
Today, I'd like to talk about fiscal choices and the importance of public debate. More specifically, I'd like to address the emerging gap between the demands placed on all levels of government and the resources available to them.
This debate, which essentially boils down to an exchange of views on the appropriate scope and size of government, should reflect the realities of federation and the fact that most government activities involve the Commonwealth and the States.
The debate should also reflect the importance of maintaining fiscal sustainability across all levels of government. We all, after all, share an interest in ensuring that Australia can continue to withstand external shocks. This interest is highlighted by the current backdrop of a weak global economy.
Community preference for sound fiscal management
In considering Australia's fiscal choices and what these choices mean for thriving 'in a volatile world', to paraphrase the theme of this conference, I should firstly reflect on the factors that contributed to the remarkable resilience of the Australian economy throughout the period spanning the Asian financial crisis in 1997-98, the so called 'tech-wreck' of the early 2000s and the global financial crisis.
Australia's macroeconomic framework - that is, our approach to fiscal policy, monetary policy and the exchange rate - has been a vital contributor. Today, I will focus on the first of these elements: our fiscal policy approach.
Reflecting the community's preference for low debt, we've seen successive Australian governments adopting a prudent approach - a notable difference between us and the US, Japan and Europe.
Commonwealth Budget position over time
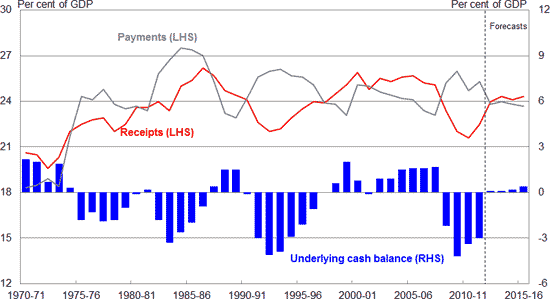
At the Commonwealth level, as shown in this chart, although the budget bottom line has varied from year to year - with both payments and receipts varying significantly- successive governments have been able to address deficits and return the budget to surplus.
Cash Balance of Commonwelath and States
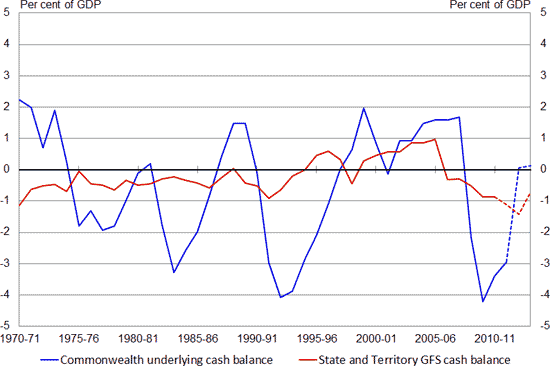
Looking at the state level, the budget position has also varied from year to year; however, the extent of the variation is significantly less than that of the Commonwealth. Reasons for this include: the role the Commonwealth plays in macroeconomic management, such as during the global financial crisis; and the inherently more volatile nature of the Commonwealth tax base.
A commitment to fiscal discipline is a feature of governments in Australia. At the Commonwealth level, the Charter of Budget Honesty, legislated in 1998, is the central plank of the Commonwealth's fiscal framework. The Charter ensures the setting of fiscal policy in a sustainable, transparent medium-term framework, including through the requirement for pre-election economic and fiscal outlooks, and an Intergenerational Report every five years.
Framed in high level principles and objectives, the Charter contrasts with more prescriptive fiscal rules in many other countries. For example, while the Charter requires the Government to articulate a fiscal strategy, it does not mandate the elements of the strategy. It only requires that the strategy be based on principles of sound fiscal management, including by maintaining debt at a prudent level.
For fiscal policies that are temporary in nature - such as those adopted for the purpose of supporting the macroeconomy - the Charter also requires that the Government map out a process for their reversal once economic conditions stabilise.
The 2008 global financial crisis subjected the Charter to its biggest test yet. And it passed. At the time, Ministers were keenly attuned to the impact on the medium-term fiscal outlook and the importance of mapping out a strategy that would return the budget to surplus.
Most States also set out general principles of fiscal management and reporting requirements. Some of these are more prescriptive. NSW, for example, has specific targets in its legislation related to growth in expenses and revenue, and to eliminating unfunded superannuation liabilities.
The Commonwealth obviously has an interest in the fiscal sustainability of the States - excessive levels of sub-national debt can only undermine its own fiscal position. However, instead of imposing strict fiscal discipline on sub-national governments, as some central governments do, Australia relies on financial market scrutiny of state public sector borrowing. This is generally considered successful. While state public finances may not be as strong as the Commonwealth's - largely reflecting relative pre-crisis starting points - State governments have typically adopted conservative fiscal policies. As an open economy in a volatile global context, this approach has served Australia well.
Emerging gap between demands and resources
But Australia's fiscal frameworks are facing another test: the emerging gap between the demands placed on government and the financial resources the community is willing to provide to government.
Changes to the revenue outlook
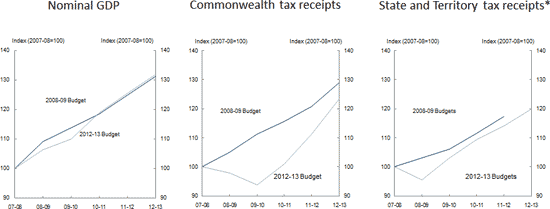
Enlarge the Changes to the revenue outlook chart
As you can see from the chart, while nominal GDP has largely recovered since the global financial crisis, government revenue at both the Commonwealth and state level has not yet recovered to expected pre-crisis levels. And, based on the changes in the relationship between the size of the economy and the amount of tax we collect, we do not expect revenue to return to the levels of the previous decade for some time.
On the payments side, recent policy debates point to growing pressure for new government services, such as the National Disability Insurance Scheme, and substantial reforms to existing services that might involve more spending, such as school funding.
While much has been said publicly about the fiscal pressures from such policies, we should not lose sight of the considerably larger long-term pressures we expect from existing programs, including, in particular, health. The 2010 IGR projected that the growth in health expenditure for the Commonwealth alone would be around three percentage points of GDP over the next 40 years. In 2005, the Productivity Commission estimated that the fiscal gap for federal and state governments combined would be around 6.4 percentage points of GDP by 2044-45; with around two thirds of this gap expected to come from rising health care costs.1
This increase in demand and spending will be driven by the ageing of our population as well as an expected increase in the relative cost of many of these services, partly due to advances in health technologies.
Spending Pressures
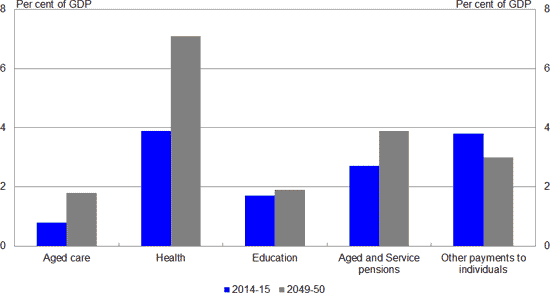
Drawing on projections from the 2010 Intergenerational Report, we also expect Commonwealth spending as a share of GDP to grow significantly in the areas of age-related pensions and aged care.2 On the other hand, spending on other transfer payments to households is projected to decline as a proportion of GDP.
These demand and spending pressures will not only affect the Commonwealth, but will also have a significant impact on the fiscal positions of the States and Territories. Most of the fiscal pressures are in areas of shared responsibilities.
The scope and size of government - a central fiscal choice
How we close the gap between the demands for more and better government services and the resources society is prepared to give government will depend on what, as a society, we decide is the most appropriate scope and size of government. It will also depend on decisions society takes about federal financial relations.
The Charter and fiscal frameworks of the States are silent on these questions. As a central fiscal choice for each government and its constituency, this is a choice that needs to be reached through public debate, rather than being fixed in legislation or determined by policy advisers.
There are a number of considerations regarding the size of government. One is the scope of government activities. These are broad and include the familiar activities of providing public goods and a social safety net, correcting externalities, and imposing taxes, laws and regulations. Governments can also use their balance sheets to take on private sector risks. One example of this was issuing government guarantees to support financial systems during the global financial crisis.
Another consideration in the debate must be the potential impact of government activity on economic growth. History is full of examples illustrating the critical role of a well-functioning government in promoting growth. But many argue that governments beyond a certain size will constrain, rather than promote, growth. Such concerns tend to centre on the economic costs of taxation; the potential for public sector productivity to be lower than the private sector's; and the burden of excessive regulation.
Yet another consideration is equity and the appropriate size of the so-called 'welfare state'. What level and duration of unemployment benefits are acceptable? What level of support should be provided to pensioners and families? Should the age pension be means-tested? What should be the extent of public subsidy for health care?
And then there is the question of 'paternalism'. That is, when should the government intervene to influence what the market would otherwise provide and individuals would otherwise choose. One topical example of this is the role of government to address obesity.
In short, the scope and size of government is a question of public choice. It is a question of broader wellbeing and the trade-offs people are willing to make between efficiency, equity and risk.
Notably, size of government has been a central issue in the current US presidential campaign.
It's not surprising, then, to see the size of government vary across countries and time.
Government tax revenue
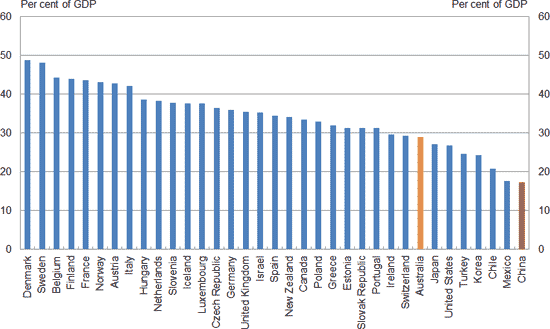
Comparing countries, if we measure government (including sub-national levels) in terms of tax revenue, Australia's general government sector is slightly larger than in the US and Japan, but lower than in Europe, particularly Scandinavian countries.
I want to stress, however, that data on tax revenue or spending can never fully capture the impact government will have on an economy. Most notably, this measure will not account for activity of state-owned enterprises; it hides the use of tax concessions; and it does not capture the impact of government regulations (including mandated superannuation contributions).
Perhaps the best way to illustrate this issue is to point out that Australia's tax revenue to GDP ratio is significantly larger than China's. Yet it's unlikely anyone would argue that the Chinese Government has a smaller per capita economic footprint.
Size of Government in Australia
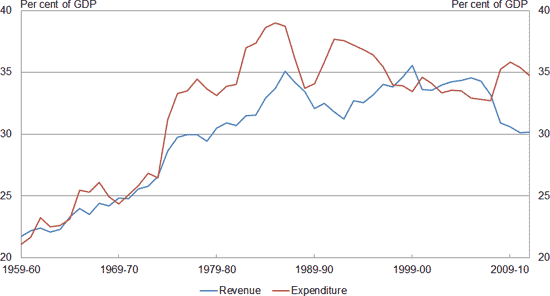
That said, comparing Australia over time, there was a significant rise in both the scope and size of government in the 1960s and 1970s due to, for example, increases in transfer payments to households and the introduction of universal medical coverage.
While the average level of government spending and revenue has been broadly stable since then, there have still been significant changes in the role of government, most notably the successive privatisation of publicly-owned assets.
Allocation of expenditure between the Commonwealth and the States
Another consideration in a federal structure is how activities should be shared between different tiers of government.
- One school of thought deems the level of government closest to the community best placed to understand community preferences and circumstances, therefore delivering goods and services more efficiently.
- Another school of thought suggests that revenue sources and expenditure responsibilities be broadly aligned.
- A further perspective is that services should be provided by the level of government in which the benefits accrue. Under this approach, the higher level of government should provide services where the benefit extends across states.
While theory can provide sound principles for the carve-up between governments, in some policy areas, these principles can be at odds with each other. It may therefore not be immediately clear which level of government is more suited to provide public services.
Composition of Australian Government and state spending, 2012-13
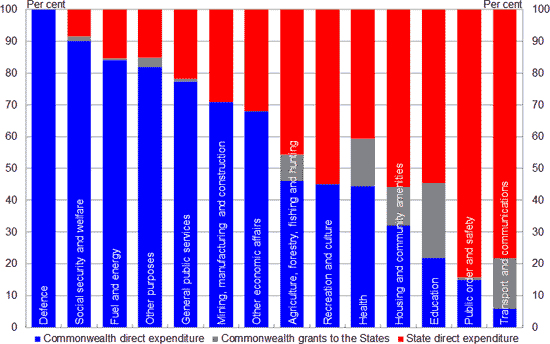
And by looking at areas of spending by Australian governments, this chart shows there are very few areas of spending that are the responsibilities of only one tier of government.
Vertical Fiscal Imbalance
Commonwelath Grants as a proportion of total State revenue
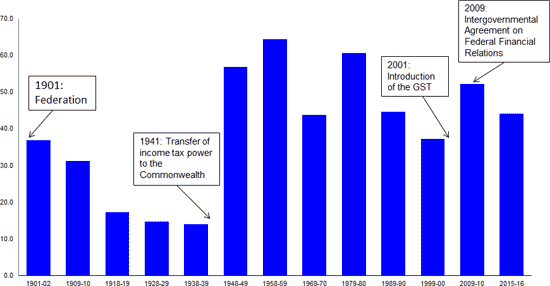
A key contributor to this split of responsibilities across levels of government is Australia's high level of vertical fiscal imbalance - that is, the states are highly dependent on Commonwealth funding. The imbalance can be seen in this chart on Commonwealth grants as a proportion of total state revenue. The proportion has been relatively steady at around 40 to 50 per cent since the late 1980s.
It has been argued that a closer matching of revenue raising and expenditure responsibilities across levels of government could improve accountability and the efficiency of service delivery. However, this high level of Commonwealth support to the States has been long-standing and it may, in fact, not be a cause for concern.
There are benefits of centrally collecting taxes such as the GST. Further, States can still raise revenues from their own sources, which provides them with the ability to make spending and taxation decisions at the margin.
My main focus today, though, is not so much which level of government raises taxes or funds services, but rather the whole-of-nation fiscal position. What matters most is ensuring the fiscal positions of both the Commonwealth and the States are sustainable.
Part of the solution must undoubtedly lie with increasing the efficiency of spending and taxation, including in some very sensitive and complex areas. Health is a good example here. As noted earlier, the combination of demographic change, growing community demand, and increasing costs will result in greater health expenditure, regardless of how responsibilities
are split between the Commonwealth and the States.
Given these expected health cost pressures, recent measures - like means testing the Private Health Insurance rebate and last week's MYEFO measures designed to ensure that the rebate grows at a more sustainable rate - will be the sorts of policy choices facing governments at all levels.
Underlying cash balances projected to 2022-23
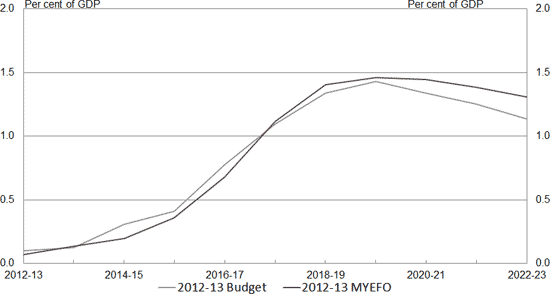
To illustrate the impact, the measures taken at MYEFO provide the majority of the improvement in the underlying cash balance in the next 5-10 years, when comparing these estimates to those from the 2012-13 Budget.
Another example is the gains that can be achieved by increasing the efficiency of our collective tax bases. For example, a relatively efficient tax like council rates is estimated to have a marginal excess burden of around 10 cents in the dollar. In contrast, our most inefficient taxes are similarly estimated to have a marginal excess burden of around 70 cents in the dollar. This means that if we could replace a billion dollars in revenue from the most inefficient taxes with a billion dollars from the most efficient taxes, Australians could be up to $600 million better off every year, in perpetuity.3 These are gains well worth seeking.
Australians clearly face some big choices.
Conclusion
Let me end where I began.
The Commonwealth and the States have a shared interest in encouraging a considered public debate on what services government should provide and with what resources. The debate will not be straightforward.
Survey data typically suggest that the public wants more services but a smaller government,4 and technological change and the diminishing role of traditional media channels have changed how the community becomes engaged in such debates.
Avoiding the debate, however, is not an option. We need only look at the experiences of Europe and the US to learn that it is dangerous to postpone making such decisions. The choices available to us as a nation will narrow and governments might be forced to take bold action at a time of economic weakness.
Thank you.
1 Productivity Commission, 2005, Economic Implications of an Ageing Australia.
2 This chart does not take into account the impact of the National Health Reform agreement under which the Commonwealth will increase its contribution to efficient growth funding for hospitals. In addition, growth in Commonwealth aged care expenditure is likely to be more than reflected in the chart as a result of the aged care reforms.
3 KPMG Econtech 2009, CGE Analysis of the Current Australian Tax System, KPMG, Canberra.
4 Essential Media poll, April 2 2012.