Downloads
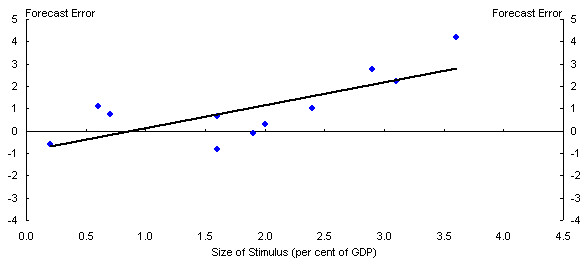
The 2010-11 Budget Paper 1 (pages 2-23 and 2-24) reports the results of a regression, for 2009, of the size of the fiscal stimulus, as a per cent of GDP, against the extent to which actual GDP growth exceeded the IMF April 2009 forecast. The regression uses data from 11 countries: the G7 plus Australia, Brazil, China and Korea, and reports the slope coefficient as highly significant (Chart A and Table A).
Chart A: Fiscal Stimulus and IMF Forecast Error – from 2010-11 Budget

Source: IMF World Economic Outlook April 2009 and April 2010, IMF Fiscal Monitor November 2009.
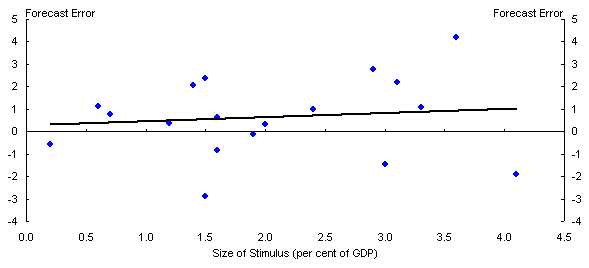
Professor Sinclair Davidson of RMIT has pointed out that, when the dataset includes all 19 countries of the G-20 (rather than being restricted to the 11 countries used for the regression reported in the Budget), the estimated slope on the regression line is much flatter, and the coefficient becomes statistically insignificant (Chart B and Table A) (http://catallaxyfiles.com/2010/05/13/did-the-stimulus-work/).
Professor Davidson is correct. Before publishing the results in the Budget, the regression result for the full sample of 19 countries was checked. Unfortunately, however, an error was made and the erroneous conclusion was drawn that the results for the restricted sample did not differ, to any material extent, from those for the full sample.
Chart B: Fiscal Stimulus and IMF Forecast Error – G20 Economies

Source: IMF World Economic Outlook April 2009 and April 2010, IMF Fiscal Monitor November 2009.
It is of interest to also report results using samples of countries that are more alike than the wide range of countries in the G-20. A common way to do this is to restrict the analysis to OECD countries, which also has the advantage that more closely comparable data are available.
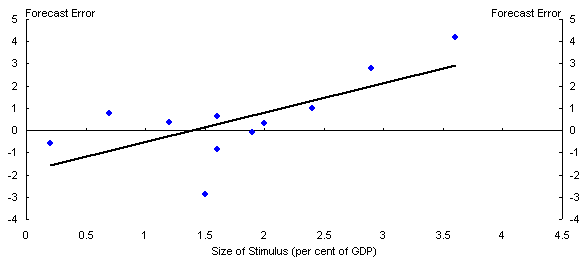
When the analysis is restricted to the 11 OECD members of the G-20 (the G7, Australia, Korea, Mexico and Turkey), the slope coefficient in the resulting regression is positive and statistically significant (Chart C and Table A).
Chart C: Fiscal Stimulus and IMF Forecast Error – OECD members of G20

Source: IMF World Economic Outlook April 2009 and April 2010, IMF Fiscal Monitor November 2009.
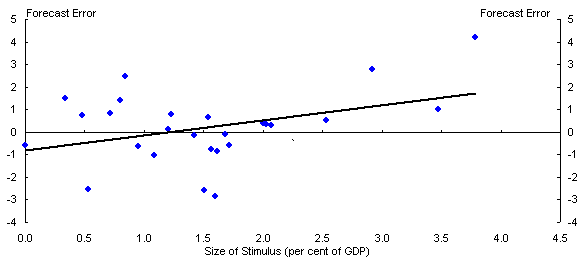
Alternatively, the analysis can be performed using all OECD countries. Before doing so, it is worth noting that four OECD countries (Greece, Hungary, Iceland and Ireland) were forced to tighten fiscal policy in 2009, because of their dire fiscal circumstances. In the following regression, these four countries are excluded because their extreme circumstances are not relevant to the question of whether countries that implemented sizeable fiscal stimulus outperformed growth expectations to a significant extent relative to those that did less. In the resulting regression, the slope coefficient is positive and statistically significant (Chart D and Table A).1
Chart D: Fiscal Stimulus and IMF Forecast Error – OECD Economies

Source: IMF World Economic Outlook April 2009 and April 2010, OECD Economic Outlook June 2009.
Table A: Cross-country regression results
Dependent variable: Actual 2009 real GDP growth minus the IMF April 2009 forecast
Independent variable: Size of fiscal stimulus (per cent of GDP)
| Budget sample |
G20 | G20 OECD |
OECD | |
|---|---|---|---|---|
| Coefficient on Fiscal Stimulus | 1.03 (0.01) |
0.19 (0.62) |
1.33 (0.02) |
0.67 (0.05) |
| Constant | -0.88 (0.22) |
0.28 (0.74) |
-1.85 (0.08) |
-0.81 (0.17) |
| R-squared | 0.55 | 0.01 | 0.48 | 0.15 |
| Countries | 11 | 19 | 11 | 26 |
Numbers in parentheses report p-values (the probability of accepting the null hypothesis that the coefficient is zero). The OECD sample excludes those countries (Greece, Hungary, Iceland and Ireland) that were forced to implement tighter fiscal policy in 2009 due to their dire fiscal circumstances (see text).
Sources: IMF World Economic Outlook, April 2009 and April 2010; IMF Fiscal Monitor, November 2009; OECD Economic Outlook, June 2009.
A similar analysis, conducted by the US Council of Economic Advisers, but using different forecasts, and examining June quarter 2009 forecast errors, also found statistically significant relationships between fiscal stimulus and the extent to which economic outcomes exceeded forecasts
http://www.whitehouse.gov/assets/documents/CEA_International_Fiscal_Policy_Report_FINAL.pdf.
To summarise, then, as Professor Davidson has pointed out, there is no statistically significant relationship for the 19 G-20 countries, in 2009, between the size of the fiscal stimulus, as a per cent of GDP, and the extent to which actual GDP growth exceeded the IMF April 2009 forecast. For the more closely comparable 26 OECD countries that applied fiscal stimulus in 2009, however, there is a statistically significant relationship, with those countries that applied more stimulus significantly outperforming forecasts relative to those countries that did less. The US Council of Economic Advisors has arrived at a similar conclusion, using different economic forecasts and different samples of countries.
1 For completeness, note that including Greece, Hungary, Iceland and Ireland in the regression generates a statistically insignificant slope coefficient. This result is driven by Iceland. The Icelandic financial system collapsed in 2008 and economic output collapsed in 2009, falling by 6.5 per cent, though this outcome was better than had been expected by the IMF in April 2009. Given Iceland's dire circumstances, it is possible that fiscal consolidation may have improved economic prospects somewhat, as suggested many years ago by Giavazzi and Pagano (NBER Macroeconomics Annual 1990). Whether or not it did so, the extreme circumstances faced by Greece, Hungary, Iceland and Ireland are not relevant to the question at hand.
Data on the size of the stimulus for OECD countries is obtained from the June 2009 OECD Economic Outlook. Forecast errors are again calculated using IMF April World Economic Outlook data from April 2009 (for the forecasts) and April 2010 (for the outcomes).