Downloads
[Note to readers: much of the material in the section "Unusual aspects of the crisis" was not presented at the Australian Business Economists function, but is provided here for further context.]
Good afternoon. It is a pleasure to be with you once again. I first spoke to this group eight years ago, in May of 2001. This is, therefore, the ninth Budget I have had an opportunity to discuss with you.
It's fair to say that this year's Budget has presented special challenges.
The Government's objective has been to support growth during the downturn, while at the same time preserving the credibility of the medium-term fiscal strategy, of surplus on average over the economic cycle.
The extraordinarily weak global economy has energised governments across the world to take fiscal policy action to support demand. All these governments have their critics — those who counsel them to sit on their hands and let the private sector work things out for itself. Even more extreme are those critics who, having learned nothing from history, are enjoining governments to take action to ensure that budgets are balanced in these precarious times.
Notwithstanding the critics, in most countries, very large fiscal packages have been designed by governments, legislated by parliaments and are being implemented by public servants at a speed that suggests that a sufficient number of the world's leaders have learned something from history.
That 'sufficient number' has also been very busy on other fronts. For example, even before announcing its first fiscal stimulus package, the Australian Government took extraordinary action to stabilise financial markets with unprecedented guarantees of bank liabilities. These packages, too, have been crucial in helping to put a floor under confidence and demand. And they, too, have their critics.
A lot has happened since I spoke to you last. And there has, surely, been more talk and more writing about macroeconomic issues and macro policy requirements in the past twelve months than in the entire seven years that preceded it.
And yet, when the country's best communicator of economic material — I am, of course, referring to our friend Ross Gittins — confesses that this is 'the most puzzling, back-to-front budget I can remember', it is clear that we have a communications problem. In his column the day after the Budget, Ross explained the communications challenge very well. 'It's as though we're planning the clean-up after the cyclone, even before the cyclone's hit', he said. And he went on to say, 'we seem to have been viewing the recession through binoculars. We were cutting interest rates and applying budget stimulus long before it arrived on our shores. And now the recession is yesterday's problem and we're planning what we'll do in the recovery.'
So, on top of the challenge of designing a budget for the most difficult macroeconomic circumstances in many decades, there is also the communications challenge. Some budgets speak for themselves. This one, apparently, does not.
The particular challenge identified by Ross is not an unexpected one. The challenge can be found in the Charter of Budget Honesty Act, legislated twelve years ago. All of you would know that the Act requires the Government to outline its fiscal strategy, specifying fiscal objectives and targets and expected outcomes for key fiscal measures. We have become accustomed to Australian budget documents containing that medium-term fiscal strategy material. But we don't have any experience of another requirement of the Act, and I'm not sure that many of you would even be aware of it: this is the requirement that the Government's fiscal strategy statement 'specify fiscal policy actions taken or to be taken by the Government that are temporary in nature, adopted for the purpose of moderating cyclical fluctuations in economic activity, and indicate the process for their reversal.'
Of course, this statutory requirement doesn't necessarily give us Ross' problem. If the temporary fiscal action were taken after the recession had hit, instead of being pre-emptive, there would be no communications problem. If the Government had waited for the recession to hit our shores before tackling it — and there are some who consider that this is precisely what they should have done — then you wouldn't have had anything like last week's document to confuse you. Things would have been much simpler.
That wouldn't have made Ross happier, of course.
In reading Ross' column I couldn't help but think about the relative simplicity of the communications challenge in that other area of macroeconomic policy – monetary policy. In that area, too, the practitioners who know their stuff seek to behave pre-emptively. But, having adjusted the cash rate in either direction, there is no expectation — and certainly no statutory requirement — that the monetary authority will also announce precisely how, and over what time period, it intends reversing that adjustment. Markets will make judgements, of course; and sometimes the monetary authority will see an advantage in saying something about the likely future course of interest rates, but it is under no obligation to do so.
Rather, we have become content to judge the monetary authority on outcomes, awarding credibility on the basis of actual economic performance over the medium-term. The Charter isn't so sanguine about fiscal policy. There might be good reason for that — although I would have to say that the historical record on fiscal policy is so distorted in the public mind that one should wonder. I'll have more to say about this in a moment.
In any event, it certainly wasn't because of the requirements of the Charter of Budget Honesty Act that the present Government, confronting the task of explaining a large budget deficit, came to the view that it needed also to explain how that deficit would be wound-in over time. With the budget going into deficit, the Government considered that it had to explain to the public how the medium-term fiscal strategy, of surplus on average over the cycle, was now going to be achieved. Indeed, not only did it see a need to tell a medium-term fiscal consolidation story in the same chapter in which it was talking about the need for fiscal stimulus, it also saw a need to relate both things to the 40 year fiscal sustainability issues raised in the 2002 and 2007 intergenerational reports. It even decided that the next IGR should be brought forward — to be released before the 2010-11 Budget.
This is story-telling of extraordinary complexity. And while it hasn't tested Ross, it clearly has exceeded the reading age of many.
Consider, for example, the reporting of the budget in the Wall Street Journal Asia last week. According to that reporting, in all of the decisions taken by the Government in response to the global recession, the only ones that will have any stimulatory impact on the economy are the 'tiny' personal income tax cuts announced in the 2008-09 Budget. The journal also informs its unfortunate readers that revenue downgrades alone would not have driven the Australian budget into deficit. And to cap it off, readers were told, in what is surely one of the most ironic sentences ever uttered in macroeconomic analysis, that '(t)his Keynesian revival comes at a particularly bad time, given that tax revenues are falling as the economy slows, a normal feature of economic downturns'. Apparently, the right time for a 'Keynesian revival', involving the spending of large amounts of public money, is when tax revenue is strong and rising, a normal feature of economic boom times.
As you know, I don't always agree with Australian commentators. But our newspaper readers can be thankful that they don't often have to confront material that is quite that bad.
Of course, this budget is telling a big story; made especially large by the fact that, for the first t
ime, it seeks to integrate stories in three time periods: the four year forward estimates period; a 12 year medium-term; and a 40 year IGR time-frame.
The construction of this story wasn't left until all the decisions had been taken, and put together a few hours before the budget went off to the printers. Its architecture was put together before any of the big decisions were taken.
Most of those 'big decisions' were formulated in the Strategic Priorities and Budget Committee of the Cabinet. The senior ministers involved in that committee agreed very early on that their task had three dimensions: first, to deliver sufficient fiscal stimulus to ameliorate the short-term impact of the downturn; second, to demonstrate a firm commitment to the medium-term fiscal strategy, despite radically altered circumstances; and third, to ensure that any decisions with adverse consequences for the long-term budget position were offset fully over the 40 year IGR time-frame.
So, in just about every meeting, senior ministers had three sets of tables and charts in front of them recording the impact of their decisions in each of those three timeframes. These were not mere props. They framed the decision-making.
Unusual aspects of this crisis
There are several distinguishing features of this global slowdown that had an impact on ministers' thinking.
The first is the recession's origin in global financial markets. According to the IMF, the sub-prime crisis in the United States has triggered credit write-downs on US-originated assets that now sum to around $2.7 trillion. It has also led to a collapse in confidence in the world's major financial institutions. Many of these institutions have required large amounts of government support to continue operating; some are simply no longer operational at all. There is no modern precedent for such a financial meltdown.
The peculiar origin of the crisis meant that the economic slowdown hit financial institution balance sheets and credit markets first. Usually, these are not impacted until some time into a recession, as loan defaults mount up.
Because the slowdown hit in this way, the Australian Government had already taken action that necessarily exposed the public sector balance sheet to its effects even before having taken its first decision to spend anything. Those actions — principally in the form of guarantees — have placed an added discipline on the Government's spending and taxing decisions. It is certainly true, as many have noted, that the Government had a strong balance sheet to work with – but it has also had to accept some extraordinary contingencies onto that balance sheet. This is not a textbook exercise in expansionary fiscal policy.
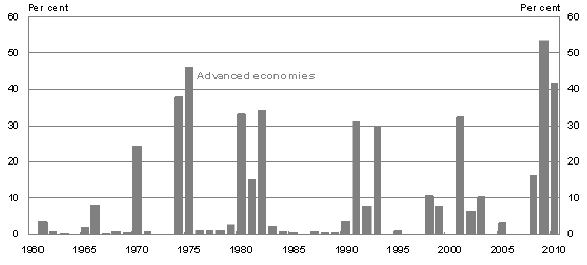
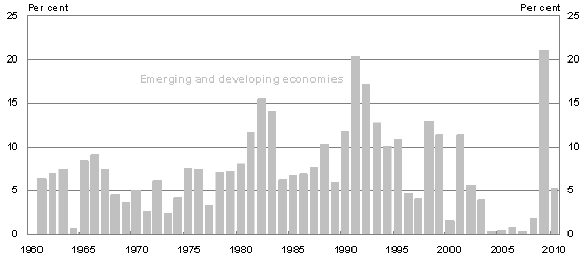
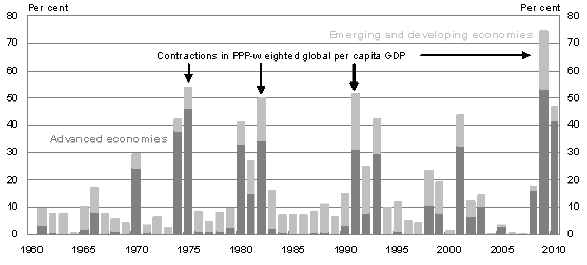
Figures One to Three show another unusual feature of this recession. In the main it is the advanced countries that are under the most pronounced pressure.
Figure One: Countries experiencing recessions (advanced economies)
Note: Purchasing-power-parity weighted per cent of countries.
Source: IMF.
The dark shaded bars illustrate the pressure being placed on advanced countries. The percentage of economies that are contracting is higher than at any time since the 1960s, and the expected duration is relatively long.
Figure Two: Countries experiencing recessions (emerging and developing economies)
Note: Purchasing-power-parity weighted per cent of countries.
Source: IMF.
The light shaded bars — for developing countries — do not show such an unusual pattern for this recession.
Figure Three: Countries experiencing recessions
Note: Purchasing-power-parity weighted per cent of countries.
Source: IMF.
Looking at the dark and light shaded bars together, we can see the high level of synchronisation in this crisis. Around 75 per cent of countries are expected to contract in 2009. This is the highest level of synchronisation in the 50-year history presented in the chart.
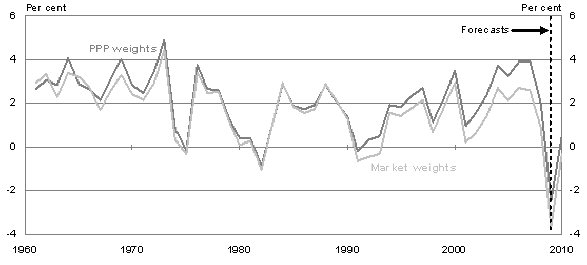
The third unusual characteristic of this global recession is its depth. Figure Four shows the expected fall in global real GDP per capita. As you can see, the impact of this downturn is markedly worse than others.
Figure Four: Real per capita world GDP growth
Note: Data for 2009 and 2010 are IMF April 2009 WEO Forecasts.
Source: IMF.
The world economy is expected to contract by around 1½ per cent in 2009 — its first contraction in 60 years. For advanced economies, the contraction will be in the order of 3¾ per cent. For our major trading partners, we expect a contraction of around 2 per cent.
Global industrial production is expected to fall by almost 6¼ per cent. This compares with an average of 2 per cent in the recessions of the 1970s, 1980s and 1990s. In March this year, car sales in major developed economies had fallen by more than 25 per cent from their levels at the end of 2007.
In 2009, global trade is expected to shrink by 11 per cent, a contraction without precedent in the post-war period.
Unemployment is expected to rise sharply. In the United States it has already risen to 8.9 per cent. In that country, more than 5.7 million jobs have been lost since December 2007.
So we have a slowdown that starts with a financial crisis; hits developed countries harder than developing ones, but is nonetheless exceptionally well synchronised; and promises to be the deepest in memory. What are the implications for the world economy?
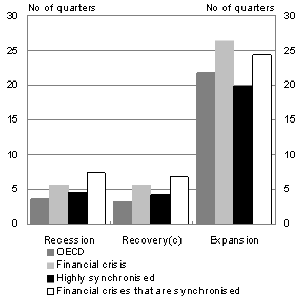
As the IMF has recently pointed out, financial crises and synchronisation are both associated with recessions that are longer and deeper, and that exhibit a weaker recovery.
Figure Five illustrates the duration and amplitude of previous cycles. The chart on the left shows the typical duration of different types of recessions. The white bar represents financial crises that are highly synchronised. You can see that this type of recession typically lasts for longer.
The chart on the right shows the typical amplitude. The white bar shows that the decline in GDP is typically more severe in synchronised recessions — a fall of around 5 percentage points from peak to trough.
Figure Five: Duration and amplitude of previous cycles
Duration (a)
Amplitude (b)
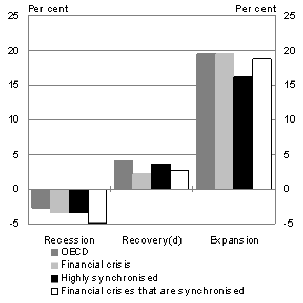
Note: (a) Duration is the number o
f quarters from peak to trough for recessions. (b) Amplitude is the percentage change in output from the peak to the following trough of a recession. (c) From the trough, recovery is the number of quarters taken for output to reach the previous peak. (d) Recovery amplitude is the percentage change in output in the four quarters following the trough.
Source: IMF.
But it's not all bad news. The IMF has also found that fiscal stimulus can be particularly useful in shortening recessions associated with a financial crisis. Fiscal policy also has an advantage in synchronised recessions — if many countries are deploying it, then leakage becomes a benefit rather than a problem.
Economic outlook for Australia
Where does this leave Australia?
Here, the story of the global financial crisis has been somewhat different from elsewhere. Our banks remain strong. Households have not been as vulnerable here. In particular, housing has, to date at least, looked to be on a much stronger foundation.
The strength of the financial system, underpinned by extensive public guarantees, has provided our economy with a measure of protection as the global financial crisis has morphed into the global recession. But the financial crisis had already put considerable downward pressure on demand, including by sapping consumer and business confidence, and slashing the value of household wealth — during 2008, household net worth in Australia fell by more than 8 per cent. Now, as the recession entrenches itself in our trading partners, we are feeling the effects of their lower demand for our exports.
We expect exports to fall by 4 per cent in 2009-10, consistent with a drop in world trade. This fall in exports is a major factor behind our down-grading of the budget forecasts for that year. But so far Australia has not been as sharply affected as other countries. Our export volumes contracted by one per cent in the second half of 2008; the US, Canada and New Zealand experienced six per cent contractions.
Australia's performance in export values compares even more favourably with other advanced economies. While some of our major trading partners such as China, Korea, Japan and the United States recorded contractions in their export values in the second half of 2008, averaging around 10 per cent, Australia recorded a 19 per cent increase in export values over this same period.
In the coming financial year, we expect the terms of trade to fall by 13¼ per cent. This is a large drop. But it takes the terms of trade back to the levels experienced in 2006-07 — still well above the long run average.
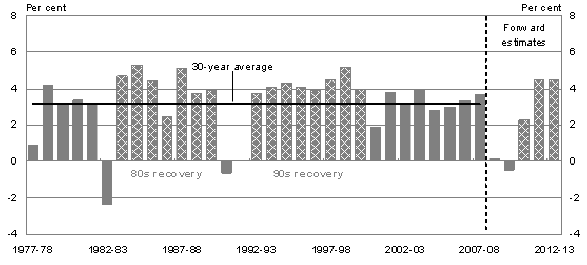
Figure Six shows the expected path for GDP. You can see that we are forecasting a contraction in real GDP in 2009-10 — in the order of ½ of one per cent. This is driven principally by sharp falls in business investment and exports. Also contributing is a fall in household consumption. Acting as a buffer is strong growth in public investment. We expect to see real GDP gradually recover in 2010-11, with growth of around 2¼ per cent, followed by two years of growth at 4½ per cent.
Figure Six: Real GDP growth
Source: ABS Catalogue Number 5206.0 and Treasury.
The growth projections in Figure Six cover the four year forward estimates period. In this budget, we have integrated that four year story with a medium-term set of growth projections – out to 2019-20. The work is described in Budget Statements 3 and 4.
This is not straight-forward work. And it necessarily involves considerable judgement. Because we don't often position the budget in such a long multi-year timeframe, we expected that some of our readers would have some difficulty with the concepts.
Even so, I have to say that I have been a little surprised by some of the quite peculiar things that have been said and written about our medium-term growth projections. And just in case there is any doubt – and there has been some commentary that may have seeded such doubt – let me make it quite clear that these are the Treasury's numbers. They are also the Government's numbers, of course.
We have forecast zero growth in 2008-09, negative growth of ½ per cent in 2009-10 and growth of 2¼ per cent in 2010-11. We have then projected two years of growth of 4½ per cent, followed by four years of growth of just under 4 per cent, falling to 2¾ per cent in the next year, 2017-18.
Other commentators have given the impression that our projections would, if realised, produce a period of unprecedented growth. One of our leading private sector economists – a person for whom I have a great deal of respect – has been quoted as saying that he couldn't recall any previous six years of above 4 per cent growth since the 1960s.
The 1960s produced seven years of growth above 5 per cent. For the eight years 1962-63 to 1969-70, growth averaged 5.9 per cent. But it didn't actually produce six consecutive years of above 4 per cent growth; in 1965-66 growth was only 2.4 per cent.
In the seven years 1983-84 to 1989-90, there were four years of growth above 4 per cent, and an average growth rate of 4.23 per cent. And in the seven years from 1993-94 to 1999-00 there actually were six years of above 4 per cent growth. These years were not consecutive, however; 1996-97 spoiled the party by recording 3.9 per cent. The seven year average was 4.3 per cent.
Some commentators have argued that, even if history would support a six year period of growth averaging in excess of 4 per cent, this cycle will be much weaker because of the special character of this particular recession. What is most interesting about these arguments is that they are often accompanied by extensive quoting of our own material published in Budget Statement 4. It's as if we failed to take account of our own analysis. I'll return to these 'special character' issues in a moment.
Yet others seem to think we must have simply plucked the numbers out of the air.
So let me tell you what we actually did. It's a bit complicated. But not too complicated, I'm sure, for this audience.
I've already outlined some of the context for this work. But a quick re-cap: We developed the medium-term scenario to provide parameters for the medium-term projections of the budget balance. The latter are required to span the gap between the four-year forward estimates period and the 40 year projections contained in the intergenerational reports.
In spanning the gap we also wanted to reconcile the short and medium-term GDP trajectory with the long-term projections contained in our IGR modelling. Call us fastidious if you like, but we don't like discontinuities in our economic projections. We wanted to be sure that we were describing a medium-term scenario that is consistent not only with the short-term forecasts, but also with the long-term IGR projections.
The approach is predicated on a gradual recovery in aggregate demand in the final forecast year (2010-11), after which the supply-side drivers of the economy take over.
This is how we went about it. First, recall that we can describe GDP growth using a number of different decompositions. Usually, we employ the components of aggregate demand to tell the story. But increasingly we have used the supply-side decomposition that isolates changes in the following key variables: (1) the population aged 15-plus; (2) the participation rate; (3) the employment rate; (4) average hours worked; and (5) labour productivity. All of these things are cyclically sensitive, including the first because of the cyclical sensitivity of immigration.
We can obtain an index o
f real GDP simply by multiplying together these five things. Without going through that laborious exercise, though, consider Table One, which sets the variables out in a familiar way. I haven't included average hours worked. We have it flat in 2011-12 and 2012-13, then falling slightly in every subsequent year.
The weak GDP growth rate forecast for 2010-11 can be explained as follows. Despite relatively strong productivity growth of 2½ per cent, and the population aged 15-plus growing by 1¾ per cent, GDP growth is only 2¼ per cent. Weak demand sees both a fall in the participation rate (which subtracts about 1 percentage point), and an increase in the unemployment rate from 7½ per cent to 8½ per cent (which subtracts another percentage point).
As we move into 2011-12, however, growth strengthens sharply: productivity growth is weaker, but still a healthy 2 per cent; the growth in population aged 15-plus is also weaker, but still a healthy 1½ per cent; the participation rate is unchanged; and the unemployment rate falls by one percentage point. You might be interested to know that in coming out of the recessions of the early 1980s and 1990s the unemployment rate fell by about a percentage point a year for the first two years. Taken together, these factors produce a GDP growth rate of 4½ per cent.
That pattern is repeated in the following year, 2012-13. Then in each of the following four years the unemployment rate falls by only one-half of a percentage point a year; productivity growth slows to only 1½ per cent; and the participation rate adds half a percentage point a year. These factors produce annual growth of 4 per cent.
Table One: Contributions to GDP growth (year-average per cent)

Source: Treasury.
The productivity growth rate of 1½ per cent is less than that used in the two IGRs published to date. It is the actual backward-looking 30-year average. The profiles of the unemployment and participation rates over the period 2013-14 to 2016-17 weren't plucked out of the air either. They ensure that by the end of that period, potential GDP is back on the long-term trajectory contained in our IGR modelling, having spent nine years from 2008-09 below that trajectory. By 2016-17 the output gap has closed, with an unemployment rate of 5 per cent and a participation rate consistent with the labour force models used in the IGR projections.
Before leaving Table One, let me just draw to your attention the final row of the table, which shows growth in nominal GDP. It is of course nominal GDP, not real GDP, that is relevant for taxation revenue, and therefore relevant to the question of when the budget might return to surplus. After collapsing in 2009-10 with the big fall in the terms of trade, growth in nominal GDP recovers over the forward estimates, but not back to the heady rates of 7 or 8 per cent seen earlier in the decade when the terms of trade were rising strongly. In fact, over the decade from 2013-14, we are projecting continued gradual falls in the terms of trade which reduce growth in nominal GDP by ¼ per cent in each year of that decade. There has been precious little reporting of that fact; none, obviously, by those who had already made up their minds that our forecasts and projections were overly optimistic.
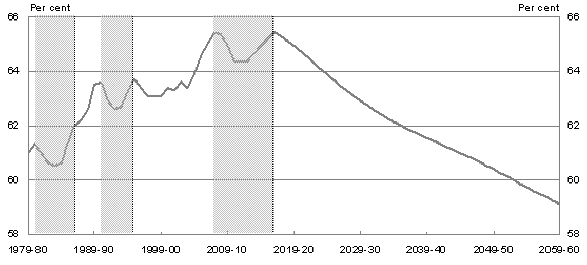
Let me turn now to the long-term trajectory of the participation rate, which is presented in Figure Eight. You have been looking at charts like this for many years now. They show how the ageing of the population, consequent on the collapse in the birth rate in the 1960s and 1970s, is about to have a pronounced negative impact on trend workforce participation rates.
The shaded areas in Figure Eight identify the impacts of the recessions of the early 1980s, 1990s and the present period. You can see that the reduction in the participation rate in our forecasts is sharper than what actually happened in the 1980s and about the same as in the 1990s. And, once the participation rate begins to recover, it does so at a slower rate than in those two earlier periods. You can also see, though, that the main reason why it takes longer on this occasion to rejoin the long-run trajectory is that we have held the participation rate constant in 2011-12 and 2012-13. That is, we have delayed the recovery. Apparently, many of you think this too optimistic. I don't.
Figure Eight: Participation rate
Source: ABS Catalogue Number 6202.0 and Treasury.
I might add that, having approached the projections exercise in this way, we were a little surprised to hear some commentators suggesting that our projections were too optimistic because they failed to account for the impact of imminent population ageing.
Of course, some of you will be wondering whether we haven't been too optimistic in our trajectory for the unemployment rate – that we should have held the output gap open for longer than nine years. Or perhaps you think we are in for a prolonged period of exceptionally low productivity growth.
Certainly, there are reasons to think this way. As I mentioned earlier, the character of this recession is particularly unpleasant — the evidence is that synchronised recessions associated with financial crises are deep and long. Further, household balance sheets are more vulnerable in this downturn.
On the other hand, there are some striking differences working in our favour this time.
The economy is significantly more flexible. Policy frameworks are more robust and credible, and inflation expectations are better anchored. The fiscal and monetary policy response has been stronger and faster — lower interest rates, infrastructure-related activity and consolidating household balance sheets will help to boost confidence and activity as the Australian economy enters the recovery phase. Importantly, consumer confidence has been much better preserved in Australia than in other countries.
There has also been some misunderstanding of the implications for Australia of this global recession being associated with a financial crisis. It is true that in most of the world this coincidence presents a set of circumstances that is considerably worse than that of earlier recessions. But Australia's position is very different. In the early 1980s our financial system was poorly developed. Then, unlike the rest of the world, we did have such a coincidence of real economy weakness and financial crisis in the early 1990s. That boom-bust episode placed Australia's banks in a much more vulnerable position than they are in today. In the five years to 1993, overall loan losses in the banking system amounted to more than 5 per cent of one year's GDP. Two of the 'big four' suffered overall group losses; the first recorded by either institution. This time around, in contrast to much of the developed world, our financial system is strong.
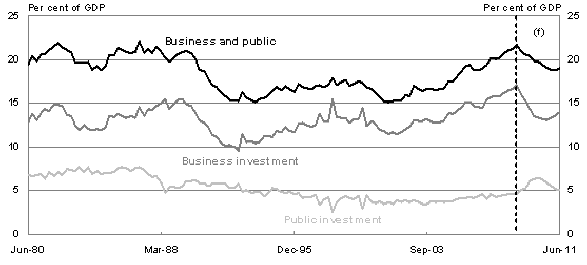
Recent business investment and public investment that is coming online is also likely to contribute more to productivity than in previous cycles.
Figure Nine: Business and public investment
Source: ABS Catalogue Number 5206.0 and Treasury.
The boom of the late 1980s was characterised by significant investment in the commercial property sector of the major cities. This invest
ment ultimately provided little benefit to productive capacity when asset prices collapsed in the early 1990s, leaving many commercial property spaces vacant well into that decade. Contrast this with the recent surge in investment, largely in the mining sector. These investments have added materially to productive capacity, allowing output to accommodate the demand from China for our resources, positioning the economy to take immediate advantage of the global recovery when it starts.
Overall, despite these reasons for optimism, our analysis has led us to the view that this recession will involve a slower recovery. This is why we have forecast three years of below-trend growth. The 1980s saw only one year of below-trend growth, and the 1990s two.
This is illustrated in Figure Ten. It shows us how this recession and recovery are expected to compare with earlier ones. As you can see, our forecasts and projections anticipate a recovery that is slower than in the 1980s and 1990s.
Figure Ten: Recessions and recoveries
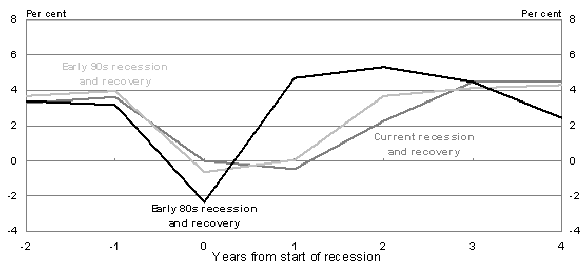
Note: Year 0 is 1982-83, 1990-91 and 2008-09.
Source: ABS Catalogue Number 5206.0 and Treasury.
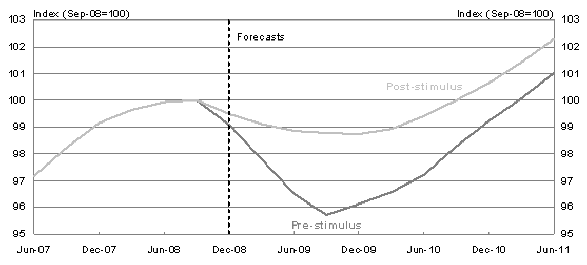
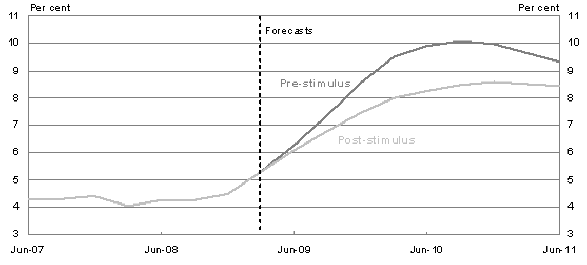
We don't often have occasion to present 'counterfactuals' in the budget papers. But on this occasion, we thought we should respond to the considerable interest in knowing how the forecasts might have looked in the absence of the strong fiscal policy response. Figures Eleven and Twelve show expected GDP growth and unemployment, both with and without the stimulus packages.
Figure Eleven: Effect of fiscal stimulus on GDP
Source: ABS Catalogue Number 5206.0 and Treasury.
Figure Twelve: Effect of fiscal stimulus on unemployment
Source: ABS Catalogue Number 6202.0 and Treasury.
Because of Australia's fiscal stimulus measures, the level of real GDP is forecast to be higher than it would otherwise have been, by 2¾ per cent in 2009-10 and 1½ per cent in 2010-11. The forecast peak in the unemployment rate is estimated to be reduced by 1½ percentage points. In the absence of fiscal policy action, the forecast unemployment rate would have reached 10 per cent.
Policy response
What indications do we have to date of the success of the fiscal stimulus? The early signs are positive.
Following the introduction of the Economic Security Strategy stimulus payments, retail trade grew by 3.8 per cent in the month of December 2008, and March 2009 data show that retail trade remains 4.5 per cent above its pre-stimulus level of November 2008. These results compare to falls in retail turnover in other parts of the world. In countries such as the United States, Japan, Canada and Germany, retail turnover is 2 to 3 per cent lower.
As noted earlier, consumer confidence has held up better than in many other countries, where confidence fell to record lows in the March quarter 2009. In Australia, consumer confidence was 13 per cent higher in April 2009 than its October 2008 level, as measured by the Westpac-Melbourne Institute Index of Consumer Sentiment.
Since the introduction of the First Home Owners Boost in October 2008, the number of loans to owner-occupiers rose for the sixth consecutive month in March 2009, after falling in each of the eight months prior to its introduction.
Medium term challenge — strengthening fiscal sustainability and investing in growth
In some of the commentary on the Budget there has been considerable scepticism of the Government's commitment to holding growth in real spending to no more than 2 per cent in real terms until the budget returns to surplus in 2015-16. A typical reaction, from one of our senior broadsheet journalists, was an ironic 'Oh yeah'. Scepticism about restraint in government spending isn't a bad thing. And it's also understandable if one had no experience to go on apart from the last half dozen years. But some commentators have gone beyond scepticism, claiming that the fiscal discipline implicit in the Government's strategy would be unprecedented. That claim is wrong. As far as the history is concerned, fiscal restraint of the degree set out in the Government's medium-term strategy is unusual; it is at odds with the past several years; but it is certainly not without precedent.
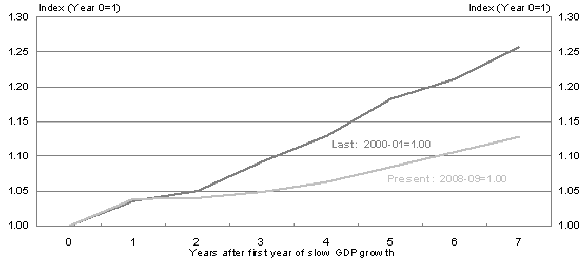
Figure Thirteen charts the evolution of real government spending in two seven-year cycles: the first being the seven years of strong growth between 2000-01 and 2007-08; and the second, the seven years between 2008-09 and 2015-16. In each case, the level of real spending has been normalised such that it has a value of one in year zero. Thus, with respect to the cycle commencing in 2008-09, a level of 1.05 in year 3 means that in 2011-12 (that is, three years after 2008-09), real government spending is five per cent above its 2008-09 level.
Most of you will recall that, although the Australian economy managed to avoid following much of the industrialised world into recession in 2000-01, that was a year of quite low GDP growth in this country – of less than 2 per cent. And all of you would be aware that for the year 2008-09 we are forecasting zero GDP growth.
Figure Thirteen
Source: ABS Catalogue Number 6401.0 and Treasury.
The chart shows that over the seven years from 2000-01 real government spending grew by a very strong 25.7 per cent. In only one year – 2002-03 – was real spending growth less than 2 per cent. Average growth was 3.3 per cent a year over the seven year period. Last week's Budget contains projections of growth in real government spending for the next seven years – that is, the seven years from 2008-09 – of only 12.8 per cent. Thus, the Government is projecting real spending growth that is about half that recorded in the previous cycle. Certainly, the Government's strategy doesn't look much like the experience of the last cycle. And if that was all the information you had, you might be excused for thinking that the projections contained in last week's budget are heroic.
But most of you do have more information than that. For a start, most of you know that, with respect to the conditions confronting budget decision-makers, there was actually something quite unusual about the last cycle – that is, the seven years from 2000-01. It was a period of spectacularly strong growth in nominal GDP and in budget revenues. And that provided the conditions for strong growth in government spending. I think most of you know that. But what you might not know is that, putting aside the 1970s, there is no other growth cycle in the historical tables to the budget that shows such a rapid rate of growth in real government spending.
The growth cycles of the 1980s and 1990s provide a richer, and more instructive, basis for assessing the credibility of the present government's medium-term fiscal strategy.
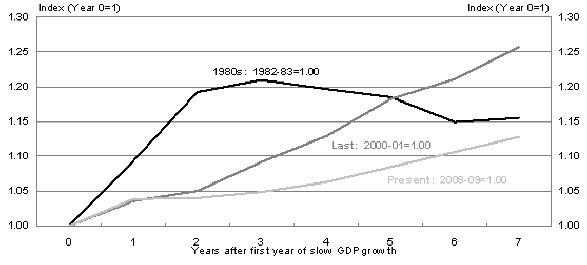
Figure Fourteen introduces the seven year growth cycle from 1982-83 to 1989-90.
Figure Fourteen
Source: ABS Catalogue Number 6401.0 and Treasury.
The 1980s cycle is interesting for several reasons: First, it starts with very rapid real spending growth – 19.2 per cent in only two years; second, over the entire seven year period, real spending growth is only 15.5 per cent – not very different from what the present government is targeting; and third it contains several years in which real spending was actually falling. The first two years of the 1980s cycle were years of strong GDP growth: 4.7 per cent in 1983-84 and 5.3 per cent in 1984-85. The Government of the time was widely criticised for not doing enough in its first two budgets to restrain spending growth and pull the budget out of deficit. Obviously, it got the message. Even including those first two years of very rapid growth in government spending the average annual rate of growth over the entire seven year period was only 2.1 per cent.
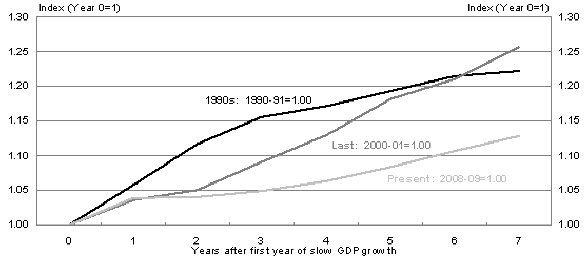
So what about the 1990s? This comparison is provided in Figure Fifteen.
Figure Fifteen
Source: ABS Catalogue Number 6401.0 and Treasury.
The first thing to note is that over the entire period from 1990-91 to 1997-98, real spending growth was, again, less than that experienced over the last growth cycle: 22.3 per cent as against 25.7 per cent.
That's not the most interesting thing about the 1990s growth cycle, however. The second thing to note is that, like the 1980s, the first two years recorded strong growth; not 19.2 per cent certainly, but a still robust 11.7 per cent. But then, over the following five years, real growth averaged only 1.8 per cent a year.
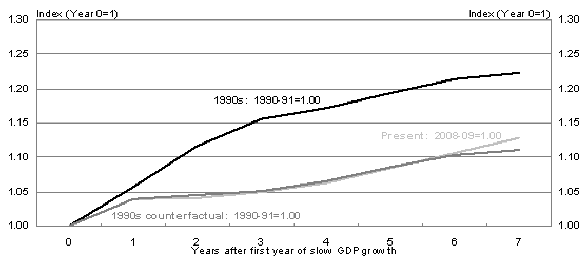
The third thing to note from Figure Fifteen is that this comparison would look even better for the 1990s had the strong growth in spending in 1991-92 and 1992-93 been brought forward into the base year, 1990-91; that is, to the year in which the recession hit. Indeed, in looking at Figure Fifteen, it's not too difficult to see how such a bring forward of the 1990s fiscal stimulus might have produced a line much closer to what the present Government is targeting in its fiscal strategy.
If you are having trouble visualising it, let me offer some help. Last week's budget papers reveal real spending growth in 2008-09 and 2009-10 of 13.5 per cent and 3.9 per cent. By comparison, in 1990-91 when the recession of the early 1990s hit the Australian economy, real spending growth was only 3.1 per cent. And it was 5.7 per cent in 1991-92 when the economy was still in recession. Let's now conduct an experiment in which real spending growth is actually 13.5 per cent in 1990-91 and 3.9 per cent in 1991-92, but the level of spending in 1993-94 and all subsequent years is unchanged from history.1 Figure Sixteen shows the result. The near coincidence with current projections is remarkable. The largest gap is in the final year. It reflects the considerable spending restraint in the former government's first budget.
Figure Sixteen
Source: ABS Catalogue Number 6401.0 and Treasury.
In the second half of the 1980s, and again in the second half of the 1990s, Australian governments committed themselves to tackling large budget deficits. On both occasions, with the benefit of hindsight, spending could have been better profiled – with faster growth in the first year of macroeconomic weakness and correspondingly slower growth in subsequent years. But, in fiscal discipline terms, on both occasions, Australian governments were successful. And on both occasions, a strong contributor to that success was a commitment to restraining growth in real government spending.
As I said earlier, scepticism about restraint in government spending isn't a bad thing. But if you examine closely the history of the last quarter century you will find that in similar circumstances in the past – that is, circumstances in which the economy was emerging from recession with a sizeable budget deficit – Australian governments have managed to exercise the sort of discipline that the present Government has embraced.
Closing remarks
Perhaps it is too early to be declaring that we will come out of this period of global economic crisis in much better shape than most other developed countries. But I'm prepared to make that prediction.
It is, of course, a conditional prediction: conditional on policy makers continuing to address emerging challenges in a pre-emptive way — inevitably writing 'puzzling, back-to-front' narratives, to use Ross' term; conditional on governments being successful in making the case for future reforms rigorously, persuasively and tirelessly; and conditional on there being no reform fatigue – no resting on the achievements of earlier decades.
In difficult times like these, it is sensible to take stock of where we have got reforms right in the past. I'm referring to the float of the currency; the dismantling of the protective wall of tariffs and quantitative import restrictions; making labour markets more flexible; tax reform; developing a credible medium-term framework for fiscal policy; protecting an independent central bank pursuing an inflation target; competition policy; and building a strong system of banking, financial sector and broader corporate regulation.
The challenges of this decade are manifold. The Government has targeted global warming, the consequences of an ageing population, a realignment of national security priorities, the changing face of social dislocation, and the growing complexity and volatility of financial markets.
Addressing these challenges will require a considerable overhaul of the frameworks that govern investment, taxation, regulation, income support, health and education. The forward agenda is vast.
But first, we have to cover some very difficult terrain immediately in front of us.
The last couple of years have been an extraordinary period in modern economic history. Economic shocks have rolled in one after the other. Governments and commentators have scrambled to understand them and explain their consequences.
For Australia, the commodity price shock that started in 2003, and the surge in demand for Australia's resources fuelled strong rises in national income and domestic demand, causing inflation to head up sharply. Then a plunge in asset values and credit supply in the aftermath of the US sub-prime disaster sent confidence plummeting globally and saw risk premia shoot to levels that we would not have thought possible. The feedback loop into the global real economy has now closed, with investment and consumption tumbling from very high levels.
Globally, and in Australia, the policy response has been bold. Financial institutions have been rescued; gaps in credit markets have been closed, and governments have stepped in to fill the spending void opened by a retreating private sector.
Mistakes have been made. But the tentative signs of stabilisation in the financial sector globally, and the slowing in the rate of deterioration in the global real economy indicate that policy action has generally been sound.
Opportunities have also opened up. Public investments that were not viable a year ago now represent value for money, and a reprioritisation of government spending is underway.
Finally, there is an enormous opportunity here for the economics profession to distil the lessons from this business cycle and for policy makers to apply these lessons. I sincerely hope that we all take the time to do this. As intellectually enriching as I have found the last 18 months, i
t has been an experience that I hope not to repeat.
1 In this simulation, a constant real growth rate of 0.6 per cent has been imposed on spending in the years 1992-93 and 1993-94 in order to arrive at the same level of spending in 1993-94. The impact on prices, and other macroeconomic variables, of the changed spending profile have been ignored.