Downloads
Introduction
My message for you today is that the outlook for the Australian economy is positive.
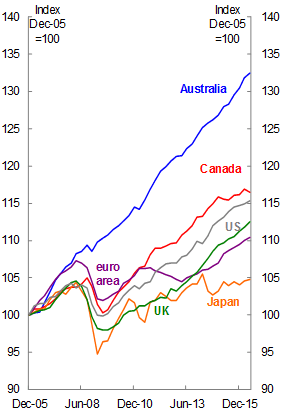
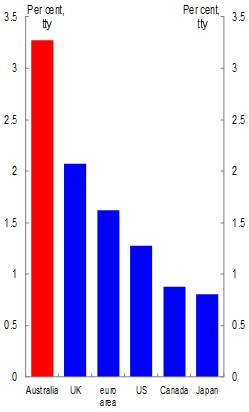
Australia is entering its 26th year of continuous economic growth: we did not fall into recession in the aftermath of the global financial crisis of 2008, unlike many economies [Chart 1]. And real GDP is growing by 3.3 per cent per annum, faster than every country in the G7.
Chart 1: Real GDP growth: selected economies
GDP growth over the last 10 years
GDP growth through the year to June qtr 2016
Source: National Statistical Agencies, Thomson Reuters Datastream
This is the payoff from flexible macroeconomic policy frameworks, earlier microeconomic reforms and a once-in-a-lifetime mining boom.
We are doing very well – and this sometimes gets lost in the debate in Australia and abroad – but we are not guaranteed a strong future. If we want to grow faster, we must improve productivity. With historically high levels of government debt, we need to manage fiscal consolidation, but without slowing growth.
International Backdrop
This achievement is all the more remarkable against an international backdrop of slower-than-expected recovery in the global economy following the global financial crisis of 2008.
I recently returned from the US where the Treasurer attended the Annual Meetings of the IMF as well as a meeting of G20 Finance Ministers and Central Bank Governors. Discussions there focused on the current state of the global economy and the risks in the years ahead.
Prior to the meetings, the IMF released its October World Economic Outlook. Following previous growth downgrades earlier this year the IMF’s forecasts were unchanged from its July update. No further growth downgrades could be seen as a positive sign for the world economy. But the outlook for global growth remains subdued and downside risks remain across both advanced and emerging economies.
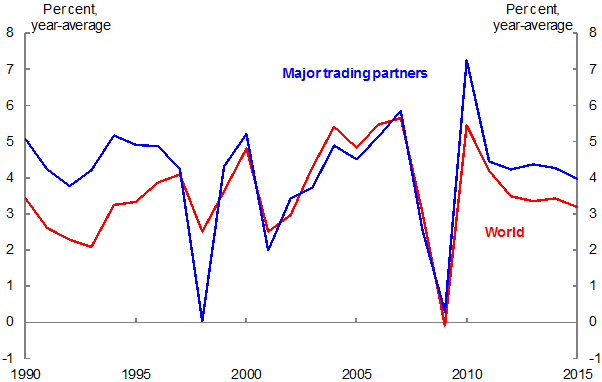
Importantly, Australia’s major trading partners are forecast to continue to grow at a stronger pace than the global economy [Chart 2]. This reflects our trade links to Asia, where growth remains relatively strong. Indeed, 8 out of Australia’s top 10 trade partners are in Asia.
Chart 2: Global Growth
Source: IMF October 2016 World Economic Outlook, ABS cat. No. 5368.0 and Treasury
Our region, Asia, is important for Australia, but also for the global economy. Asia continues to drive the world economy, with the IMF predicting the region will contribute more than 60 per cent of global growth through to 2021.
Of particular importance – for Australia and the world – are the implications of the transition of the Chinese economy towards a more consumer-driven growth model from its present reliance on investment. Sustainable growth in China is in our interest and China’s economic transition will present opportunities for Australia. However, this process is unlikely to be smooth and there is a tension between policies to support short-term growth and the structural reforms required to rebalance the economy.
The potential for this transition to lead to a greater-than-expected slowdown in the Chinese economy remains a key risk to Australia, the region and the global economy.
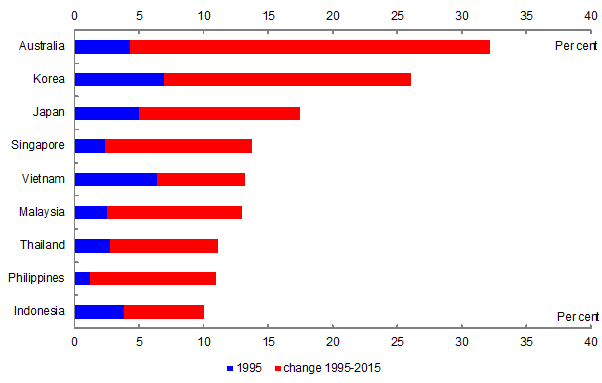
We are leveraged into the Chinese economy through many channels. One of the most important is merchandise trade [Chart 3].
Chart 3: China’s share of merchandise exports (selected regional economies)
Source: IMF Direction of Trade Statistics
That said, there will also be opportunities for Australia in China’s longer-term transition. Our past trade has mainly been focused on demand for our commodities; however, as China transitions trade will become more focused on demand for services.
Japan will also continue to present opportunities for Australia as our second-largest export destination and our second largest source of foreign direct investment.
Australia’s Economic Transition
In addition to the global headwinds, Australia is managing a transition of its own.
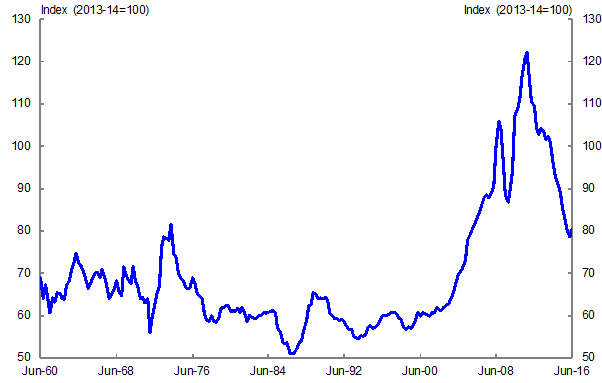
Australia’s terms of trade — the ratio of our export to import prices — reached its highest level in over five decades in 2011, and has since fallen by a third, underpinned by developments in bulk mining commodity prices [Chart 4].
Chart 4: Australia’s terms of trade
Source: ABS cat. no. 5206.0.
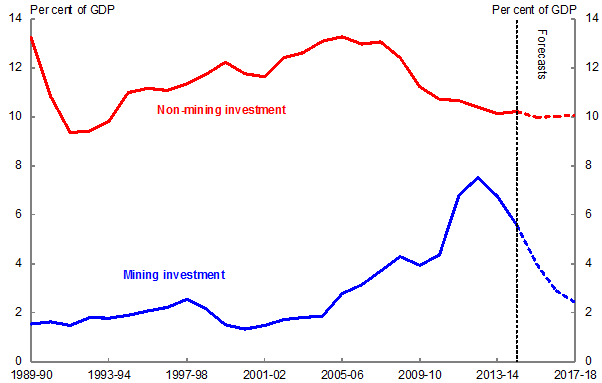
As you are no doubt aware, in response to higher commodity prices Australia underwent a once-in-a-lifetime resources boom. Mining investment made an average contribution of 1 percentage point per annum to growth in the five years to 2012-13. It peaked as a share of GDP at 7.5 per cent in 2012-13. Since then it has made an average subtraction from growth of around 1 percentage point per annum as resources projects have been progressively completed.
Historically, resources booms have typically ended in nasty adjustments. Indeed, other commodity exporters have faced major economic downturns in response to the unwinding of their resources boom.
But, so far, Australia is successfully managing its transition to broader-based drivers of economic growth. Adjustments in interest rates, movement in the exchange rate and moderate wage growth are all working to shift resources from mining-related sectors to other sectors, particularly the service sectors.
In this regard it’s important to recognise that the Australian economy is quite diversified. Mining contributes 8 per cent directly to industry output. But, the Australian economy is heavily based on services, with the combined services sector comprising about 70 per cent of industry output and about 80 per cent of employment.
The transition is evident in labour market outcomes, with all employment growth over the last two years coming from services industries, mainly within the private sector.
It is also evident in strong growth in service exports, underpinned by an exchange rate that has depreciated by around 30 per cent against the United States dollar since the peak of the terms of trade in September 2011. Service exports grew by about 20 per cent over the last three years – as we take advantage of a growing middle class in Asia to increase our exports of tourism, education and business services.
Take tourism as an example. Export growth is being driven by a sharp increase in Chinese tourists. Around 1.2 million Chinese tourists have travelled to Australia over the past year – growth of around 22 per cent on the previous year. We have also seen a strong rise in visitors from other Asian nations.
Domestic Economic Outlook
Despite global volatility and the economic transition, the domestic outlook remains positive and is evolving broadly in line with our official forecasts.
The major contributors to ongo
ing growth include steady household consumption, strong growth in dwelling construction in major cities and a ramp up in exports. These are providing an offset to falling business investment.
Looking at the economy as a whole, the one thing we are missing is a resurgence in business investment. But that is a characteristic of many advanced economies.
Turning to the sectoral story in more detail, household consumption is expected to continue to grow steadily, underpinned by steady employment growth, low interest rates and a falling saving rate as households smooth consumption expenditure, including in response to the decline in the terms of trade. This follows a period of generally rising saving rates as households reacted to the rise in the terms of trade and uncertainty caused by the GFC and its aftermath.
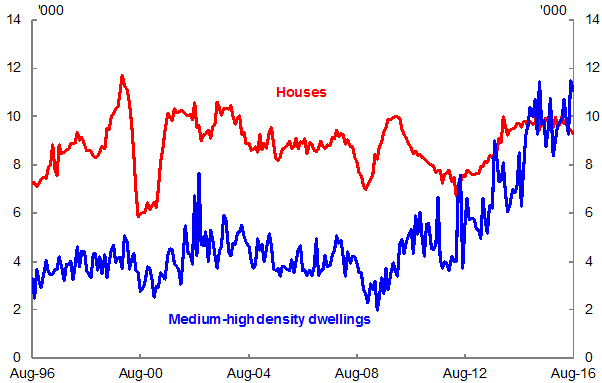
Conditions in the housing market remain strong. This has been underpinned by a shift towards medium-high density dwellings, particularly in New South Wales, Victoria and Queensland [Chart 5]. That said, some indicators in the housing market have moderated since last year. While the level of housing investment is expected to remain high, growth is expected to ease as a record number of dwellings reach completion.
Chart 5: Building approvals
Source: ABS cat. no. 8731.0
We are alert to the downside risk that strong construction levels, tighter lending standards and rising construction costs could lead to activity declining more quickly than expected once the large construction pipeline is complete – particularly in the high-rise apartment market.
Another issue to monitor is private debt, particularly debt held by households, which has grown in Australia as recently flagged by the IMF. This could become a greater challenge if financing conditions become less favourable. That said, while household debt has risen over recent years so too have asset values. The net worth of households has grown by 60 per cent relative to its pre-crisis levels, led by increases in housing and land values as well as superannuation holdings. In addition, the bulk of Australian debt is held by those households with the highest incomes.
Export growth is being underpinned by the production phase of the mining boom, demand from Asia and the sharp depreciation in the exchange rate since 2012. Australia continues to expand iron ore exports. And the commodity export mix is changing as liquefied natural gas, or LNG, is expected to become Australia’s second largest export over the next few years. LNG production contributed around ½ of a percentage point to real GDP growth in 2015-16 and is expected to continue to make further significant contributions in the next few years.
In Australia, sharply falling mining investment as resources projects are completed will continue to act as a significant drag on overall business investment and in turn economic growth. Mining investment is expected to fall by 25½ per cent in 2016-17 and a further 14 per cent in 2017-18 [Chart 6]. As this detraction eases it is expected that investment in other areas of the economy will pick up, despite uncertainty over the exact pace and timing of this recovery.
Chart 6: Business Investment
Source: ABS cat. no. 5204.0 and Treasury.
Conditions are conducive for investment outside of the mining sector, with low borrowing costs, signs that firms are well placed to meet financial obligations, high levels of surveyed capacity utilisation, and domestic demand forecast to strengthen. However, leading indicators remain mixed, with some business expectations surveys suggesting non-mining businesses have yet to commit to significant new investment plans. This puts Australia in line with most advanced economies which are experiencing subdued business investment.
Another feature of advanced economies – Australia included – is low inflation and subdued wage growth. The headline Consumer Price Index in Australia rose 0.4 per cent in the June quarter to be 1.0 per cent higher through the year, the lowest growth rate since June 1999.
In Australia, declines in the terms of trade are weighing on national income. The strong supply response from commodity producers in the resources boom, as well as softening global demand, put downward pressure on commodity prices over recent years. So while Australia’s export volumes have increased, the price received for those exports has fallen. This is contributing to downward pressure on wage growth.
But subdued wages growth is supporting employment. Australia’s labour market is performing well. The unemployment rate declined from 6.3 per cent in July 2015 to around 5 ¾ per cent, supported by low wage growth and a shift to more labour-intensive industries. Labour force participation has remained elevated.
Demographic pressures from an ageing population are starting to have an impact on the Australian economy but with less effect than for many other advanced economies. Another aspect of our demographics that differentiates Australia is growth in our working age population, which is expected to remain steady at a relatively strong rate of about 1 per cent per annum, largely reflecting our successful migration program.
Maintaining strong Government balance sheets
Turning now to fiscal policy, Australia is one of only ten countries with a triple-A credit rating from all three of the major rating agencies, reflecting our strong economic fundamentals, sound policy frameworks and a track-record of fiscal responsibility. Our top credit rating was an important asset during the crisis, and of course it helps to contain the costs associated with servicing our public debt.
The Australian Government attaches a high priority to maintaining these triple A ratings, especially in the context of continued global economic uncertainty and heightened downside risks. I know from personal experience in the banking sector during the financial crisis how important a strong credit rating is to investor confidence.
We are very aware that these ratings are dependent on credible fiscal consolidation and a smooth transition to a more diverse economy. We are not complacent about the challenges to achieving these goals.
Australia fared better than most during the Global Financial Crisis. The fact is that we were prepared — we entered 2008 with the government having negative net debt, triple A credit ratings and a well-capitalised and well-regulated financial sector. It is largely thanks to these preparations that the Australian economy managed to continue its historic run of uninterrupted annual growth over this tumultuous period.
However, like many other countries we continue to feel the legacies of the crisis, including the need to focus on budget repair. We have run fiscal deficits since the crisis and are not forecast to return to surplus until 2020-21.
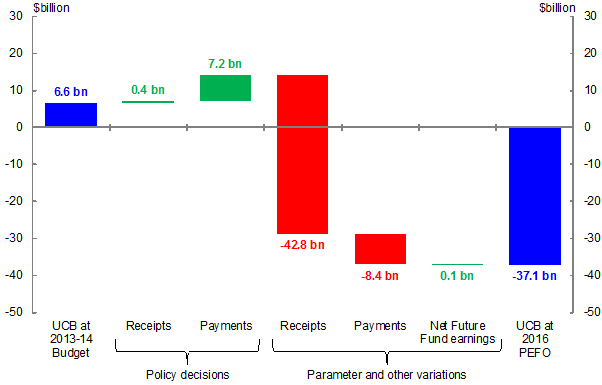
While the Government has made policy decisions to control the growth in expenditure, these savings have been offset by weaker revenue as a result of low nominal growth [Chart 7]. For example, the 2013-14 Budget projected a surplus of $6.6 billion for 2016-17. Since then, Government decisions have contributed another $7.6 billion to the cause of budget repair for the 2016-17 year. However, over the same period the impact of these decisions was swamped by movements outside the direct control of the Government, mostly as a resu
lt of lower than expected taxes.
Chart 7: Impact of policy decisions and parameter changes on the budget (2016-17)
Source: Treasury
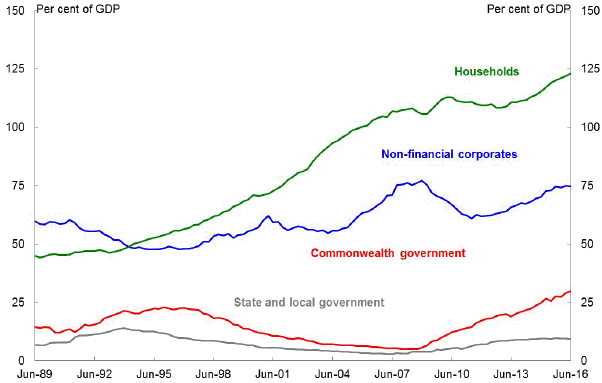
The Commonwealth government’s gross debt is projected to increase by around $70 billion in 2016-17 and is approaching 30 per cent of GDP. While our public debt is low by international standards, and our placements are well covered, we are not complacent about the recent growth in our debt.
Of course, Australia has always been a net importer of capital. This has been an important source of our prosperity and development. However, it does mean we have less head room for government debt than many other advanced economies that fund their own debt. More than half of Australian public debt is held by non-residents, exposing Australia somewhat to volatility in global capital markets [Chart 8].
Chart 8: Gross debt in the Australian economy
Source: ABS cat. no. 5232.0 and 5206.0.
In thinking about the appropriate level of public debt, it is also important to consider the extent of private indebtedness, and the interlinkages. Growing private debt could lead to increased public debt. And growing public debt has implications for private borrowing, such as in the event of a sovereign rating downgrade increasing borrowing costs across the economy.
Private debt is not only at historical highs for Australia, but it is also high compared to other countries. Australian households are the fifth most indebted in the OECD, with debt equal to 186 per cent of net disposable income. Private gross household debt has more than doubled over the past two decades as a proportion of GDP.
The financial risks associated with this debt are being actively managed. More than half of Australia’s total foreign borrowing is denominated in Australian dollars and banks’ foreign exchange risk is almost completely hedged. In aggregate, net of hedging, Australia’s foreign currency exposures are on the asset side of the balance sheet, reflecting the growing pool of superannuation assets and international diversification. Taking account of the assets that Australians hold in the rest of the world, our net external debt has also been growing and is about one fifth higher than it was twenty years ago.
The Australian Government’s fiscal strategy is directed to building the resilience of our economy by keeping debt under control — returning the budget to balance through disciplined expenditure restraint and a growth friendly tax system.
Progress in fiscal consolidation will help maintain investor confidence and facilitate investment and growth. But this is no easy task. Deficits have proven very difficult to shift in recent years. In particular, low nominal growth has been a strong headwind to bringing the budget back to balance.
The priority for budget repair is to control the growth in expenditure [Chart 9]. In particular, we recognise that it is not sustainable for Australia to finance our recurrent expenditure by increasing debt.
Chart 9: Payments and receipts to GDP
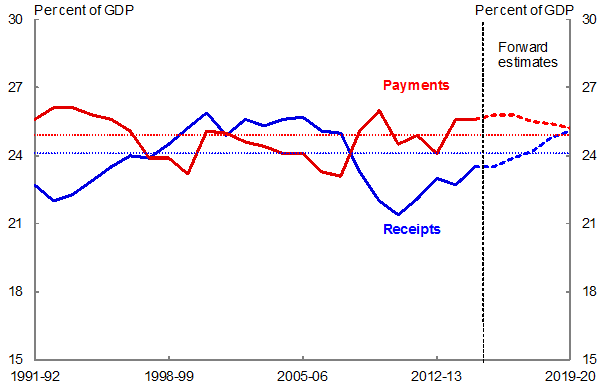
Source: Treasury, dotted lines indicate 30-year averages
If we cannot control our expenditure, there will be greater pressure to find revenue to balance the budget. However, the Government is determined that our tax system should support the investment and innovation that is needed to fuel potential growth.
Australian Treasury analysis, published earlier this year, showed an increase in income tax would inflict significant costs in the form of reduced jobs, investment, consumption and economic growth. In particular, as a net importer of capital, the tax burden we impose on capital income needs to be internationally competitive. We also need to recognise that labour is increasing mobile and that Australia must compete for global talent. This leads us to the fundamental conclusion that we need to contain spending.
Unsurprisingly, the focus of our efforts is in the largest spending areas, including social services. Reining in the growth in welfare spending is one of the biggest challenges confronting the process of budget repair.
Against this backdrop, the Government finds itself with a slim majority in the Parliament. This presents a challenge of needing to work with a diverse range of interests in order to advance the Government’s legislative agenda. But it is also an opportunity to build broad support for the reform agenda that is needed to secure Australian living standards into the future.
Last month, the Government made some important progress in legislating a package of $6.3 billion in expenditure reductions. This will reduce Commonwealth debt by more than $30 billion by 2026-27. It is an important start to the current term of government, though much remains to be done – including another $20 billion of announced measures that are yet to be approved by the Parliament.
Conclusion
To conclude, the Australian economy continues to perform well and largely as expected in the 2016-17 Budget. It remains resilient in the face of global volatility. The economy is transitioning from an unprecedented mining investment boom to broader drivers of growth.
A stronger fiscal position is necessary and should go hand-in-hand with other policies to lift our growth and living standards. The outlook for the Australian economy is positive but keeping it that way is the challenge ahead.