
Introduction1
It is a pleasure to be with the Australian Business Economists for this post-Budget address.
I would like to begin by acknowledging the Traditional custodians of the land on which we are meeting – the Gadigal people of the Eora Nation – and pay my respects to their Elders past and present. I extend that respect to Aboriginal and Torres Strait Islander people here today.
The culture of the First Nations people is deeply grounded in connections and storytelling. Today, I hope to connect our current economic circumstances with the necessity of ongoing reforms to support our resilience into the future.
I will reflect on how the conflict in the Middle East has evolved and important considerations for managing shocks such as these; how fiscal sustainability is critical to allow the Government to respond to the challenges of today and also of tomorrow; and how ongoing reform, while challenging, is necessary to set Australia up for a fairer and more prosperous future.
Middle East Conflict
Two and a half months ago, the Treasurer and I met with many of you and your colleagues in a series of roundtable discussions. The discussions were insightful and broad ranging, and they came at a pivotal time for the Australian and global economies.
At that time, the conflict in the Middle East had just begun. As expected, there were varied perspectives at the roundtables, demonstrating the significant uncertainty about how long the shock would last and the potential for it to be sizeable.
Both the global economy and the Australian economy entered 2026 from a position of strength.
In April last year, the IMF downgraded their global growth forecast to 2.8 per cent in 2025, largely reflecting the impacts of US trade policy decisions. But global growth is now estimated by the IMF to have been 3.4 per cent.
While this partly reflected US tariffs being implemented later and at lower rates than initially announced, it was also a display of resilience, evidenced by a significant increase in trade diversion rather than a contraction in global trade in response to the tariffs.2
The significant global investment boom in AI and data centres, as well as continuing strong global investment in renewable energy, also supported the global economy. In the United States, investment in information processing equipment grew by around 20 per cent in 2025.
And this investment momentum was seen in Australia. Business investment in information technology and media equipment grew by over 50 per cent last year.
Momentum in private final demand in Australia increased through 2025, supported by strong dwelling investment and a pick-up in household consumption growth. This strength was also reflected in the labour market.
So, when we met in March, the most immediate challenges were the re-emergence of inflationary pressures in a domestic economy that was operating close to potential and the continued imperative to re-build fiscal buffers. The global economy had demonstrated resilience, and there were some grounds for optimism that the conflict might end swiftly.
But, as we all know, the Middle East conflict was not resolved swiftly.
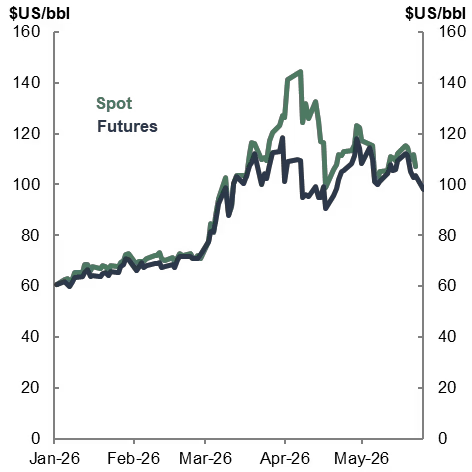
In the early days of the conflict, the disruption was seen in overnight increases in the Brent oil price from around US$70 per barrel to above US$100 per barrel. And while there has been volatility, prices have remained above US$100 per barrel for most of the past 3 months (Chart 1). Over this period markets have continually repriced their expectations as the conflict has failed to be resolved, global oil supplies have been re-directed in response to shortages, and global fuel stockpiles have been rundown.
Chart 1: Brent oil prices
Source: Bloomberg, Treasury
Note: Updated 25 May. Dated Brent (spot) vs front-month ICE Brent futures contracts (futures).
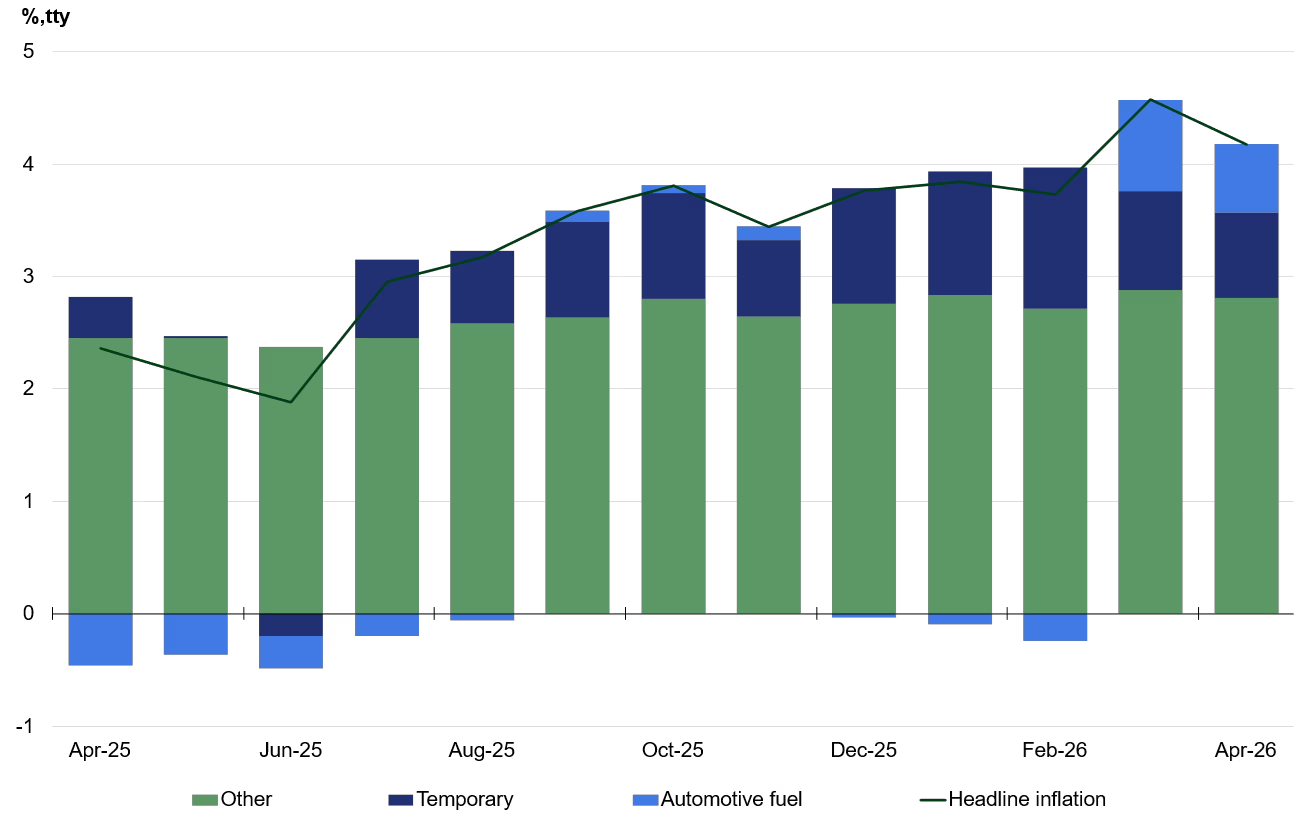
Price pressures stemming from the conflict are expected to add around one percentage point to headline inflation through the year to the June quarter 2026 (Chart 2). This estimate takes into account the direct effect of the temporary reduction in fuel excise, which is expected to take around half a percentage point off headline inflation. The April inflation result was a little softer than expected, and we will continue to closely monitor fuel prices and the pass through of cost pressures to consumers in coming months.
Pressures from the conflict come on the top of inflationary pressures that had emerged through the second half of 2025. Some of these were temporary pressures, including the end of government electricity rebates, while some appeared to be more persistent.
Chart 2: Contributions to headline inflation
Source: ABS Consumer Price Index and Treasury.
Note: Temporary includes the contribution of electricity, holiday travel, fruit and vegetables, water and sewerage and property rates and charges.
This is the fourth significant global shock this decade. It follows the COVID-19 pandemic, Russia’s invasion of Ukraine and the US Administration’s tariffs shocks, and it has added to global uncertainty.
Australia is as well placed as any advanced economy to manage the current crisis, with a strong track record of both responding and adapting to shocks and recovering quickly from them.
Our resilience has been underpinned by credible fiscal and monetary policy frameworks, strong institutions, flexible labour and product markets, a well-regulated financial system and a flexible exchange rate.
Australia’s management of past shocks contains several important lessons that will continue to hold us in good stead for the future.
Our experience has underlined the need for a policy toolkit that is flexible and can be tailored. Shocks do not arrive in a standard form, and the tools must be able to adapt to the circumstances that are presented. The aim for policy makers is to select the right tools, calibrate them appropriately, and minimise the risk of missteps.
Our experience highlights the importance of fiscal and monetary policy working effectively together – each focussing on the issues they are best placed to address.
And it highlights the importance of well-functioning markets as another essential line of defence.
Both the Government and the private sector have mobilised to deal with the current shock, particularly when it comes to the supply of fuel and fertiliser.
Australian fuel importers have effectively pivoted to alternative suppliers, and Asian refiners have pivoted to alternative sources of crude oil. The Government has sought to secure additional supplies by using Export Finance Australia to underwrite fuel and fertiliser cargoes and through intensive diplomatic efforts with neighbours and trading partners. And the rapid adjustment to regulations to unlock more fuel supply and encourage more efficient use has also been important.3
The Budget outlined a central case for how the conflict will impact the economy, reflecting both the conflict and the policies the Government has put in place.
However, significant uncertainty around this shock remains.
It remains the case that the risks to the outlook largely depend on the duration and severity of the conflict. The longer it lasts, the more severe its likely impact on prices and supply chains.
Thus far, global markets have proven to be flexible and adaptable and have continued to deliver orderly supply. But there remains a possibility of higher prices and more supply disruption than we have experienced so far.
In the Budget, Treasury modelled a scenario in which global oil prices peak at US$200 per barrel during the September quarter 2026.4 This could occur if an escalation further damages energy and export infrastructure across the Middle East and further curtails oil supply from the region.
It could also occur if the disruption extends rather than escalates. Since the start of the crisis, the rapid draw down of inventories has played a significant role in cushioning global markets. But there are limits on the ability of stocks to continue to be drawn down at current rates before operational stress levels increase. This also creates the risk of higher prices in the future.
Treasury continues to monitor conditions closely and is working across Government to plan for different contingencies and advise on the responses that may be required.
Budget sustainability
The events of the past 3 months have re-enforced the imperative of pursuing reforms to improve Australia’s resilience and ensure we can respond as effectively as possible to current and future shocks.
So let me turn now to the Budget’s focus on reforms to improve the sustainability of the budget and improve the productive potential of the economy.
Improving the Budget’s sustainability allows governments to effectively respond to shocks, while still delivering on their other core responsibilities, like meeting the health and care needs of an ageing population and delivering national security.
It allows governments to address other issues that it judges are important to the community such as improving intergenerational equity.
It keeps government borrowing costs as low as possible, further reinforcing fiscal space.
It is worth acknowledging that Australia already has a more sustainable fiscal position than most other advanced economies.
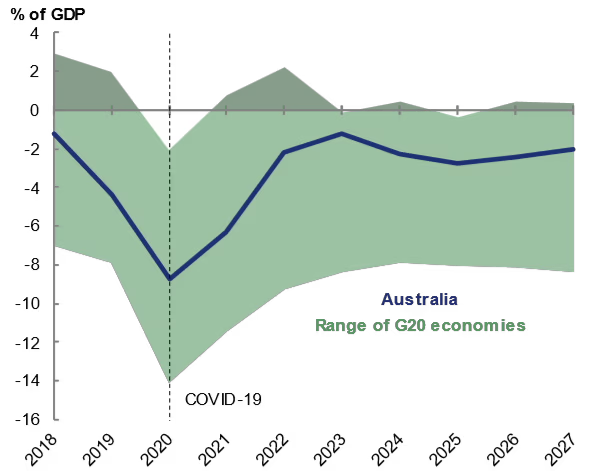
The latest IMF fiscal outlook shows that Australia’s general government fiscal balance, as a share of GDP, has improved significantly following the pandemic, returning to around pre-COVID levels. It is projected to be better than all but two other G20 countries in 2027 (Chart 3).5
Chart 3: G20 General government fiscal balances
Source: International Monetary Fund.
Note: IMF fiscal data are produced on a consistent basis across countries. They are produced for calendar years and on a general government basis, which includes state, territory and local governments.
Including both Commonwealth and State government debt, Australia is projected to have the fifth lowest gross debt-to-GDP ratio among G20 countries in that same year. It is particularly striking that Australia’s debt ratio is more than 50 percentage points below that of the United Kingdom, and more than 75 percentage points below that of the United States.
But there is more work to do to maintain and improve our fiscal position.
Spending as a proportion of the economy has lifted over the last decade. In part this has reflected the ageing of the population, and in part additional supports that have been provided in the care sector. Going forward, there are significant additional pressures on defence spending given the geopolitical environment.
It is important that the Government is focussed on returning the budget to balance, underpinning the overall goal of reducing gross Commonwealth debt as a share of the economy over time.
Managing this will require the Government to continue to prioritise spending across all portfolios, identifying efficiencies and savings. It will require ongoing disciplined decision making across a run of budgets – striving to reduce deficits and debt at each update, while responsibly dealing with the circumstances that are presented, delivering on Government priorities and managing community expectations.
It will likely require adjustments on both the spending and tax sides of the budget.
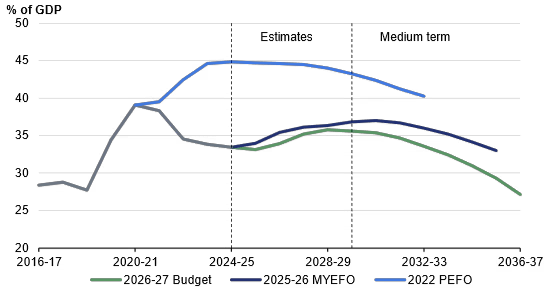
The 2026-27 Budget has made progress in this direction (Chart 4). As a share of GDP, the deficit and gross debt are projected to be lower in every year of the projection period than at MYEFO. And spending as a share of GDP has been reduced and is projected to decline further.
Chart 4a: Underlying cash balance
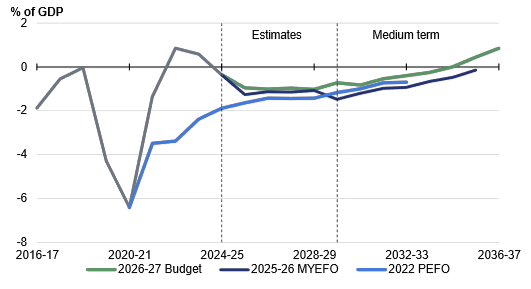
Chart 4b: Gross debt
Source: Australian Office of Financial Management, Treasury
The deficit in the underlying cash balance is projected to remain around 1 per cent of GDP over the next few years, before gradually returning to balance by the middle of the next decade – which would be a better outcome than is expected to be achieved in almost all other comparable countries.
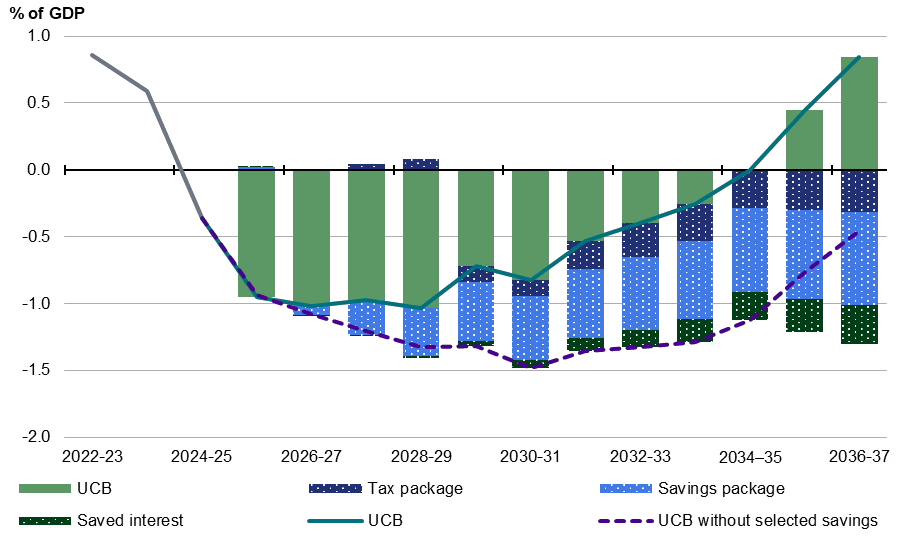
The improvement in the fiscal position over the medium term has been driven by reforms on both the spending and tax side – with the heavy lifting being done by the reforms to the NDIS (Chart 5). While tax as a share of GDP does increase over the medium term, the Government has stated that this provides room for future tax relief in coming budgets.
Chart 5: Contribution of tax and NDIS to change in UCB
Source: 2026-27 Budget Paper 1, page 91.
These reforms have required unavoidably tough decisions. At the same time, the Government’s ongoing drive to improve productivity outcomes is aimed at raising the speed limit of the economy.
Productivity
Productivity is critical to economic flexibility and to longer term prosperity.
Australia’s productivity outcomes reflect the development of the global productivity frontier, mediated by local policy and institutional settings.
There is broad agreement that the slowdown in global productivity growth in recent decades reflects slower growth of the global frontier, in particular since the Global Financial Crisis, and a slowdown in diffusion of frontier technologies. There is also considerable uncertainty about how the frontier will evolve from here.6
Downside risks, including climate change and rising barriers to trade, have the potential to hamper long-term productivity growth.
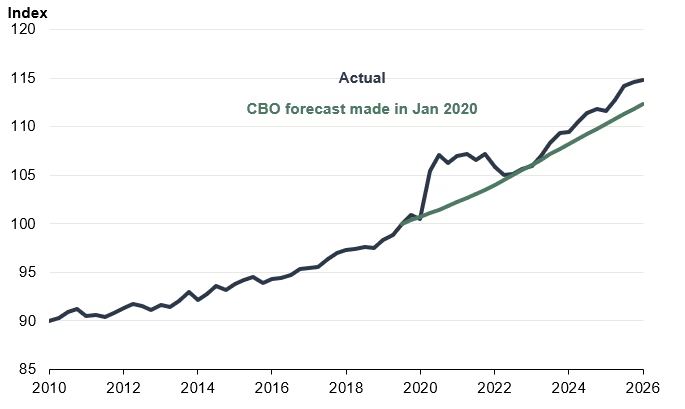
On the other hand, the upside potential of technological innovations, particularly artificial intelligence, could be very significant. And there are early signs in the US of productivity growth lifting after a protracted period of slower growth, which bodes well for the global productivity frontier (Chart 6).7
Chart 6: US labour productivity (non-farm business sector)
Sources: Treasury analysis, Congressional Budget Office, Bureau of Labour Statistics, The Economist.
Note: Index: Q3 2019 = 100
History tells us that the adoption of new technologies often requires firms to redesign business processes, restructure organisations, and build human capital. Some of this is occurring with AI, although it is going to take time and experimentation.
Australia’s challenge is to keep pace with these developments – but also to keep our own house in order.
While we can do little to shift the global productivity frontier, we can influence how far we are from it.
Many participants at the Economic Reform Roundtable last year highlighted the unnecessary barriers to businesses working across State and Territory borders ranging from occupational licenses to trucking permits.
Such barriers impede specialisation and business growth, and make the national economy more fragile. The aim of the revitalised National Competition Policy is to move Australia closer to a single national market with a suite of reforms that could meaningfully lift GDP if fully implemented.
That last caveat is important.
Coordination across the Federation has bedevilled governments since 1901. Drawing on the successful model of reform from the 1990s, the National Competition Policy incentivises the States to implement best practice systems, learning from each other. States are paid out of the fiscal dividend delivered from higher productivity due to the reforms, once they are completed and verified.
In addition to these reforms, the Budget also outlined the wide body of work being undertaken across the Commonwealth to reduce regulatory burdens and improve productivity. In the Treasury portfolio, these include further streamlining of foreign investment approvals and financial reporting requirements. But as Danielle Wood has put it, this is less a case of big bang reform and more “a game of inches.”8
Improving productivity requires ongoing work across all Government portfolios, across all regulators and across all levels of Government to make material change. And also effective engagement with the business community to target our efforts.
Budget reform
Now let me come to the major reforms announced in the budget.
It is hard to get major reform done, but important that we do so.
While most of the recent focus has been on tax, the other notable reform in the budget is in relation to the National Disability Insurance Scheme.
As Minister Butler said when announcing these reforms, the NDIS has changed lives for the better, but for the sake of those the NDIS was created for the Government has to make sure it is sustainable now and for future generations.
Over the past decade, the NDIS has grown at double-digit annual rates, and is expected to cost $50 billion in 2025-26, or 1.7 per cent of GDP. Before the decisions taken in this Budget, the NDIS was expected to cost more than the Pharmaceutical Benefits Scheme and Medical Benefits Scheme combined by the end of the forward estimates, and more than $100 billion per year by 2034-35, or 2.2 per cent of GDP.
Most gathered today would readily concede the need to slow these cost increases and how without further effort, tax-to-GDP would have had to keep rising, or large structural cuts to other programs would have been required, to maintain a fiscally sustainable position in the face of this growth.
The NDIS reforms outlined in the Budget are fundamentally about re-focusing the scheme on its core purpose to support those people with a significant and permanent disability, and addressing deficiencies in its governance and administration. Their purpose is to ensure that in the long term, the NDIS retains it social license.
But we should not lose sight of the impact that these reforms will have on individuals and families – including in the context of the tax debate.
Before I provide some observations on the specific tax reforms in this budget, let me make some overarching comments.
First, tax reform is unavoidably complex and contested.
This is because tax affects almost everyone, ‘winners’ and ‘losers’ can be identified, and calculations can be made of the outcome for individuals in their specific circumstances.
It is also because tax reforms have to be informed by a system-wide perspective, to make society better off overall both now and in the future, and because the ultimate incidence of tax changes is not particularly intuitive and often contested.
It’s worth pausing to reflect on our recent history of tax reform and be clear about what tax reform is all about.
In my lifetime there have been two previous sets of major tax reforms.
The first was the 1985 package that introduced capital gains tax, fringe benefits tax and dividend imputation, and materially lowered personal income tax rates.
And the second was the combined 1999-2000 packages, which introduced the GST, lowered the company tax rate, reformed the CGT regime and lowered personal income taxes.
Both packages substantially improved the sustainability of the tax base. Both led to claims about significant adverse impacts that did not ultimately eventuate. Both were vigorously contested.
Why? Because in designing the reforms there were trade-offs between the objectives of efficiency, equity, and simplicity.
There are trade-offs between a system that is simple, straightforward and collects the revenue needed at the lowest economic cost.
And a system that reflects the values of the community, and the principle of the ability to pay.
In this context, it's important to be clear about what we mean by an efficient tax system, or one with the lowest economic cost. The goal is neutrality: decisions by individuals and businesses should be based on underlying economic merit, not tax treatment. Capital should flow to where it is most productive. And the system should support participation in the workforce.9
While there are principles of tax reform that most can agree on, different people, in different circumstances, with different world views, will have different perspectives on what good tax reform looks like. Any proposed package of reforms will have its critics.
The tax reforms set out in the Budget have drawn on work by tax experts, think tanks and the Parliament over many years, including business and community perspectives.
A key theme of these recent debates has the been the taxation of capital income, and the horizontal, vertical and intergenerational equity implications when compared with labour income.
Labour and capital income are both of value to individuals – they both reflect returns to effort and investments, and enable consumption and higher living standards.
Unlike wage and salary income, however, capital income can be more easily shifted to minimise tax outcomes, effectively narrowing the tax base. It can be directed towards more concessionally taxed forms and can be distributed to taxpayers with lower marginal rates, principally through trust and company structures. Individuals can also move capital income across time, for example realising income and capital gains when marginal rates are lower.
Traditionally, impacts of tax policy have been examined through a static lens, with a focus on single year impacts. This prism does not make sense when examining the taxation of capital, the benefits of which accrue over time and the realisation of which is often lumpy.
Significant investments made into data integration in recent years have enabled Treasury to now consider these issues from a life course perspective, informed by behaviour that we actually observe in the tax system.
We have used longitudinal tax data analysis to examine lifetime outcomes of the current system of taxation on labour and capital income, and have used these to examine the likely lifetime impact of changes to the system.10
This analysis shows a number of features of the current tax system that were highlighted in Budget Statement 4.
Let me outline a few.
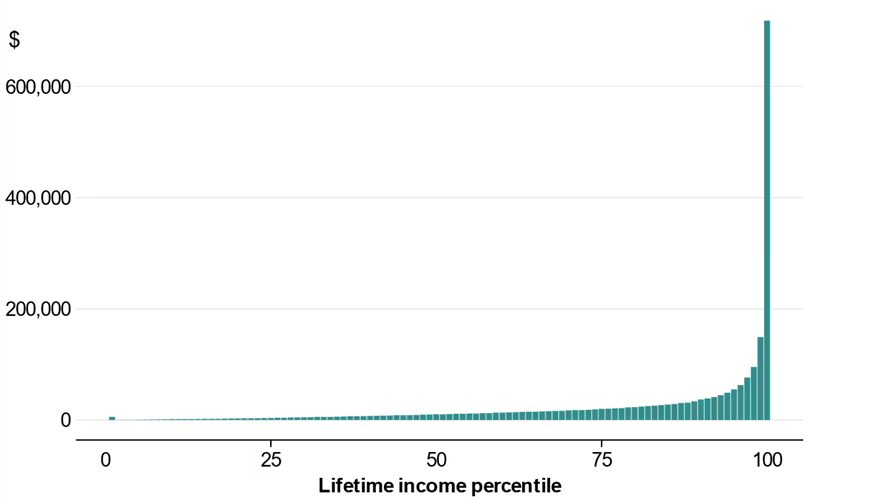
First, this analysis has quantified the lifetime benefits that flow from the combination of the existing capital gains tax, negative gearing and trust arrangements (Chart 7). It shows that these arrangements deliver substantial benefits to those with the highest lifetime incomes.
It shows that since 2000, the average person in the top 1 per cent of lifetime income earners has benefitted from these arrangements by more than $700,000 over their working lives. By way of contrast, the median income earner is assessed as having benefited to the tune of around $10,000* over their working lives.
Chart 7: Tax benefits of negative gearing, the capital gains
discount and use of discretionary trusts, by lifetime income
Source: ATO and Treasury
Note: This analysis follows people aged 35–45 in 1999 through to 2023. Lifetime income (from which the percentile is derived) is the sum of each individual's total income or loss relative to contemporaneous AWOTE over this period. This chart shows how much extra tax per person would have been due over that period on average within each percentile if the full nominal value of capital gains were included in taxable income, if rental losses were excluded from the calculation of taxable income, and if each discretionary trust concentrated its annual distributions solely to the person who had the highest lifetime income among its observed beneficiaries. As such, it does not indicate a magnitude of revenue that could be raised from reforms (see Budget Statement 5: Revenue for expected revenue impacts of these reforms).
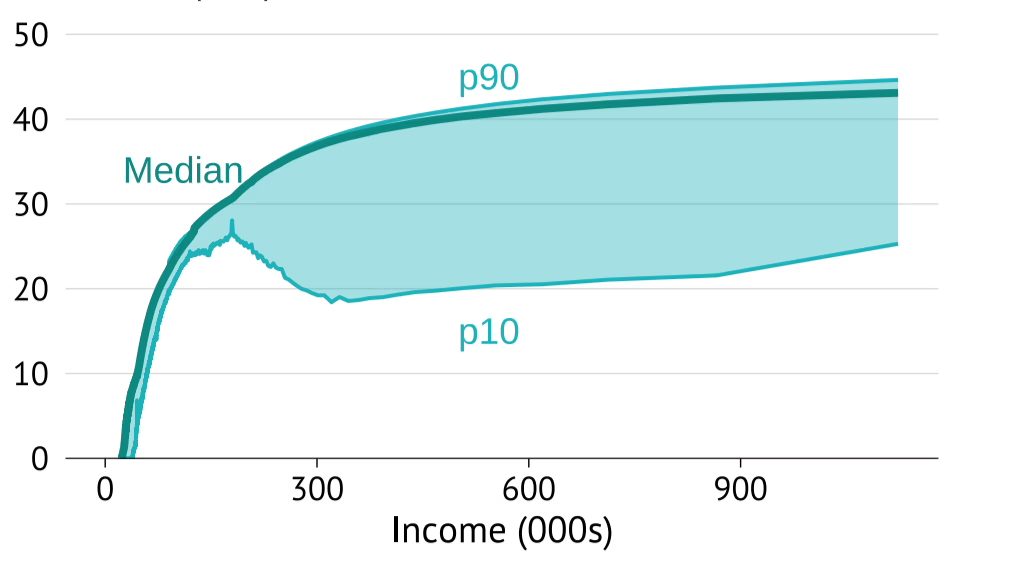
This outcome accords with analysis conducted by e61, which examined the distribution of effective tax rates applying to individuals at different income levels (Chart 8).11 It found that for individuals with incomes above around $190,000, the relationship between effective tax rates and income breaks down. In fact, around 10 per cent of income earners with incomes above $300,000, face an average tax rate closer to that of wage and salary earners earning around $50,000.
On the face of it, these outcomes seem inconsistent with the concept of ‘ability to pay’ which underpins a progressive income tax system and highlight how concessions narrow the tax base.
Chart 8: Distribution of effective tax rates by income
Source: e61
Note: This analysis shows the dispersion of effective tax rates across income levels. Effective tax rates are calculated on a comprehensive income basis. p10 and p90 refer to the effective tax rates paid by individuals in the 10th and 90th income percentiles.
The budget also illustrated that the opportunity that is presented in the current tax system for individuals to shift the timing of the sale of assets to optimise tax outcomes is clearly affecting these decisions.
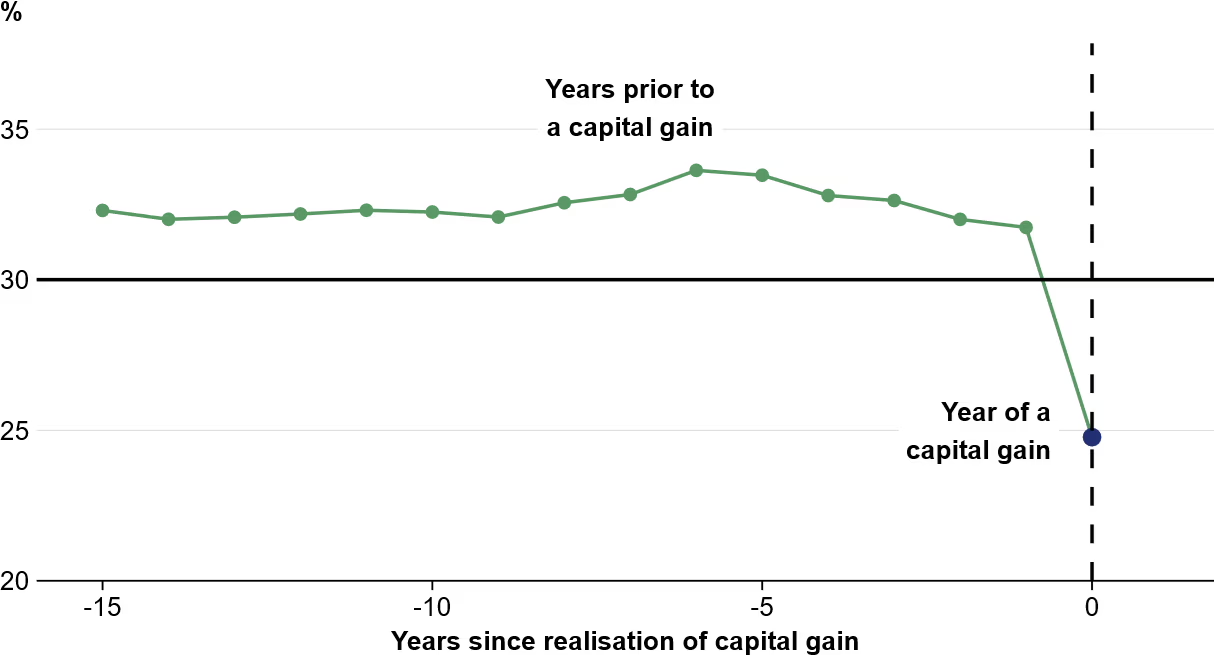
Analysing data over the past 15 years, Treasury finds that investors systematically deferred the realisation of capital gains to years when their marginal tax rate was lower. The average marginal tax rate faced by investors in years when they realised a capital gain was roughly 7 percentage points lower than the marginal tax rate paid by these same taxpayers over the previous 10 years (Chart 9).
Such an outcome has equity implications, given that capital gains typically flow to those with high lifetime incomes. But it also impacts economic efficiency as it suggests that taxpayers may be delaying when they sell assets based on tax settings, which may be impeding assets moving to higher valued uses.
Chart 9: Marginal tax rates, by years since realisation of a capital gain
Source: ATO and Treasury
Note: Average marginal rates are calculated before any capital gains income and are weighted by the size of the capital gain in the final year. Includes people with capital gains between 2009–10 and 2022–23.
The budget analysis also provided an assessment of the extent to which the 50 per cent CGT discount effectively compensated investors for the effect of inflation, arguably the strongest case for preferential capital gains tax treatment. It showed that a fixed rate discount cannot deliver an appropriate inflation adjustment across a varied population of investors, assets and time periods.
The real effective tax rate applying under the 50 per cent discount falls as returns increase, and in this respect, moving to taxing real gains from a fixed discount shifts the system towards a more neutral treatment of investment opportunities.
The reforms in the Budget sought to take a balanced approach to all of these considerations by:
- Directly adjusting taxable capital gains across all assets for the impacts of inflation to improve neutrality
- Reducing a range of concessions that disproportionately accrue to those earning the highest lifetime incomes by introducing minimum tax rates in the capital gains and trust taxation arrangements
- Reducing tax paid on income from work and creating the architecture to target tax reductions to labour income, to maintain incentives to work
- Supporting productivity by improving the treatment of losses for small businesses, expanding venture capital concessions, making the instant asset write off permanently higher and better targeting the research and development tax offset, and
- Introducing measures to further simplify the operation of the tax system, reducing compliance costs through measures such as dynamic instalments.
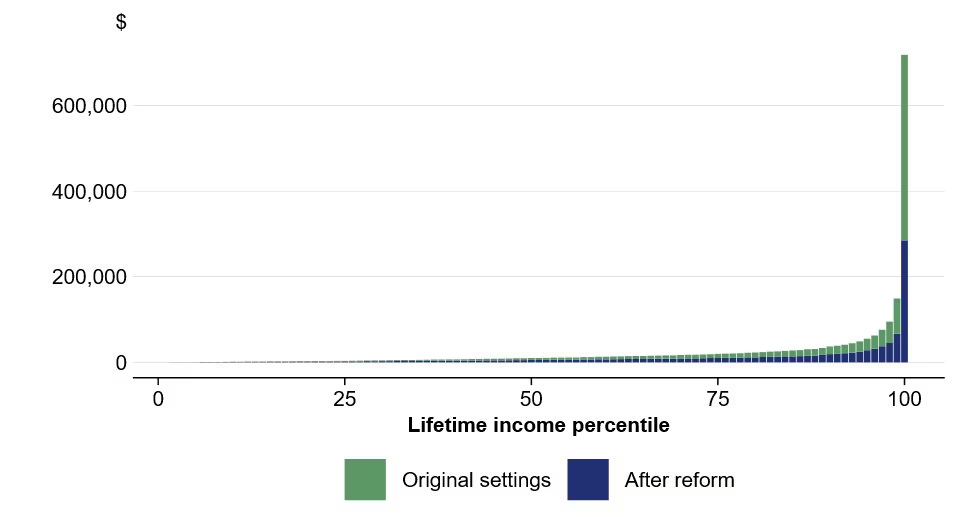
Treasury has analysed the indicative impact of these reforms compared with current settings. It shows that if the proposed tax settings on capital gains, negative gearing and trusts had been in place since the turn of the century, the lifetime benefits of these arrangements for the top 1 per cent of lifetime income earners would have reduced from around $700,000 to around $300,000. Sixty per cent of the additional tax raised would have been paid by individuals in the top decile of lifetime income earners (Chart 10).
Chart 10: Tax benefits before and after reform by lifetime income percentiles
Source: ATO, Treasury
Note: The analysis behind this chart follows individuals aged 25– 35 in 1991 through to 2023. An individual's lifetime income percentile is calculated from the sum of AWOTE-deflated total income earned over this period compared with those born in the same year. This chart shows for each percentile of lifetime income so calculated, the average extra tax that would have been due if the Budget tax reforms (dark) or the counterfactual of no CGT discount, no negative gearing, and all discretionary trust income concentrated on a single beneficiary per trust (translucent) were retrospectively put in place from 2000- instead of the existing settings. As such, it is not interpretable as a magnitude of revenue that could be raised from reforms.
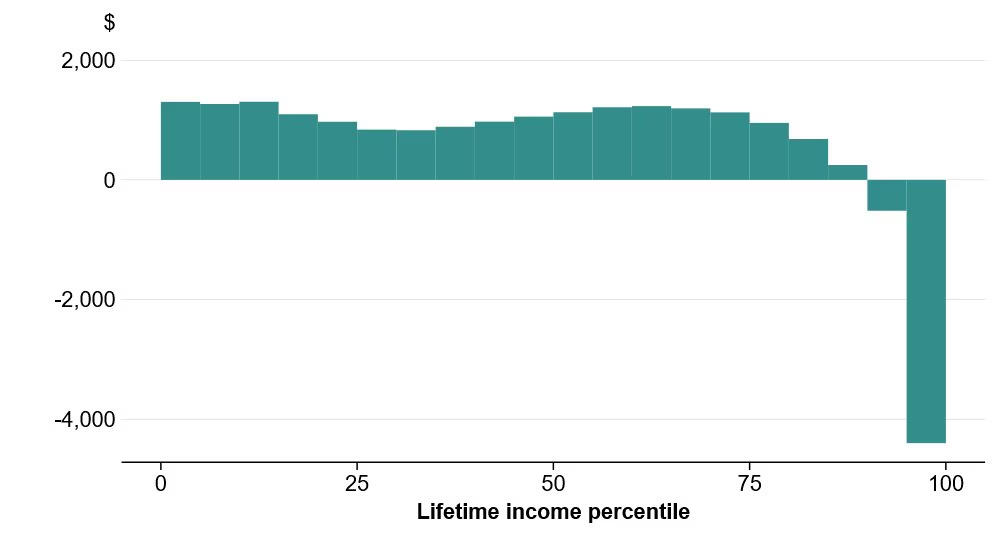
For young people, in particular, our assessment is that around 90% per cent of Australians would have been better off by age 30 had the proposed changes been in place from 2000, with the benefits of the WATO and instant deduction outweighing the impact of the savings tax changes (Chart 11).
Chart 11: Tax benefits of reform for a 30 year old
Source: ATO and Treasury
Note: Each column spans 5 percentiles. The height is the modelled total hypothetical tax liability change per person by age 30 if the proposed policy had been in place from 2000, averaged by within birth cohort vigintile, including the same caveats as chart 10.
On housing, the reforms are estimated to increase the home ownership share by around 1 percentage point over the medium term, equivalent to reversing a decade of declines. Over the next decade, owner‑occupiers are projected to own around 75,000 more homes than they would have otherwise. This reallocation of housing stock, which improves opportunities for first home buyers, is a result of reduced investor demand in the existing housing market.12
Reforms on this scale have understandably generated considerable interest.
In some instances, this may largely reflect the fact that individuals are sensitive about paying additional tax, which is understandable. But revenue needs to be raised from somewhere and taxes applied to labour income also have economic impacts.
There have been a range of concerns about whether these changes would adversely affect small business and startups. The Government has committed to consult on these issues, taking into account the existing CGT exemptions and concessions for small businesses, noting that 90 per cent of small businesses are currently eligible for, and will continue to be eligible for, at least one of these concessions. 13 There are a number of measures in the budget that are specifically designed to support innovative activities in small businesses, including loss refundability, increases in venture capital concessions, and higher refundable concessions for research and development activity.
There have been suggestions that the proposed tax settings do not sufficiently reward risk taking in business settings and will deter productive investment. OECD research suggests there is not clear evidence to support favourable treatment of capital gains to promote investment, beyond compensating for inflation.14 The proposed CGT treatment more accurately adjusts for inflation and should improve efficiency of capital allocation on this account. Applying the new arrangements to income across all assets is important from a tax design perspective to avoid introducing a significant new distortion into the tax system.
Finally, there has also been an argument that while the reforms are focussed on improving intergenerational equity, there are some younger people who will not benefit from the changes. This reflects the unavoidable trade-offs involved in system-wide reform. As shown above, the cumulative impact of the reforms is assessed as benefiting around 90 per cent of young people, before impacts in the housing market are taken into account. Some young people who achieve high returns on their investments may pay more tax, but they will still benefit from high after tax returns.
These are the most significant reforms to the tax system in a quarter of a century. The reforms address a number of long standing concerns. Overall, our assessment is that these reforms will contribute to arresting the decline in home ownership rates, improve the efficiency of the taxation of capital, and support a modest reduction in the tax burden on labour income.
Core provisions around the working Australian tax offset, capital gains tax, negative gearing and the instant tax deduction have been introduced into the Parliament this morning. Consultations around implementation will continue over coming months ahead of further legislation to cover more complex and additional elements of the reforms being introduced.
Conclusion
In conclusion, I would just like to reflect that the 2026-27 Budget was a significant undertaking for the Treasury, and particularly given the evolving shock flowing from the Middle East conflict.
Our work has been focussed on helping the Government address the near-term challenges while undertaking significant reforms to reduce debt and build resilience, so the economy and the budget are best prepared for whatever comes ahead.
Thank you all very much.
1 I would like to express my appreciation to Jeremy Lawson, Kat Di Marco, Angelia Grant, Diane Brown, Shane Johnson and Lydia Wang for their assistance in drafting this speech.
2 Most notable was how China’s export patterns changed. While China’s exports to the United States fell by almost 30 per cent over the course of 2025, there was an increase in China’s exports to other regions. China’s exports to the ASEAN region rose by 30 per cent and to the European Union by 7 per cent. And China’s exports continued to pivot towards higher quality intermediate and capital goods, particularly electronics and semiconductors.
3 Changing the permitted sulphur content of fuel allowed more Australian produced fuels to be used domestically. Reducing the Minimum Stockholding Obligation increased the flexibility of domestic supply. Temporarily relaxing regulations on heavy vehicle load and operating hours improved transport efficiency.
4 Treasury (2026) Budget Paper No. 1, pp.67-70
5 International Monetary Fund, April 2026 Fiscal Monitor – Methodological and Statistical Appendix.
6 See, for example, OECD (2025), The Global Forum on Productivity at 10: Past and Future Perspectives on Reviving Productivity Growth, Paris; World Economic Forum (2025), Global Economic Futures: Productivity in 2030, Geneva; Department for Science, Innovation & Technology (2023), AI 2030 Scenarios Report HTML (Annex C), United Kingdom; World Bank (2021), Global Productivity: Trends, Drivers, and Policies, Washington DC
7 Congressional Budget Office (2026), The Budget and Economic Outlook: 2026 to 2036, Washington DC
8 Growth mindset: How to fix our productivity problem | Productivity Commission
9 This is taking a system wide perspective. Of course, tax can also be used in place of grants to support particular policy objectives.
10 ALife ("ATO Longitudinal Individual Files") is a longitudinal data set which includes data from individual personal income tax returns between 1991 and 2023. The data is complete over the lodger population and has excellent coverage of contemporaneous taxable income fields but is not a full economic ledger of the Australian population.
11 Kaplan, Maltman and Nolan (2025), Who pays income tax?, e61, https://e61.in/wp-content/uploads/2025/07/ETR_Micronote.pdf
12 Box4.4, Budget Paper 1, Budget Statement 4 and forthcoming Treasury Technical Paper 'Housing market impacts of negative gearing and capital gains tax reforms’.
13 There are 4 small business CGT concessions: The 15-year exemption, the retirement exemption, the 50 per cent active asset reduction, and the small business rollover. These are available to small businesses with turnover below $2 million or net value of assets less than $6 million.
14 Hourani, D. and Perret, S. ‘Taxing capital gains: Country experiences and challenges’, OECD Taxation Working Paper, OECD, 2025.
* This figure was incorrectly delivered in the speech as around $5,700 due to a transcription error.