Downloads
Thank you for the opportunity to speak to you today1, ten years on from the first Intergenerational Report (IGR), which came to life as Budget Paper No. 5 in the 2002-03 Budget.
I suspect the authors of the first IGR took quiet pleasure from the growing reputation of their new offspring, as it became one of the most well-regarded and widely read documents produced by the Commonwealth public service for the Government, and as it was increasingly emulated in other countries.2
This workshop provides an opportunity to reflect on the ten year history of the Intergenerational Reports, and to think about ways in which they might evolve in future.
In my remarks, I will focus on three aspects of the Intergenerational Reports. First, I want to talk about how they have helped to lengthen the horizon of public policy analysis in Australia, enabling governments to focus on the longer term implications of policy changes, particularly their fiscal implications. Second, I want to talk about Commonwealth-State issues. The Intergenerational Reports examine fiscal sustainability from the Commonwealth's perspective, but fiscal sustainability is of course also an issue for the States and Territories. And third, I want to talk about an issue that has again been highlighted by the global financial crisis, the issue of contingent fiscal liabilities, both implicit and explicit.
The Intergenerational Report and its Contribution to Sound Policy Outcomes
The IGR came to life as a key requirement of the 1998 Charter of Budget Honesty Act. The Charter requires an intergenerational report to
"assess the long term sustainability of current Government policies over the 40 years following the release of the report, including by taking account of the financial implications of demographic change".
Along with the commitment to publish regular Intergenerational Reports, the Charter of Budget Honesty also specifies requirements for sound fiscal policy, regular budget reporting, and pre-election reporting and costing of proposed policies (signed off by the Secretaries of the Departments of Treasury and Finance).
While some countries have similar fiscal arrangements, including equivalents of the IGR, the development of an increasingly well-articulated fiscal framework over the past few decades has contributed to Australia's current fiscal strength, in both absolute and relative terms, in obvious contrast to most other developed economies. Australia's fiscal framework, including the Intergenerational Reports, represents a significant achievement, with bi-partisan support, that should be recognised and built upon.
The first IGR was one of the earliest publications produced by any national government presenting detailed longer term demographic and fiscal projections. It played a major role in raising community awareness of long-term fiscal challenges and, in so doing, placed greater focus on Government decisions with long term consequences.
In earlier times, governments in Australia and elsewhere typically made spending commitments without any systematic attempt to estimate, or address, their long term fiscal consequences. The IGR has made an important contribution to changing this pattern of behaviour.
Let me give some examples. In conjunction with the release of the first IGR, a package of measures was introduced to begin to rein in the growth of the Pharmaceutical Benefits Scheme (PBS), which the first IGR highlighted as by far the fastest growing component of Commonwealth government health expenditures. The measures included increases in co-payments for PBS medicines, as well as measures to ensure that both the pharmaceutical industry and doctors also contributed to reducing the cost of the PBS.
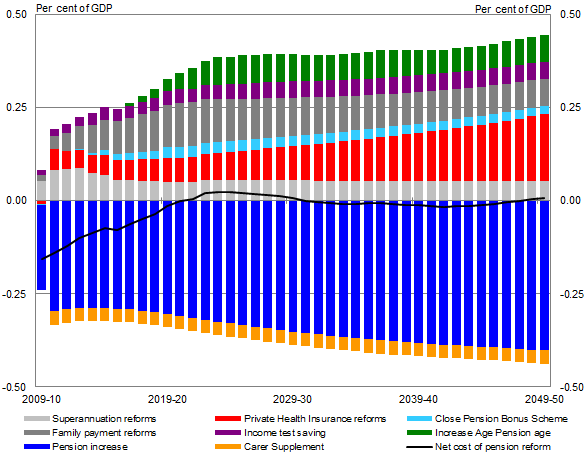
Seven years later, in the 2009-10 Budget, the Government announced increases to age pension payments, which are indexed to earnings, and the introduction of annual supplements for carers – policy changes with obvious long term fiscal implications.
But rather than being introduced in isolation, they were instead introduced along with a suite of budget saving measures designed to offset completely their long term costs. The budget saving measures included a gradual rise in the qualifying age for the age pension (to be phased in from 2017 to 2023), means testing of the private health insurance rebate, as well as reforms to family payments and superannuation. The package of changes was projected to be budget neutral by 2021-22 and through to 2049-50 — an indication of how policy was influenced by the long-term perspective of the IGR (Chart 1).
It is worth making a subsidiary point about this package of reforms. In order to draft Intergenerational Reports, the Treasury had to develop, and refine, the capacity to do detailed long term economic and fiscal projections across a broad range of public policy areas. Once developed, this capacity could be used to good effect to inform policy makers about the likely longer term fiscal implications of suggested policy changes. This package of reforms from the 2009-10 Budget provides a particularly good example of this capacity in action.
Chart 1: 2009-10 Budget pension reform package

Source: Australian Government, 2009-10 Budget, Budget Paper No. 1, p 1-37.
The pension package was not the only feature of the 2009-10 Budget reflecting a longer term fiscal focus. The Budget outlined the Government's discretionary fiscal response to the global financial crisis. As well as reporting on the macroeconomic and fiscal aggregates over the four forward estimates years, the budget also introduced 12-year medium-term projections, which showed projected profiles for the budget balance and net government debt out to 2019-20.3
There are several other examples of the IGRs helping to motivate significant reforms with long term consequences. The Future Fund was established to help meet the long-term cost of Commonwealth public sector superannuation liabilities. Over the past decade, several policy changes have been implemented to encourage greater labour force participation by those drawing on Disability Support Pensions.4
And the IGR's policy impact extends in other directions as well. Although the first IGR had a strong fiscal focus, a week after its release, the then Treasury Secretary elaborated on an implicit economic message: that the projected fiscal gap could be closed through faster GDP growth.5 That was when the importance of the 3Ps — participation, productivity and population — was first enunciated, and it has become a prominent feature of the IGRs — and economic debate more broadly — ever since.6
Taking the 3Ps in turn, debate on participation and its impact on both GDP and wellbeing has been prominent over the past decade. Debate on productivity has grown as the productivity slowdown has become apparent. And debate on the appropriate size of Australia's future population was sparked in 2009, when the population projections being prepared for the third IGR were announced. While these debates remain unresolved, the IGR's promotion of such debate represents one of its most important contributions.
A Focus on the Commonwealth
Although a number of the achievements associated with the IGR have a clear Commonwealth-State dimension, it is as well to recognise that the Charter of Budget Honesty requires IGRs to assess the policies of the Commonwealth Government, rather than those of
state and territory governments.
This is a noteworthy limitation, given the significant responsibilities of these governments. Indeed, in some circumstances, concerns about projected fiscal gaps may be greater at the State level than at the Commonwealth level because both the base for efficient taxation and the capacity to borrow are more limited for States and Territories.7
Furthermore, given the nature of the Federation, the longer term fiscal position of State and Territory Governments is of considerable interest to the Commonwealth Government. At various times in Australia's history, the Commonwealth has underwritten State borrowing, borrowed on behalf of the States and, in the depths of the Great Depression, taken responsibility for meeting the foreign interest payments of the NSW Government under Jack Lang.8 Shared responsibility for major service areas provides another reason for the Commonwealth's abiding interest in the longer term fiscal position of the States and Territories.
Generating consolidated projections of public finances across the federation is, however, a major undertaking. Having been given the task in mid-2004, the Productivity Commission produced its 428 page 'Economic Implications of an Ageing Australia' Research Report after nine months.9
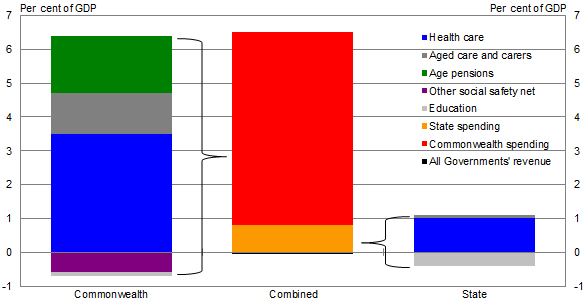
Chart 2: Ageing-related fiscal pressure across tiers of government

Note: 'Fiscal pressure' is the change in fiscal balance over the forty years to 2044-45, and hence differs somewhat from the fiscal gap presented in the IGR. Results are for the Commission's 'base case'. 'State spending' is that not covered by Specific Purpose Payments. The Commission assumed that income tax and excises rise in line with GDP.
Source: Productivity Commission, 2005, 'Economic Implications of an Ageing Australia', Research Report, p306-12.
The Commission projected nationwide, ageing-related fiscal pressure of around 6.4 percentage points of GDP by 2044-45 (Chart 2). Based on past trends — and an assumption that age-related Specific Purpose Payments would be adjusted in line with the associated service needs — the Commission expected most of this aggregate fiscal gap to be borne by the Commonwealth Government, but with significant projected burdens also faced by State and Territory Governments. In common with the IGRs, the Commission projected that ageing-related spending pressure would be dominated by health spending, particularly non-demographic increases in costs.10
While a whole-of-government IGR would be a major undertaking, this is not to deny the merit of the idea.
It is nonetheless worth noting that the lack of a whole-of- government IGR has not stopped the development of policy that deals with long-term fiscal issues between the levels of government. For example, a significant motivation for the 2011 National Health Reform Agreement was the relative long term fiscal capacities of the Commonwealth and the States and Territories.
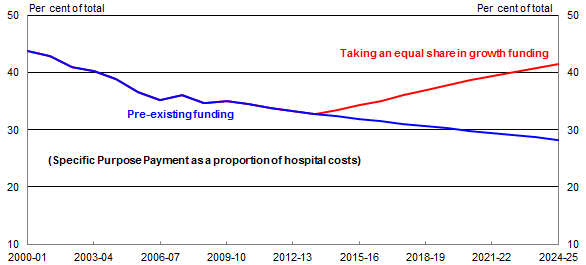
Under National Health Reform, the Commonwealth Government will increase its contribution to efficient growth funding for hospitals to 45 per cent in 2014-15, increasing to 50 per cent from 2017-18. Without this reform, IGR-style projections suggest that State and Territory government budgets would be overwhelmed by rising health spending within a few decades.
Chart 3: Share of hospital expenditure funded by the Commonwealth
under the 2011 National Health Reform Agreement

Note: Commonwealth share of hospital expenditure is based on funding provided through the Healthcare SPP and the additional growth funding. It does not include Commonwealth expenditure on DVA patients, expenditure on the private health insurance rebate or other Commonwealth expenditure on hospitals (including National Partnerships). Based on AIHW estimates, including these amounts raises the Commonwealth's share by around 1 percentage point in 1998-99, rising to around 5 percentage points in 2008-09.
Source: Treasury estimates.
An 'On Budget' Focus
Let me now turn to my third topic: the 'on budget' focus of the IGR. The IGR reports budget and balance sheet aggregates for the Commonwealth general government sector. It does not attempt to capture contingent (fiscal) liabilities and assets.
Contingent liabilities have become topical in recent times, especially in light of the recent bank bailouts in Ireland and earlier bailouts during the Asian financial crisis. While these were not realisations of formal, explicit contingent liabilities, they nonetheless highlight the damage that can be done to public sector finances by balance sheet shocks including the realisation of contingent liabilities, especially in times of extremis.11
In many cases, governments' taking on contingent liabilities represents sound public policy, and most contingent liabilities have minimal impact on fiscal sustainability. That said, it is important to be mindful of any accumulation of correlated risks.
The number of formal contingent liabilities reported in the Budget has increased over the past decade. This includes unquantifiable contingent liabilities in the Treasury portfolio, including the financial claims scheme and the time-limited guarantees of State and Territory borrowing, large deposits and wholesale funding (with the public policy rationale that global financial markets were, at the time, hardly discriminating at all between solvent and insolvent borrowers). These liabilities sit alongside longstanding contingent liabilities reported in the Budget's Statement of Risks, such as those associated with the Commonwealth's offer of assistance to the States in meeting Native Title costs, and wide-ranging guarantees and undertakings provided by the Department of Defence.
Our capacity to credibly account for contingent liabilities is limited. Many contingent liabilities are unquantifiable. Assessing the likelihood of realisation is extremely difficult both because of the low frequency of realisations in the past and the perennial problem that the past need not provide a good guide to the future.
Even if we were to credibly account for explicitly acknowledged contingent liabilities, issues would remain about any implicit contingent liabilities, and the possibility of governments taking on new liabilities in times of crisis.
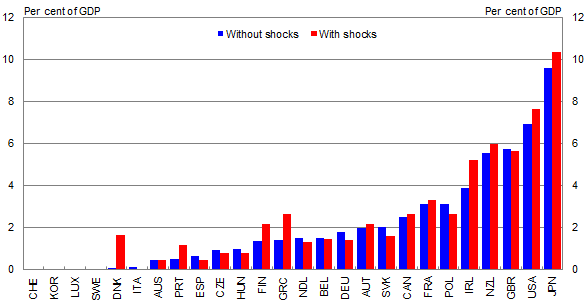
In a novel approach, researchers at the OECD have recently explored ways to refine long term fiscal projections to capture the risk of balance sheet shocks such as the realisation of contingent liabilities. They estimate the variance-covariance matrix of each country's balance sheet shocks, use these estimates to create a distribution of possible future balance sheet shocks, and then calculate the additional fiscal tightening required to ensure that a fiscal target achieved in the absence of the stochastic shocks would be achieved in 75 per cent of simulations (Chart 4).
Chart 4: Fiscal implications of balance sheet shocks
(Change in primary balance to make gross liabilities 50% of GDP in 2050)

Note: Change from the primary balance projected by the OECD for 2012.
Source: Merola, R. and D. Sutherland (2012), “Fiscal Consolidation: Part 3. Long-Run Projections and Fiscal Gap Calculations”, OECD Economics Department Working Papers, No. 934.
This approach suggests that some OECD countries would need to undertake additional fiscal tightening to allow for the possibility that their history of contingent liability realisations and other balance sheet shocks will continue into the future. In contrast, the projections for other OECD countries are improved by projecting historical balance sheet shocks into the future (with the projection for Australia essentially unaffected).
At first blush, the chart suggests that accounting for balance sheet shocks generates only minor differences, relative to the case when these shocks are ignored. But it is worth noting that the changes to primary balances shown in the chart are immediate and permanent changes. The results might also underplay the importance of balance sheet shocks, since missing a fiscal target in 25 per cent of simulations might be considered unacceptable.12
While it seems fair to say that analysis of the implications of contingent liabilities and balance sheet shocks has some way to go, they are sufficiently important to warrant the development of new techniques to analyse them.
Ultimately, however, the most important message from this work is to highlight the importance of continued prudence in taking on contingent liabilities, and the critical role played by sound macro and microeconomic management in reducing the possibility that significant liabilities will be realised.
Conclusion
The IGR has been a big success. Valuable tools have been developed to undertake long term economic and fiscal projections across a broad range of public policy areas. These tools have been put to good use to inform policy makers about the likely longer term fiscal implications of policy changes.
Nevertheless, we need to be aware of the IGRs limitations, and keep an open mind on options for improvement.
Thank you for your attention.
1 Address by the first author to the Melbourne Institute 'Intergen + 10' conference
2 On a personal note, the 2002-03 Intergenerational Report was the first document I read when I arrived at the Treasury in January 2003, and it formed the basis of the first work I did at the Treasury.
3 The Budget also compared the economic projections with those in the second IGR; and committed the Government to publishing the third IGR before the subsequent Budget. See Henry, Ken (2009), 'Contemporary Challenges in Fiscal Policy, Address to the Australian Business Economists', 19 May, for further discussion.
4 Analysis of spending on DSP by age-and-gender has featured in the IGRs.
Further changes to DSP eligibility criteria, including participation requirements for recipients aged under 35 with a work capacity of at least eight hours a week, come into effect in July.
5 Henry, Ken (2002), 'On the Economy and Fiscal Policy: Address to the Australian Business Economists', Sydney, 21 May.
6 The 3Ps framework can be extended to the much less elegant '3Ps and an E' framework. The Employment of participants in the labour force is important, as both a determinant of GDP, and a policy goal in its own right — an observation painfully apparent to countries currently suffering high unemployment rates.
7 Furthermore, they are arguably less able to close their fiscal gaps through promoting economic growth in their jurisdiction. Increased revenue arising from additional economic growth in any specific State is partially redistributed to all States and Territories, as a consequence of horizontal fiscal equalisation.
8 For a recent reference, see Senate Standing Committees on Economics (2009), Inquiry into the Guarantee of State and Territory Borrowing Appropriation Bill 2009, Chapter 2.
9 Ralph Lattimore, who headed the research team behind the Report, will be presenting here later today.
10 The Productivity Commission estimated that ageing-related fiscal pressure would also come from spending on the age pension and aged care, offset to some degree by less spending on education and payments that favour younger age groups, like family and unemployment payments. The Commission also projected small ageing-related favourable revenue effects, driven largely by higher conveyancing duties associated with smaller household sizes.
11 Bank recapitalisation in Ireland is estimated to have cost around 40 per cent of GDP (International Monetary Fund, 2012, “Ireland: Fifth Review Under the Extended Arrangement”, Country Report No. 12/48, 13 February). Financial sector recapitalisation costs during the Asian financial crisis were estimated to be 10 per cent of GDP for Malaysia, 16 per cent for Korea, 32 per cent for Thailand and 58 per cent for Indonesia (World Bank, 1999, “Global Economic Prospects and the Developing Countries 2000”, 20039, December).
12 Furthermore, limits on the available historical data may mean that the results are overly influenced by the 'Great Moderation' prior to the global financial crisis, when growth was reasonably steady and balance sheet shocks reasonably limited.