Downloads
Introduction
I am grateful to the University of Queensland School of Economics, the UQ Economics Alumni Association, the Queensland branch of the Economic Society of Australia and Queensland Treasury for inviting me to deliver the nineteenth Colin Clark Memorial Lecture.1
My topic today is: What have we learnt? The Great Depression in Australia from the perspective of today. I am interested in particular in what lessons were learnt from the experience of the 1930s, and how these lessons have informed more recent economic policy decisions. By more recent economic policy decisions, I have in mind not only the policy responses to the current global financial crisis, but also the policy frameworks put in place in the modern era that have rendered the economy much more resilient to macroeconomic and financial shocks.
Along the way, I will do my best to enliven the narrative with reflections on Colin Clark's life, on his perspectives on the Great Depression and the policy responses to it.
The intellectual figure that towered over the Great Depression and its aftermath was, of course, John Maynard Keynes. Colin Clark's close links to Keynes are well known — as is the fact that Keynes quotes Clark in the General Theory (1936), and referred to him several years earlier as 'a bit of a genius' (Keynes 1931).
At the time of the stock market crash in October 1929, Colin Clark was a young man of 23 and just beginning his career as an economist graduating in chemistry at Oxford the year before. There can be little doubt that his achievements in economics over his long and productive career — including his pioneering work in co-founding (with Simon Kuznets) modern national income accounting — were greatly influenced by the upheavals and hardships he witnessed during the Great Depression.
Beyond Colin Clark's professional achievements in economics and statistics, there is another aspect of his life that particularly resonates with me: his lifelong belief in the tangible improvements to people's lives that could be made through better economic policy making. This was highlighted in his decision in 1938 to reject overtures from Keynes in Cambridge, as well as the University of Chicago, to pursue a career as an academic economist in favour of working as an applied economist in the public sector in Australia.
Although I never met Colin Clark, I do have a familial link to him — I have worked with his grandson and namesake for the past couple of years at the Treasury. And I am most grateful to grandson Colin for his help preparing this speech and for the insights he has given me into his grandfather.
Grandfather Clark's sheer enthusiasm to 'practice what he preached' is palpable in a letter he wrote to Keynes in 1938 about his decision to stay in Australia. As he put it, the chance to advise the Queensland Premier on 'practically everything connected with economic matters' was 'too remarkable an opportunity to be missed for putting economics into practice' (Markwell 2000).
In the 1930s, economists in Australia (and elsewhere) did not enjoy anything like the level of influence over public policy that they do today (Coleman et al 2006). So Colin Clark's choice was important, and it reaffirms the career choices of thousands of economics graduates in Australia over past decades who also put economics into practice in their day-to-day work in a range of public sector organisations, at both the Commonwealth and State levels.
The global context
Before turning to the Australian experience, I will spend a few minutes on comparisons between the Great Depression and the current global recession for a broad set of countries.
For many countries (though with some notable exceptions like the UK and Germany), the 1920s was a decade of rapid growth and rising prosperity. Asset markets had been booming fuelled by easy credit. US stock prices more than tripled in the five years leading up to October 1929. There had been rapid financial innovation and increased leverage by both financial institutions and households. They were not called the roaring twenties for nothing. The similarities with the lead-up to the current global recession are clear enough.
Although the two upswings were brought to an end by different means — by the Wall Street crash in October 1929, and by the credit crisis that began in August 2007— the ensuing events also had some striking similarities.
Looking at GDP first, we see that real GDP in OECD countries during the first year of the current recession fell by only slightly less than in the first year of the Great Depression (an estimated 4.1 per cent rather than 4.9 per cent) (Chart 1).2
Of course, what turned a recession in the 1930s into the Great Depression was the continued collapse in economic output for the subsequent two years, before recovery took hold in 1933. By contrast, in the current global recession, we are now seeing signs of recovery in most OECD countries, and most forecasters expect this recovery to strengthen over the next year or so.
Chart 1: Real GDP in OECD countries
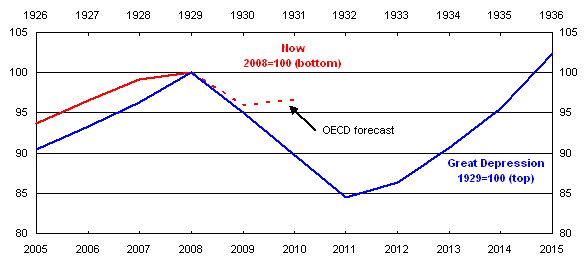
Note: OECD data for the Great Depression are estimates and exclude Czech Republic, Hungary, Luxembourg, Poland, Slovakia and Turkey.
Source: GGDC-Maddison International Historical Database (http://www.ggdc.net/Maddison/) and OECD Economic Outlook, No 85, June 2009.
Turning to trade, large falls in world trade were a feature of both the Great Depression and the current global recession. While world trade volumes fell by 30 per cent over three years in the Great Depression, they fell much more sharply in the current recession — by almost one-fifth since early 2008 (Chart 2).
Chart 2: Volume of world trade
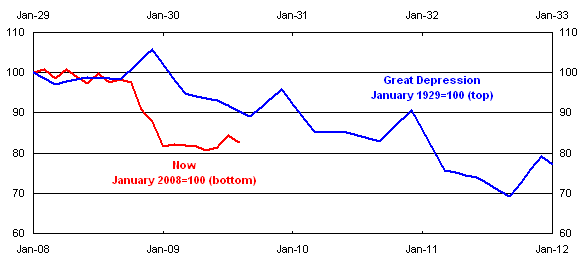
Source: CPB (2009) and League of Nations (1939) compiled in PC (2009).
There are also broad similarities in the magnitude of the falls in the US stockmarket in the first 18 months of the two crises. There had been an extended period of strong growth in stock prices before both crises.3 In October 1929, the Dow Jones industrial average fell sharply, by 48 per cent by early November 1929. Following a rally in early 1930, the market continued to fall steadily for a further two years to record a scarcely believable 90 per cent collapse from the peak (Chart 3).
Chart 3: US stock market
(Index)
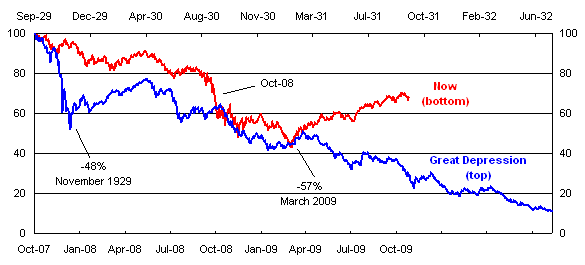
Note: Current data are S&P 500. Data for Great Depression are Dow Jones Industrial Average.
Source: Standard and Poors 2009.
During the current crisis, US stock price falls were more gradual over the first 12 months, reflecting different patterns of transmission in the two crises. The financial crisis which preceded the Great Depression began with a stock market crash and then spread to the banking system. In contrast, the current financial crisis began in the credit markets and then spread to the banking system and the stock market.
Sharp falls in the S&P 500 following the collapse of Lehman Brothers meant that a year and a half from the most recent stockmarket peak in the US, the total decline was comparable to that of the Great Depression. By contrast, however, in the six months since then, US s
hare prices have recovered strongly.
Australia
Unlike in the US, the lead up to the two episodes in Australia was quite different. In the current episode, Australia had experienced 17 years of uninterrupted growth, declining unemployment and, in the past five years, booming terms of trade. By contrast, the years leading up to the Great Depression were much less buoyant. Then, the Australian economy had experienced no real growth for five years and, as a consequence, unemployment was rising. Furthermore, as we will see, Australia was in the midst of a balance of payments crisis.
There were, however, some points of similarity. In common with the US, Australia's stockmarket experience was similar to that in the Great Depression, at least in its early phase.
Both crashes were preceded by periods of strong growth in stock prices. Furthermore, the falls during the current downturn are of a similar magnitude to those in the first 12-18 months of the Great Depression (Chart 4).
Chart 4: Australia's stock market
(All Ordinaries)
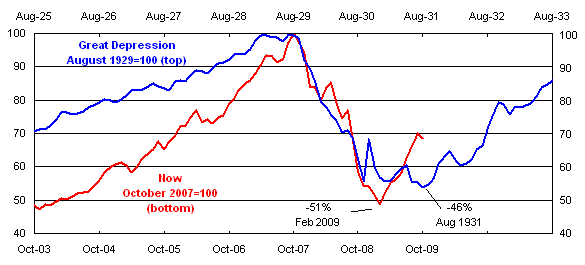
Note: Current data are monthly (period end) while Great Depression data are monthly average.
Source: Thomson Reuters, Wren Research (http://www.wrenresearch.com.au/downloads/).
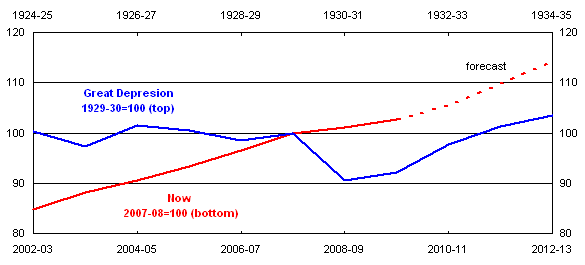
As most other indicators demonstrate, however, Australia's experience in the two episodes was starkly different. Following five years of essentially no growth, real GDP fell by almost 10 per cent in 1930-31 (Chart 5). This had a predictably devastating impact on living standards, with real private consumption expenditure falling by one-fifth from 1929-30 to 1930-31 while real private dwelling investment and imports halved. Real non-dwelling public investment halved over two years and did not recover to pre-Depression levels for a further six years. Following the huge collapse in 1930-31, the economy recovered, and real GDP grew at an average annual rate of 3.7 per cent over the subsequent five years.
Chart 5: Australian real GDP
Source: RBA Statistics, Preliminary Annual Database, ABS Cat No 5206.0 and Treasury.
In contrast, during the current global recession, Australian real GDP has risen in each financial year, and is forecast to continue to do so.
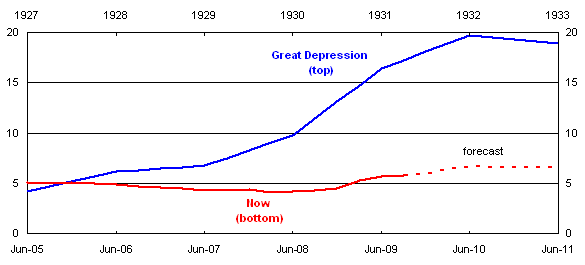
Australia recorded one of the highest rates of unemployment in the world during the Great Depression (Schedvin 1970). Before its onset, unemployment in Australia was already at 7 per cent in 1929. It reached 10 per cent in 1930 and peaked at 19¾ per cent two years later (Chart 6). Unemployment then began to fall by around 2 percentage points a year, to reach 9 per cent by 1937.
Chart 6: Unemployment rate in Australia
(per cent)
Source: RBA Statistics, Preliminary Annual Database, ABS Cat No 6202.0 and Treasury.
The contrast with the current experience is stark indeed. While sluggish growth has seen the unemployment rate rise, the rise thus far has been only about 2 percentage points. The Government's recent Mid Year Economic and Fiscal Outlook forecasts a peak unemployment rate of 6¾ per cent in the June quarter 2010 which, if realised, would constitute a rise of just less than 3 percentage points from its low of 3.9 per cent in February 2008.
However, these simple numerical comparisons do not capture fully the extraordinary hardship experienced during the Great Depression. As well as the much lower standard of living (with average per capita income at the onset of the Great Depression around one fifth of its current level), the absence of a centralised federal unemployment assistance program at that time added immeasurably to the hardship of the unemployed.4
Other than relief from charities and an assortment of agencies and private organisations, the unemployed had to hope for employment projects and public works projects which were often reliant on state government loans from overseas — which, as we will see, had dried up as a source of funds by early 1929.
Main causes of the Great Depression in Australia
Let me now turn to three of the main causes of Australia's economic collapse during the Great Depression. These are: firstly, the extremely unfavourable global environment which, from Australia's point of view, manifest itself particularly in a large and prolonged fall in the terms of trade; secondly, Australia's adherence to the gold standard; and thirdly, Australia's loss of access to the London capital market from early 1929.
The terms of trade
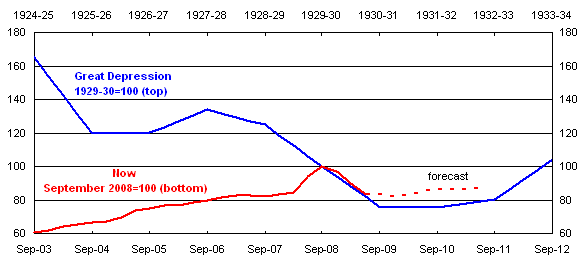
Australia suffered a large and sustained fall in its terms of trade in the mid-1920s, brought about by declines in the prices of Australia's major agricultural exports, particularly wool (Chart 7). This terms of trade fall, combined with Australia's adherence to the gold standard (discussed later), played a key role in generating Australia's balance of payments crisis in the late 1920s.5
In contrast to the severe declines in the terms of trade in the years leading up to the Great Depression, Australia's terms of trade rose by about two-thirds in the five years to September 2008, to be at six-decade highs. The subsequent decline has so far been much less pronounced than at the time of the Great Depression — with the most recent (June 2009) level still more than 50 per cent above the average of the 1990s.
Chart 7: Australia's terms of trade
Source: RBA Statistics, Preliminary Annual Database, ABS Cat No 5206.0 and Treasury.
The gold standard
Australia's exchange rate was determined by the gold standard in the lead up to the Great Depression.6 After being suspended during the First World War, the gold standard was reinstated in Australia following Britain's return to gold in April 1925.
Central to the push to reinstate gold by central bankers in the major economies was a fundamental and long-standing mistrust of the capacity of a system of fiat money, not backed by gold, to deliver economic stability. This mistrust had been reinforced by the economic devastation wrought by the hyperinflation in the Weimar Republic in 1921-23. Although there had been previous hyperinflations, this was the first in a major country at the core of the global economy, and the first to be closely observed and documented by economists.7
It is arguable that the decisions taken by the key central bankers to re-establish the gold standard following its abandonment during the First World War was the primary cause of the Great Depression (see, for example, Ahamed 2009). It certainly rendered it near impossible for central banks across the world to run expansionary monetary policy in response to the collapse.
Given the massive terms of trade declines in the second half of the 1920s, the fixed exchange rate had a devastating effect on Australia. As the external position worsened during 1929, the exchange rate came under pressure. However, the private trading banks, and the Commonwealth Bank, attempted to resist devaluation and tried
instead to maintain parity with sterling throughout 1930 — in part out of the fear of creating inflation (Butlin and Boyce 1985).
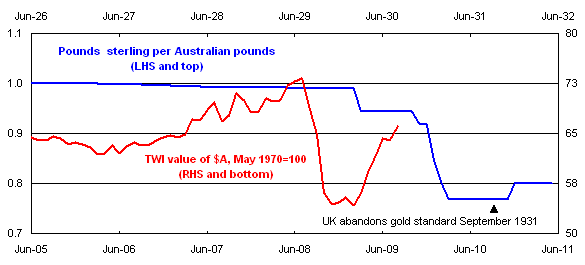
Meaningful devaluation of the Australian pound did not occur until early 1931. By March of that year, the Australian pound had depreciated by around 25 per cent against sterling (Chart 8).8
The decision of the trading banks to resist devaluation led to tight monetary conditions through 1930, which added to the problems of the depression (Butlin and Boyce 1985). Also, the policies of these banks, including the Commonwealth Bank, during 1931 and 1932 acted to delay the reduction in bank interest rates, thereby hampering recovery.
In addition, the low level of foreign exchange reserves in 1930 (a consequence of the failure to devalue earlier) prevented fiscal policy from taking a more active role, and actually forced government spending to be curtailed significantly (Fisher and Kent 1999), as we will discuss shortly.
Chart 8: Australia's exchange rate against benchmark currencies
Note: Great Depression data are spliced from financial year data to 1928-28 and monthly data from March 1930 (due to data limitations only the major devaluations are shown here).
Source: ABS Cat No 5206.0, RBA Statistics, Preliminary Annual Database and Copeland 1934 (quoted in Kindleberger 1986).
Cross-country research has established a striking and revealing correlation: the sooner a country left the gold standard the sooner it recovered from the Great Depression (Eichengreen et al 1985, Bernanke et al 1990). Australia fits this pattern well; indeed, it is one of the countries that helped to establish it (Chart 9).
Chart 9: Real GDP and dates of exit from gold standard
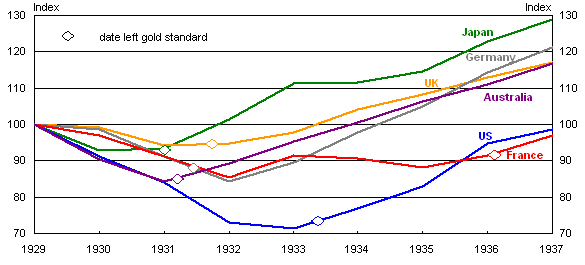
Notes: While Germany went off gold in July and August 1931, it kept the value of the mark steady through the Nazi era, but controlled the flow of foreign exchange. Temin (1989) notes that the German chancellor followed the dictates of the gold standard in 1931 by maintaining high interest rates and deflating the economy. Australian data are not directly comparable to Australian GDP data employed elsewhere in the paper.
Source: GGDC-Maddison International Historical Database (http://www.ggdc.net/Maddison/), Bernanke et al 1990.
In contrast, during the current crisis, Australia's floating exchange rate has played its expected role as a shock absorber for the Australian economy, first by depreciating rapidly (by around 25 per cent in the four months to November 2008), and then, after a period of months, recovering almost as rapidly.
Global capital markets and Australia's balance of payments
Australian governments borrowed heavily from the London capital market during the 1920s to fund a string of large infrastructure investments.9 As a result, Australia's foreign debt increased rapidly. The Commonwealth and state governments ran overdrafts with London banks and paid them off by floating bond issues when either the sums became big enough to warrant it, or the banks providing the overdrafts became restless (Kindleberger 1986).
Borrowing by Australian governments was sufficiently strong that it accounted for 43 per cent of all British overseas investments in government securities over the period 1925–28 (Schedvin 1970). Rising British concerns about poor investment returns, combined with Australia's rapidly rising public debt levels and a severe balance of payments crisis, meant that this situation could not persist. In February 1929 an Australian loan was subscribed to only 16 per cent and had to be taken up by the underwriters. In April the London market refused to issue a loan and virtually ceased to be a source of funds for Australian long-term borrowing.
London banks then pressed Australian governments for payments on overdrafts. Gradually and reluctantly, the Australian banks were required to restrict advances, which put pressure on the local economy (Kindleberger 1986). The resulting cessation of borrowing was an important factor that constrained a more expansionary fiscal policy response to the Great Depression by the Commonwealth and state governments.
The contrast with today is again stark. Following the failure of Lehman Brothers in September 2008, and the actions of a series of governments in guaranteeing bank borrowings, borrowers lacking government guarantees were virtually shut out of world capital markets. With Australian banks' heavy reliance on offshore wholesale borrowing to fund their domestic operations, any incapacity to borrow in these markets would have had severe consequences for the domestic economy. But the strength of the Australian Government's balance sheet meant that it could, for a fee, offer a guarantee to the banks for their wholesale borrowings without risking the Government's AAA credit rating — which ensured continued access to global capital markets, in contrast to the situation 80 years earlier.
Monetary and fiscal policy
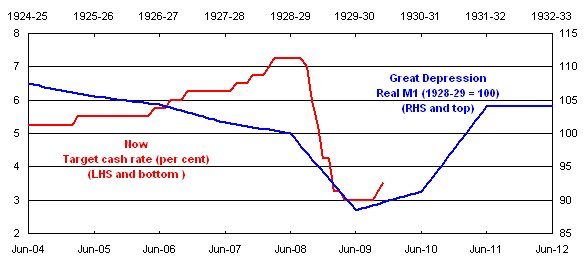
A comparison of monetary policy responses to the Great Depression and the current downturn is made more complex by profound changes in the operating procedure of monetary policy over the intervening years. Chart 10 shows the level of real M1 (M1 adjusted for changes in consumer prices) for the period surrounding the Great Depression, and the official cash rate for the current era.10
Chart 10: Monetary policy response
Source: RBA Statistics, Preliminary Annual Database and RBA Bulletin.
After declining steadily before the onset of the Great Depression, real M1 dropped by 12 per cent between 1928-29 and 1929-30. This behaviour of real M1 supports other evidence that monetary policy was tragically tight as Australia succumbed to the Great Depression (Fisher and Kent 1999, Schedvin 1970).
Again, the contrast with the response of monetary policy to the current downturn could not be starker. Monetary policy was eased aggressively in late 2008 and early 2009, at a time when the exchange rate was depreciating rapidly. That this monetary policy response was possible without generating adverse market reactions (or unanchoring inflation expectations) is a testament to the credibility of the modern monetary policy framework, put in place in the aftermath of the early 1990s recession.
Australia's fiscal policy response to the Great Depression also exacerbated the downturn. While alternative policy responses were canvassed, Australia adopted a policy of controlled deflation.11
In mid-1931, the 'Premiers' Plan' was agreed which focussed on financing the interest repayments to the British banks by large (20 per cent) cuts in government spending and an increase in federal and state taxation.12
The adoption of deflationary policies reflected the recommendation of Sir Otto Niemeyer. Niemeyer, having transferred from HM Treasury to the Bank of England in 1927, came to Australia in 1930. His arrival was a 1930s version of an International Monetary Fund 'mission' to a developing country in financial crisis, but rather than brin
ging financial resources, he brought stern advice (Coleman et al 2006). The Premiers must balance their budgets immediately — in other words, a strongly contractionary policy at a time when national income had fallen dramatically, unemployment was high and rising, and budgets were in substantial deficit because of a major drop in revenue.13
In a celebrated accident of history, Keynes had come second to Niemeyer in the 1906 British Civil Service exams and, as a result, Niemeyer took the Treasury job Keynes would otherwise have had, while Keynes entered the India Office. We can only speculate what the implications would have been for Australia's economic fortunes in the Great Depression had Keynes beaten Niemeyer, and entered the Treasury.
Initially the Premiers' Plan was hailed as a success, but this verdict has not stood the test of time. Viewed from a modern perspective, with recognition of the importance of supporting aggregate demand when private sector spending is in retreat, Australia's policy responses to the Great Depression appear counterproductive, and certainly not supportive of recovery.
Reflecting on these events many years later, Colin Clark was of the view that the Plan was based on mindlessly following public opinion in opting for balanced budgets, regardless of the state of the economy.14
Of course, as we have seen, a combination of external circumstances and the rapid growth in public debt through the 1920s meant that choices were limited. The Commonwealth Government and the Commonwealth Bank resisted proposals for loans to the state governments for public works and job creation on the grounds that they had to conserve their sterling foreign exchange reserves (Clark 1958). Colin Clark notes of the Commonwealth Government (1958 p. 226):
One can understand their predicament; but it is hard to condone their scale of values. Almost any alternative measure would have been preferable to leaving hundreds of thousands of men unemployed for ten years.
During the Great Depression the aggregate government budget balance (for the Commonwealth and state governments) declined from a deficit of 0.5 per cent of GDP in 1928-29 to a peak deficit of 4.0 per cent of GDP in 1930-31 before falling to under 1 per cent two years later (Chart 11). This rise in the budget deficit over these years was a consequence of the collapse in the economy, rather than a result of deliberate expansionary policy.15
Chart 11: Aggregate Government budget balance
(per cent of GDP)
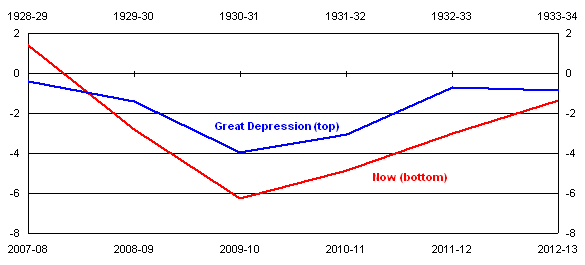
Note: Aggregate Government includes Australian Government and state-territory governments. Australian Government data for the current period are underlying cash balance from the 2009-10 MYEFO. Data from 2009-10 are estimates. State-territory data are equivalent to receipts (from operating activities and sales of non-financial assets) minus payments (for operating activities, purchases of non-financial assets and net acquisition of assets under finance leases). 2007-08 state-territory data are from ABS Government Finance Statistics. 2008-09 to 2012-13 are from States' 2009-10 Budgets with the exception of the ACT which are from its 2009-10 Budget update. 2008-09 data for QLD, Victoria, NSW, WA, Tasmania and the NT are based on 2008-09 final budget outcomes.
Source: Barnard 1987 (Table GF 1-7) and Treasury.
Indeed, real aggregate government expenditure fell by 9 per cent from 1928-29 to 1931-32 — and by 19 per cent in nominal terms (Barnard 1987). Within the expenditure categories, charges for debt increased in the 1930s, in part because of the impact of devaluation on debt denominated in pounds sterling.16
During the current downturn, the Australian Government budget balance (underlying cash) went from a surplus of 1.7 per cent of GDP in 2007-08 to a deficit 2.3 per cent in 2008-09 and an expected 4.7 per cent of GDP in 2009-10, before declining. The swing from surplus in 2007-08 to deficit in 2008-09 was driven by both the largest collapse in Australian Government revenue since the Great Depression, and the discretionary fiscal stimulus packages.17
In the 1930s, the tax base was broadened with increases of existing tax rates and the imposition of new taxes to offset the falls in customs revenue due to reduced imports. Tax receipts as a share of GDP rose by over four percentage points between 1928-29 and 1932-33 (Chart 12). In contrast, during the current downturn, the tax take is estimated to fall by about 3½ per cent of GDP due to a combination of automatic stabilisers and tax cuts.
Chart 12: Aggregate Government tax receipts
(per cent of GDP)
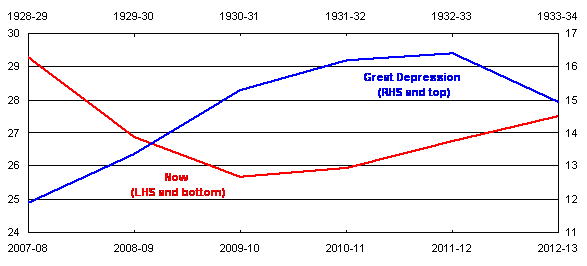
Note: Aggregate Government includes Australian Government and state-territory governments. Australian Government data for the current period are from the 2009-10 MYEFO. Data after 2008-09 are estimates. State-territory data for 2007-08 are from ABS Government Finance Statistics. 2008-09 to 2012-13 are from States' 2009-10 Budgets with the exception of the ACT which are from its 2009-10 Budget update. 2008-09 data for WA, Vic and NT are from 2008-09 final budget outcomes.
Source: Barnard 1987 (Table GF 1-7) and Treasury.
As I have already noted, Australia lost access to the London capital market in 1929 because of high levels of government debt which severely constrained fiscal policy responses to the crisis. Total government gross debt was already well over 100 per cent of GDP before the onset of the Great Depression (Chart 13). With fixed interest loans denominated in pounds sterling these levels increased to a peak of 205 per cent of GDP in 1931-32.
During the current downturn, gross debt for all levels of government has also risen, and is estimated to peak at around 35 per cent of GDP over the next few years.18
Chart 13: Aggregate Government gross debt
(per cent of GDP)
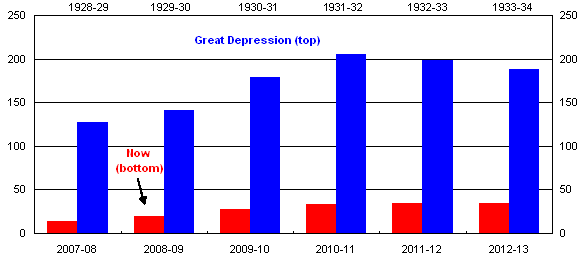
Note: Aggregate Government includes Australian Government and state-territory governments. Australian Government data for the current period are from the 2009 MYEFO. Data after 2008-09 are estimates. Commonwealth Government securities on issue is used for the current period. State-territory data are borrowings of non-financial public sector entities. 2007-08 data are from ABS Government Finance Statistics. 2008-09 to 2012-13 are from States 2009-10 Budgets with the exception of the ACT which are from its 2009-10 Budget update. 2008-09 data for WA, Vic and NT are from 2008-09 final budget outcomes.
Source: Barnard 1987 (Table GF 1-7) and Treasury.
What have we learnt?
At the time of the Great Depression, Australia's macroeconomic policy frameworks were tragically ill equipped to cope with anything other than small, inconsequential macroeconomic or financial market shocks. Faced with a shock the size of the Great Depression, they were simply overwhelmed.
The lessons learnt from that disastrous experience have informed the macroeconomic policy frameworks of today.
An intellectual revolution in our understanding of the behaviour of the macroeconomy has made possible a complete redesign of both the institutional arrangements in which the macroeconomy operates, and the policy responses to macroeconomic or financial market shocks.
A key element of this intellectual revolution, associated with Keynes' General Theory, is recognition of the importance of supporting aggregate demand in the economy at times when private sector demand is in retreat.
An important corollary to this recognition, however, is that to be in a position to provide such support at such times requires a credible medium-term framework for macroeconomic policy. Such a framework enables policy actions designed to support aggregate demand in the short term to be explained in the context of the medium-term framework.
In the case of monetary/exchange rate policy, the redesign of the framework has been a profound one. The gold standard no longer sits at the core of the system. The gold standard was clearly successful in ruling out any possibility of sustained high inflation or hyperinflation, but it was woefully inadequate when the economy was faced instead with a severe contractionary shock.
By contrast, the key elements of the modern monetary policy framework are, of course, a floating exchange rate and an independent central bank committed to medium-term price stability. Once credibility for this framework has been established, it provides a clear, medium-term anchor for inflation. Importantly, however, it also provides the capacity for monetary policy to respond flexibly — and if need be rapidly and aggressively — to short-term macroeconomic shocks. This flexibility has been particularly important in the face of shocks to Australia's terms of trade.
The rapid easing of Australian monetary policy in late 2008 and early 2009 is an impressive example of this flexibility in action. That this monetary policy response did not generate adverse market reactions or unanchor inflation expectations, despite it occurring at a time when the exchange rate was depreciating rapidly, is a testament to the credibility of the modern monetary policy framework.
For fiscal policy, Australian governments borrowed so heavily in the 1920s that Australia was cut out of the London capital market when the economic outlook deteriorated in 1929. The contrast with recent times is stark. From the mid-1980s onwards, Federal Governments of both political persuasions have demonstrated the resolve needed to bring deficit budgets back into surplus after the economy has recovered from recession, and have committed themselves to increasingly well-articulated medium-term frameworks for fiscal policy. The discretionary fiscal policy actions in late 2008 and early 2009, which provided substantial and rapid support to aggregate demand at a crucial time, were undertaken in the context of a medium-term fiscal framework that included an explicit, articulated strategy to return the budget to surplus once the economy returned to above-trend growth.19
All these elements together (along with an improving external environment, strongly supported by expansionary monetary and fiscal policies in the rest of the world) have made possible a radically different outcome to the current global recession than would have been possible with the macroeconomic policy frameworks in place at the time of the Great Depression.
These outcomes would surely be gratifying to those economists, including Colin Clark, who worked over the intervening decades to develop the economic and statistical tools to better our understanding of the macroeconomy and help prevent the devastation of another Great Depression.
References
Ahamed, L 2009, Lords of Finance: The bankers who broke the world, New York.
Barnard, A, 1987, 'Government Finance', Chapter 15 of Vamplew (1987), pp. 254-285.
Bernanke, B and James, H 1990, The gold standard, deflation and financial crisis in the Great Depression: An international comparison, Working Paper No. 3488, NBER.
Butlin, M W and Boyce, P M 1985, 'Monetary Policy in Depression and Recovery', Australian National University Working Papers in Economic History, No. 44.
Clark, C 1958, Australian Hopes and Fears, London, Hollis and Carter.
Coleman, W, Cornish, S, Hagger, A 2006, Giblin's Platoon: The trials and triumphs of the economist in Australian public life, ANU E Press.
Copeland, D B 1934, Australia in the world crisis, 1929–33, Cambridge University Press, London.
CBO (Congressional Budget Office) 2009, The Long Term Budget Outlook, http://www.cbo.gov/doc.cfm?index=10297 (Accessed October 2009).
CPB (Netherlands Bureau for Economic Analysis) 2009, International Cyclical Analysis: world-trade monitor, http://www.cpb.nl/eng/research/sector2/data/trademonitor.html (accessed 15 September 2009).
Eichengreen, B and Sachs, J 1985, 'Exchange rates and economic recovery in the 1930s', Journal of Economic History, 45: 925-46.
Eslake, S 2009, The global financial crisis of 2007–09 — An Australian perspective, The 2009 Shann Memorial Lecture, University of Western Australia, 19 August.
Fisher, C and Kent, C 1999, 'Two Depressions, one banking collapse', Research Discussion Paper, 1999-06, Reserve Bank of Australia.
Keynes, J M 1925, The Economic Consequences of Mr Churchill, L and V Woolf, London.
Keynes, J M 1931 (in) The Collected Writings of John Maynard Keynes, Macmillan, St Martin's Press for the Royal Economic Society (1971–1983).
Keynes, J M 1936, The General Theory of Employment, Interest and Money, Macmillan Cambridge University Press
Kindleberger, C P 1986, The world in depression, 1929–1939, University of California Press.
League of Nations 1939, World Economic Survey: Eighth Year 1938/39, Economic Intelligence Service, Geneva.
Markwell, D 2000, 'Keynes and Australia', Research Discussion Paper, 2000-04, Research Department, Reserve Bank of Australia and New College, Oxford.
Perkins, J 2008, 'The Great Depression Revisited', Australian Quarterly, Volume 80, Issue 5, pp. 4–5.
Productivity Commission 2009, Annual Report 2008-09, Annual Report Series, Productivity Commission, Canberra.
Pope, D 1987, 'Private Finance', Chapter 14 of Vamplew (1987).
Schedvin, C B 1970, Australia and the Great Depression: A study of economic development and policy in the 1920s and 1930s, Sydney University Press.
Temin, P 1989, Lessons from the Great Depression, Cambridge MA: MIT Press.
Vamplew, W 1987, Australians: Historical Statistics, Fairfax, Syme and Weldon Associates, Sydney.
1 The authors are grateful to Rebecca Brown, Paul Dearlove, Katrina Di Marco, Angelia Grant, Tim Hatton, Steven Kennedy and Robert Seaton for helpful contributions and comments. The views expressed are those of the authors and not necessarily those of the Australian Government or Australian Treasury.
2 In drawing comparisons between the 1920s/30s and now, it should be remembered that there are unavoidable differences between data collected then and now. There have been profound changes in collection methodology, including definitions of unemployment, and in accounting practices, and modern measures of most types of economic activity are much more detailed than was possible 80 years ago.
3 US stock prices (the Dow Jones Industrial Average) increased by 240 per cent in the five years leading up to the stock price peak before the Great Depression compared to a more modest 75 per cent rise (in the S&P 500) duri
ng the most recent episode. A number of other parallels between the two episodes have been noted, particularly in the US, including rapid financial innovation facilitated in part by new technologies; an extended period of loose monetary policy followed by relatively rapid tightening; relaxation of credit standards; increased leverage of financial institutions and households; increased fraud and other forms of criminal behaviour; and pervasive expectations of continued asset price appreciation combined with a widespread failure to comprehend and price risks appropriately (Eslake 2009).
4 Commonwealth unemployment and sickness benefits were introduced in 1945 in the form of flat-rate payments financed from general revenue and subject to an income test. During the Great Depression, state governments had a support payment called 'the susso', short for sustenance payments. These varied by State but provided bare minimum support, with strict controls on what could be purchased with the coupons provided.
5 Australia's exports were much less diversified at that time than they are today, both in terms of the commodity mix and the limited number of destinations to which the exports were sent. Agriculture accounted for 90 per cent of exports, with wool accounting for more than 40 per cent on its own. Around two-thirds of exports were sold to the UK and a few major European countries.
6 Under the gold standard, Australia's exchange rate moved within a narrow range, determined by gold points. Gold points were the level of the exchange rate at which it became more profitable to import or export gold instead of buying or selling bills of exchange at bank rates.
7 For more on this, see Ahamed (2009). The transition back to gold after the First World War was fraught with difficulties. Churchill's decision to set the gold price in Britain at its pre-war level forced substantial consumer price deflation, and prompted Keynes to voice his disagreement in The Economic Consequences of Mr Churchill (1925). Keynes continued to argue against the Gold Standard until it was abandoned in 1931.
8 Although there had been small divergences from strict parity (of around 1 per cent) from as early as 1928, devaluation of the Australian currency (which was then euphemistically known as 'developing a premium' on sterling) is recorded as beginning in December 1929, but these devaluations were small and relatively inconsequential. In December 1931 the Commonwealth Government fixed the exchange rate at 1 pound 5 shillings Australian per 1 pound sterling — a depreciation of 25 per cent — where it stayed for three and a half decades until the introduction of decimal currency in 1966.
9 While New York was developing as a source of funds for Australian governments in the late-1920s the majority of borrowing was still done in London. Australia enjoyed trustee status in London due to the Colonial Stock Act of 1900, which gave it a privileged position relative to domestic (UK) borrowers. Australian governments generally were able to receive low-interest rates without much preliminary scrutiny (Schedvin 1970).
10 At the time of the Great Depression, M1 comprised currency held by the public plus current deposits at trading banks (Pope 1987).
11 The other suggested alternatives were moderate fiscal expansion, and repudiation of the overseas debt obligations (known as 'the Lang Plan' after NSW Premier, Jack Lang).
12 The Commonwealth Government first accepted the deflationary approach in a 1930 conference which involved the state premiers and Prime Minister Scullin. It was there that the Commonwealth Government and all state governments decided to follow 'the Melbourne Agreement'. This involved decreasing welfare payments, reducing the basic wage by ten percent and abandoning public works projects — all in an attempt to rein in government spending. They also agreed to increase taxation in order to raise revenue (Fisher and Kent 1999). In May/June 1931 the deflationary elements of the Melbourne Agreement formed the basis of the Premiers' Plan, which was eventually agreed to be implemented by most state premiers and the Commonwealth Government. A report by a committee of Professors Copland, Giblin, Shann and Melville in May 1931 helped lay the basis for the Plan. It also proposed reductions in interest rates, but adherence to the gold standard prevented this from occurring during 1930, and even when the gold standard was abandoned, banks had little reserves left with which to extend credit (Fischer and Kent 1999).
13 The Commonwealth Government suffered sharp and sustained falls in customs revenue in the Great Depression while the state governments suffered major reductions in receipts from government businesses — which were then their major source of revenue.
14 Clark (1958, p. 222) noted that the Premiers' Plan to balance Commonwealth and state budgets '[w]as certainly harmful. This action prolonged the depression and made unemployment very much worse than it would otherwise have been.'
15 Clark (1958, p. 221) noted that: 'In 1930, quite apart from the question of finding any money to occupy the unemployed, the budget deficit was rapidly enlarging. The Commonwealth Bank, however, declined to lend the Commonwealth or state governments any more money. Whether or not one approves of the politics of this decision, it was certainly extremely bad economics. The most abundant expenditure of loan money and the largest deficit would have been fully justified at such a time'. Much of the Federal Government deficit during the early 1930s appears to have been financed by the sale of treasury bills to the Commonwealth Bank (although precise data are not readily available). Fisher and Kent (1999) note that the extent of this finance was limited by the Commonwealth Bank because of its fears regarding inflation over the longer term. The Commonwealth Bank also pressured the Government to reduce the stock of outstanding Treasury bills from 1932 until the end of 1935 (Fisher and Kent 1999).
16 Perkins (2008) notes that a significant proportion of both Commonwealth and state budget outlays at the time were interest payments on debt owned by UK bondholders.
17 Australian Government total receipts for 2008-09 were $20 billion, or 6.5 per cent, below the estimate in the 2008-09 Budget (Treasury Final Budget Outcome 2008-09). This is the largest fall in receipts compared to the budget year forecast since 1930-31, when the shortfall was 17 per cent.
18 Around half of this is Australian Government gross debt, which is projected to increase from 5.2 per cent in 2007-08 to a peak of 18 per cent of GDP in 2011-12 (when Australian Government net debt is projected to be 8.9 per cent of GDP). Interestingly, the US experience is quite different in the two episodes. US Federal debt held by the public during the Great Depression rose from 15 per cent of GDP in 1929 to 44 per cent five years later. During the current crisis, it is projected to rise from 44 per cent of GDP in 2008 to 61 per cent by 2010 (CBO 2009).
19 I leave to another day a discussion of the reasons why discretionary fiscal policy fell out of favour in recent decades, but w
as embraced in response to the global financial crisis of 2008-09, and played a crucial role.